How to Build a Fully Autonomous Local Fleet-Maintenance Analysis Agent Using SmolAgents and Qwen Model
Why It Matters
On‑premise autonomous agents lower latency and data‑privacy risks while delivering real‑time predictive‑maintenance insights for fleet operators. This approach illustrates how businesses can embed LLM reasoning directly into operational pipelines without relying on cloud services.
How to Build a Fully Autonomous Local Fleet-Maintenance Analysis Agent Using SmolAgents and Qwen Model
By Michal Sutter
In this tutorial we walk through the process of creating a fully autonomous fleet‑analysis agent using SmolAgents and a local Qwen model. We generate telemetry data, load it through a custom tool, and let our agent reason, analyze, and visualize maintenance risks without any external API calls. At each step we see how the agent interprets structured logs, applies logical filters, detects anomalies, and finally produces a clear visual warning for fleet managers.
Full code notebook:
SmolAgents Fleet Maintenance Autonomous Agent (GitHub)
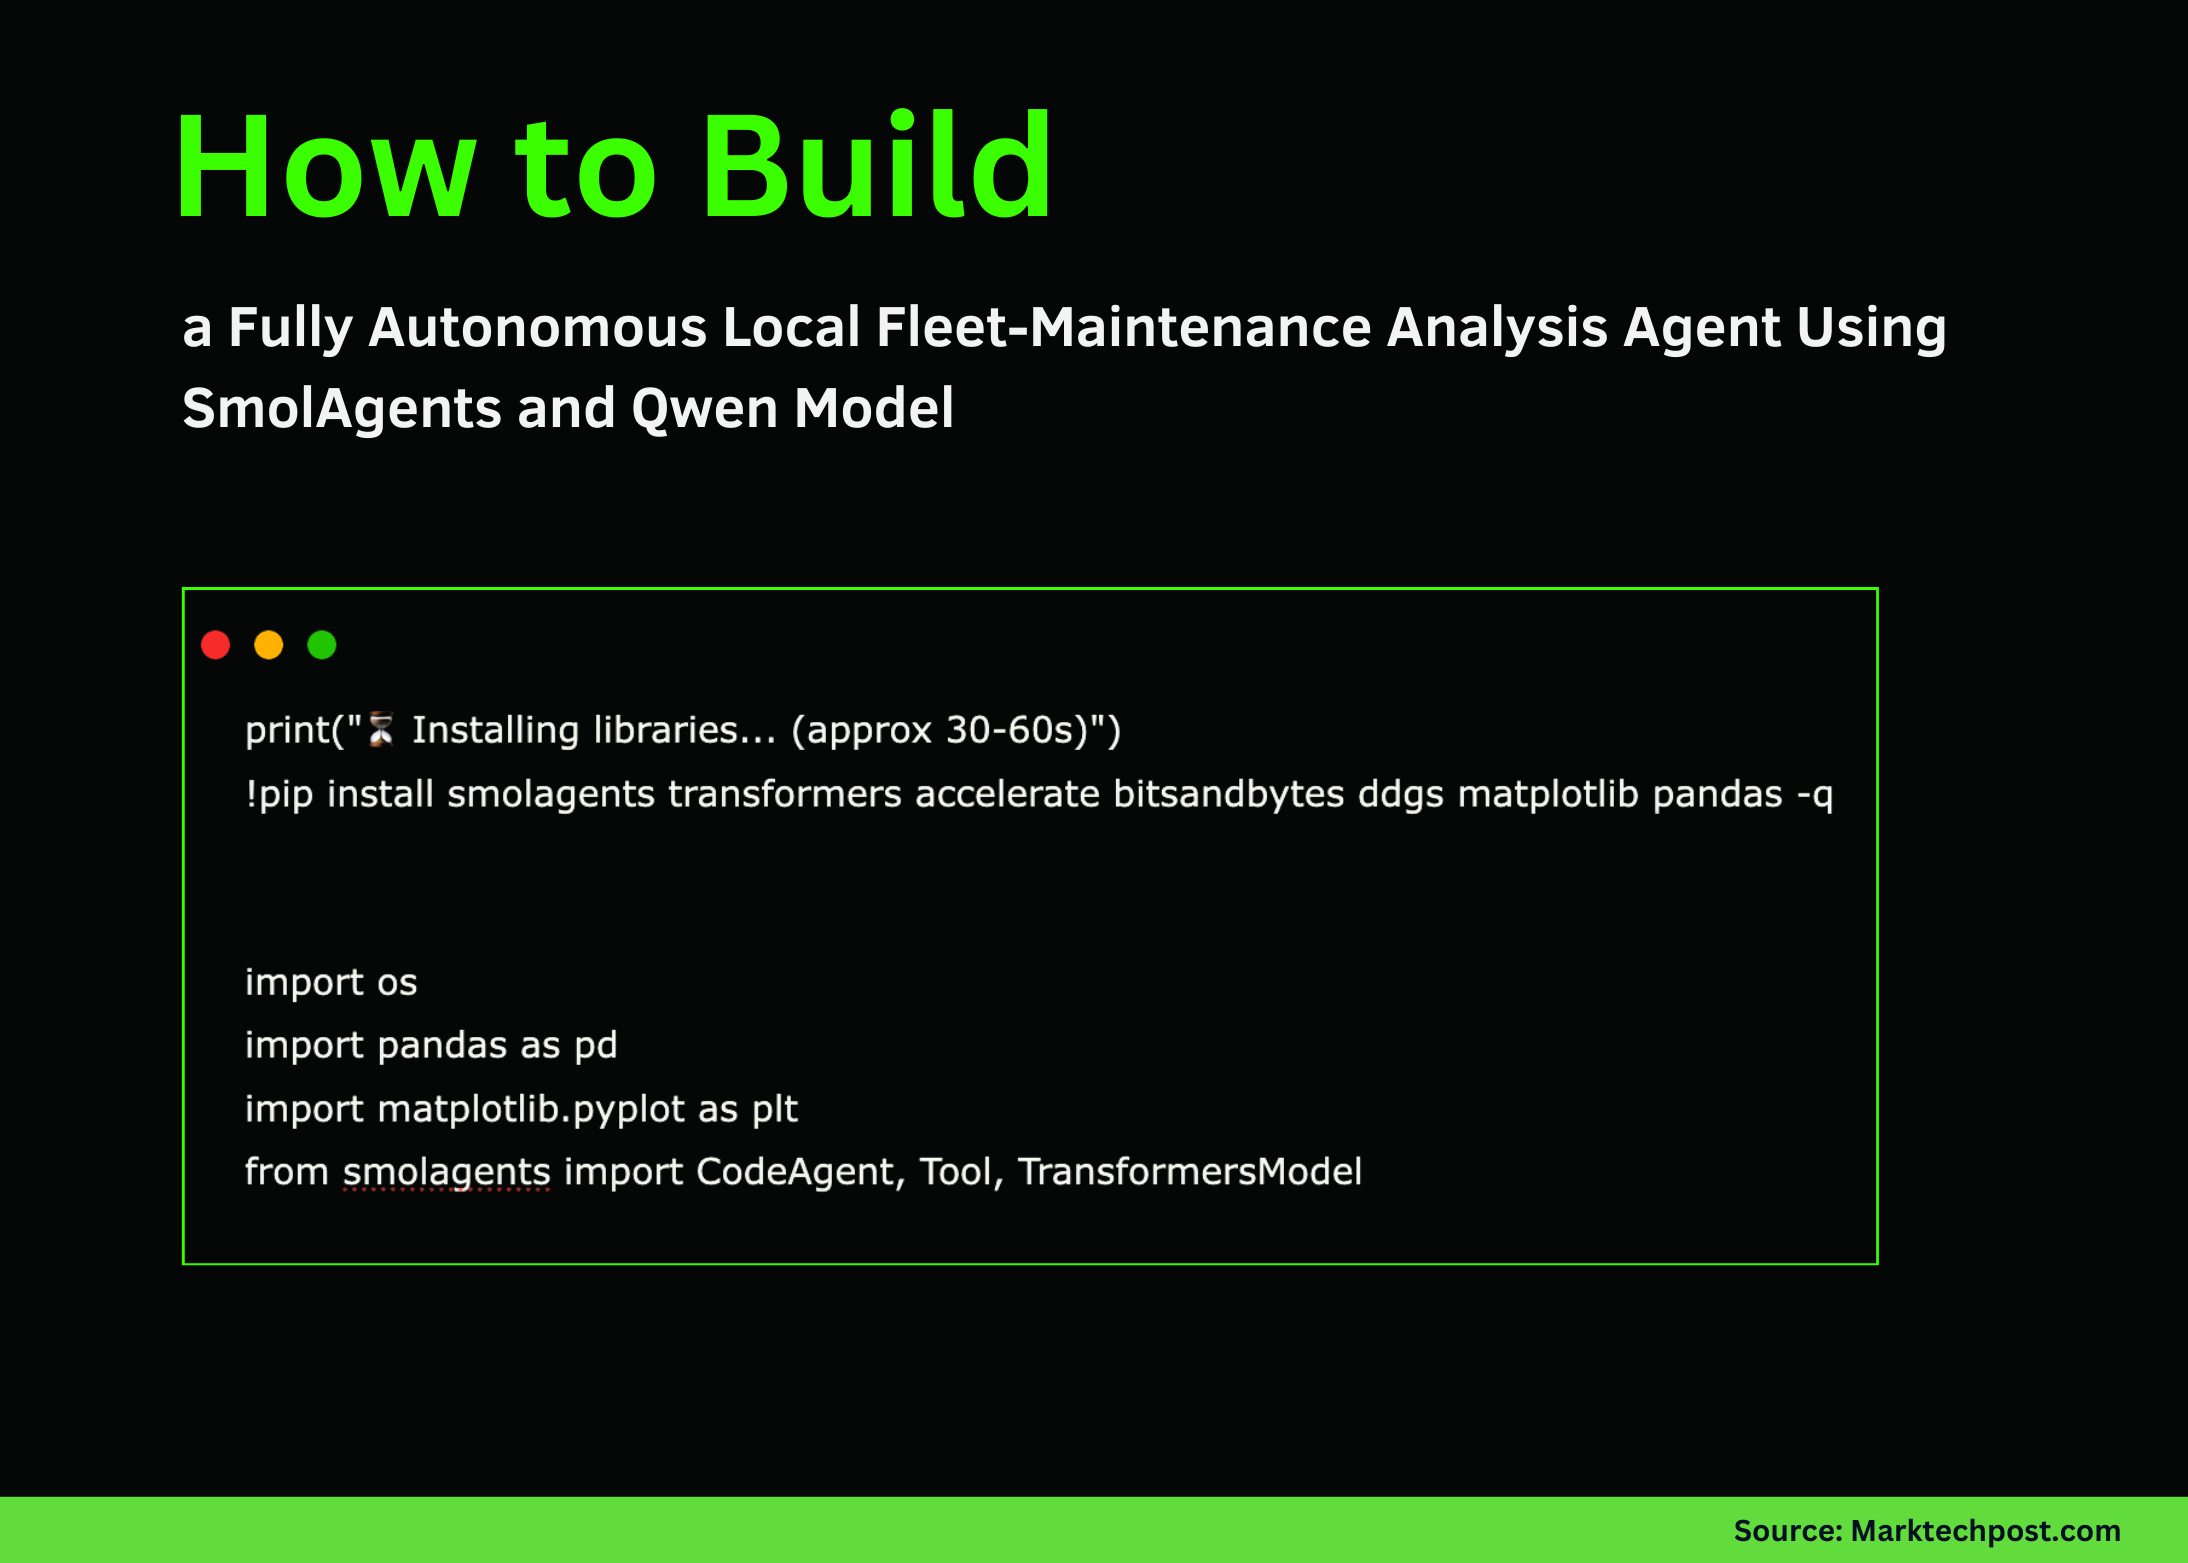
1. Install required libraries
print(" Installing libraries... (approx 30-60s)")

!pip install smolagents transformers accelerate bitsandbytes ddgs matplotlib pandas -q


import os

import pandas as pd

import matplotlib.pyplot as plt

from smolagents import CodeAgent, Tool, TransformersModel
We install all required libraries and import the core modules needed to build the agent, process telemetry, and run the local model smoothly.
2. Create a dummy fleet dataset
fleet_data = {

   "truck_id": ["T-101", "T-102", "T-103", "T-104", "T-105"],

   "driver": ["Ali", "Sara", "Mike", "Omar", "Jen"],

   "avg_speed_kmh": [65, 70, 62, 85, 60],

   "fuel_efficiency_kml": [3.2, 3.1, 3.3, 1.8, 3.4],

   "engine_temp_c": [85, 88, 86, 105, 84],

   "last_maintenance_days": [30, 45, 120, 200, 15]

}

df = pd.DataFrame(fleet_data)

df.to_csv("fleet_logs.csv", index=False)

print(" 'fleet_logs.csv' created.")
The DataFrame mimics realistic telemetry fields and is saved as fleet_logs.csv, which will serve as the data source for the agent.
3. Define a custom tool for loading the logs
class FleetDataTool(Tool):

   name = "load_fleet_logs"

   description = "Loads vehicle telemetry logs from 'fleet_logs.csv'. Returns the data summary."

   inputs = {}

   output_type = "string"


   def forward(self):

       try:

           df = pd.read_csv("fleet_logs.csv")

           return f"Columns: {list(df.columns)}\nData Sample:\n{df.to_string()}"

       except Exception as e:

           return f"Error loading logs: {e}"
FleetDataTool bridges the agent and the CSV file, allowing the model to inspect the data structure and contents.
4. Load the local Qwen model and initialise the agent
# Load the local Qwen2.5 model (adjust the path as needed)

model = TransformersModel.from_pretrained("Qwen/Qwen2.5-7B-Instruct", device="cuda")


# Initialise the CodeAgent with the custom tool

agent = CodeAgent(

    model=model,

    tools=[FleetDataTool()],

    system_prompt="You are an autonomous fleet‑maintenance analyst. Use the provided tool to load data, then reason step‑by‑step to identify high‑risk vehicles and generate a maintenance chart."

)


# Define the query that drives the reasoning process

query = """

1. Load the fleet telemetry logs.

2. Identify any trucks with engine temperature > 100 °C or last maintenance > 150 days.

3. Rank the risky trucks by a combined risk score (temperature weight 0.6, maintenance weight 0.4).

4. Produce a bar chart showing the risk score for each truck.

5. Return a short summary of the findings and the chart image path.

"""


# Execute the query

result = agent.run(query)

print(result)
The agent now autonomously loads the data, performs the analysis, and creates a visual output.
5. Visualise the generated maintenance chart
If the agent successfully saved a chart (e.g., risk_chart.png), display it:
from IPython.display import Image, display

display(Image("risk_chart.png"))
The chart provides a clear, interpretable view of which vehicles require immediate attention.
Conclusion
We built an end‑to‑end pipeline that enables a local model to:
-
Load telemetry data via a custom tool.
-
Evaluate fleet health and identify the highest‑risk vehicle.
-
Generate a diagnostic chart for actionable insights.
The framework can be extended to larger, real‑world datasets, enriched with additional tools, or combined with multi‑step reasoning for safety, efficiency, and predictive‑maintenance use cases. SmolAgents makes it straightforward to create practical agentic systems that execute real code, reason over real telemetry, and deliver immediate insights.
About the author
Michal Sutter is a data‑science professional with a Master of Science in Data Science from the University of Padova. With a solid foundation in statistical analysis, machine learning, and data engineering, Michal excels at transforming complex datasets into actionable insights.
Comments
Want to join the conversation?
Loading comments...