Forecast Performance of RMA Expected Yields: Comparison of Yield Projection Methods
Key Takeaways
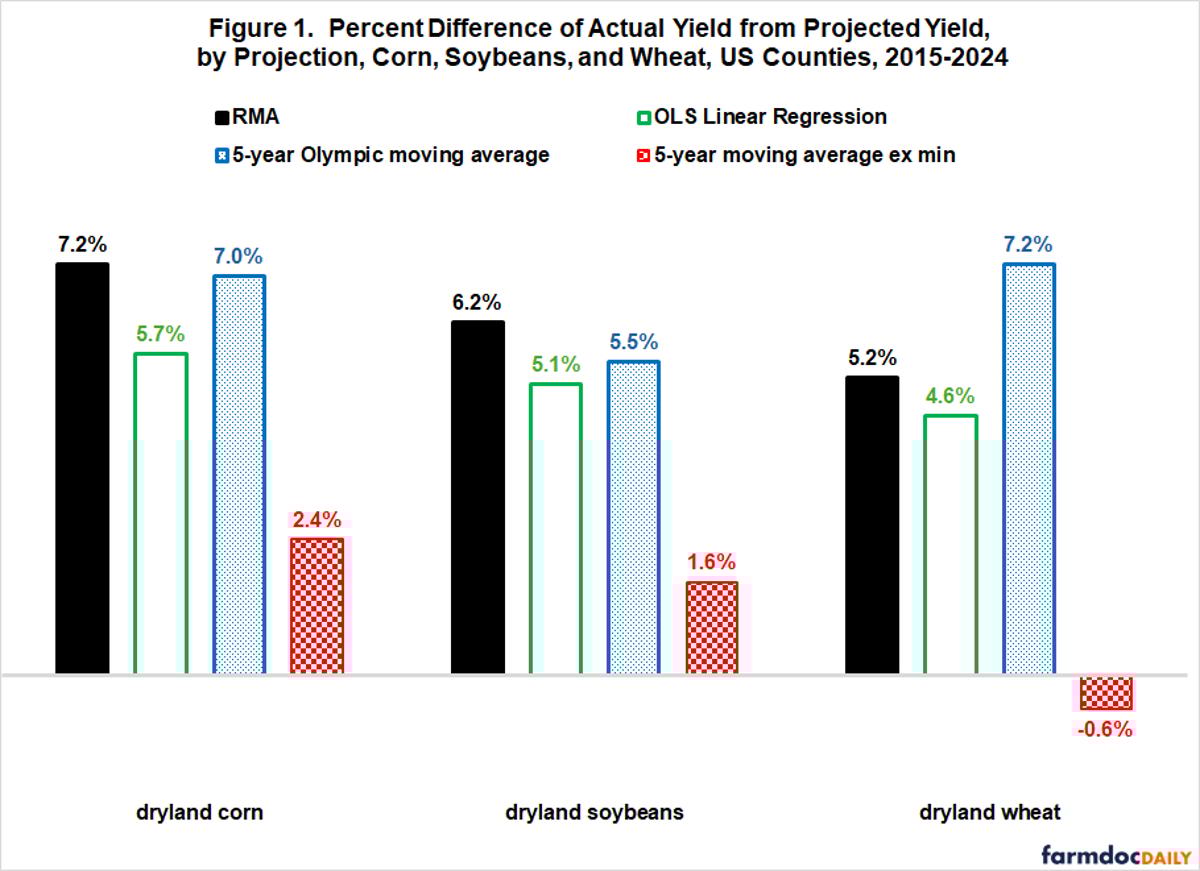
- •RMA projections lag behind actual yields for 2015‑2024 period.
- •5‑year moving average excluding minimum yields most accurate for corn, soy, wheat.
- •This method also produces highest ECO 95 % RP per‑acre payments.
- •OLS regression ranks second in accuracy, but lower payments than moving average.
Pulse Analysis
Yield forecasting is a cornerstone of U.S. agricultural risk management, guiding both premium setting and indemnity calculations for federal crop insurance. The USDA’s Risk Management Agency traditionally relies on regression‑based projections that incorporate long‑term yield trends, yet the latest analysis shows those forecasts have drifted substantially from observed county yields since 2015. By contrast, a simple 5‑year moving average that discards only the lowest observation aligns more closely with actual harvest outcomes, delivering percent‑differences as low as 1‑2 % for dry‑land corn, soybeans and wheat.
The divergence between projected and actual yields has a direct monetary impact because insurance payouts are inversely tied to the projected figure. When a method overestimates yields, the loss ratio shrinks and farmers receive smaller ECO 95 % RP indemnities. The study quantifies this effect: the minimum‑excluded moving average not only outperforms RMA’s regression in accuracy but also yields the highest per‑acre payments—up to 3.8 % of insured acreage for wheat—while RMA’s own projections generate the lowest payouts, often below 3 %. This pattern holds across the three staple row crops and extends, albeit with variations, to cotton and irrigated rice.
For policymakers and market participants, the findings make a compelling case for revising the default projection methodology used in federal crop insurance programs. Adopting the minimum‑excluded moving average could enhance fairness by aligning indemnities more closely with true production shortfalls, while also reducing the systematic bias that has favored insurers under RMA’s current model. Moreover, the approach is transparent, data‑light, and already employed in the ARC commodity program, easing the transition. As climate variability intensifies yield volatility, more reliable, low‑bias forecasts will become essential for sustaining farm profitability and the fiscal health of the USDA’s insurance portfolio.
Forecast Performance of RMA Expected Yields: Comparison of Yield Projection Methods
Comments
Want to join the conversation?