Bitcoin’s $70,000 to $80,000 Zone Highlights Gap in Historical Price Support
•December 25, 2025
0
Companies Mentioned
Why It Matters
Weak historical support at $70k‑$80k raises the risk of a deeper downside if Bitcoin retests this band, influencing trader positioning and risk management. Market participants should monitor this zone as a potential catalyst for volatility.
Key Takeaways
- •$70k‑$80k band saw only 28 trading days.
- •$80k‑$90k band had 49 days, still low support.
- •$30k‑$50k zones each had ~200 days consolidation.
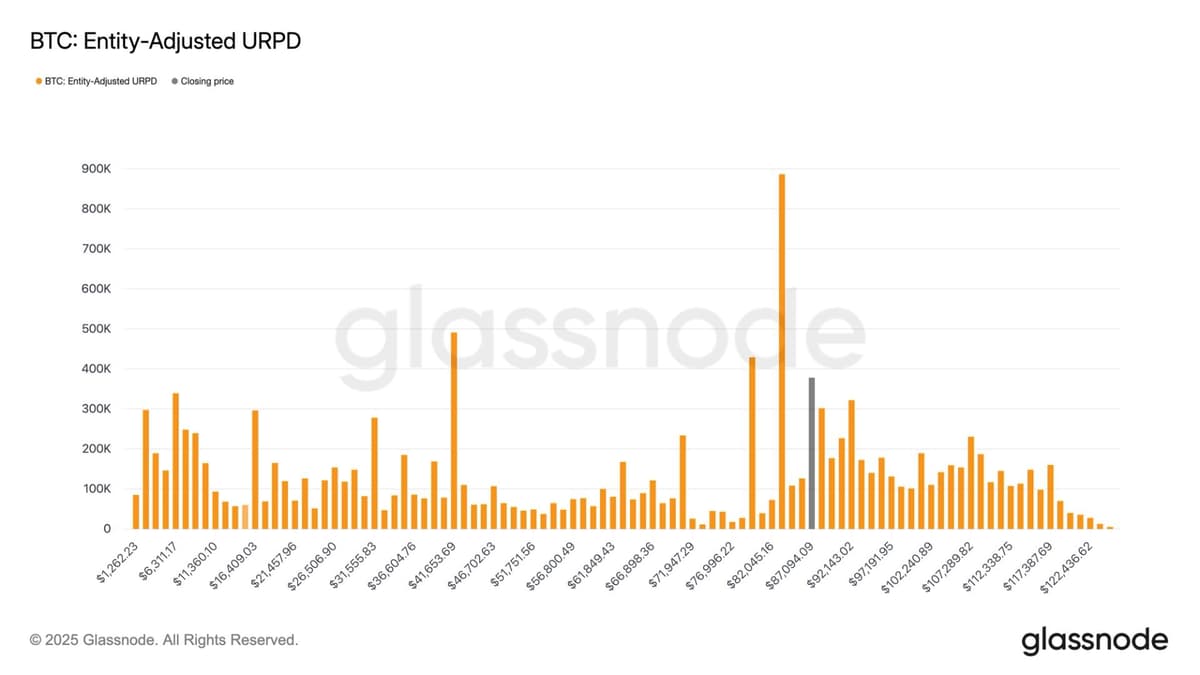
- •URPD shows minimal supply concentration at $70k‑$80k.
- •Future corrections may test weak $70k‑$80k support.
Pulse Analysis
Understanding price support in Bitcoin hinges on how often the asset consolidates within a range. The CME futures dataset, spanning half a decade, quantifies this by counting trading days per band. When a price level is repeatedly visited, market participants accumulate positions, creating a cushion that can absorb sell pressure. The stark contrast between the barely‑touched $70k‑$80k zone and the heavily‑tested $30k‑$50k corridor highlights where historical buying interest has been strongest, offering a clear map of where support is most resilient.
For traders and institutional investors, the scarcity of days in the $70k‑$80k band translates into heightened risk. With only 28 sessions recorded, there is limited precedent for how large orders might be absorbed if price slides back into this range. Glassnode’s UTXO Realized Price Distribution reinforces the narrative, showing a thin supply concentration at those levels, meaning fewer holders have cost bases there to defend the price. Consequently, market makers may widen bid‑ask spreads, and volatility could spike as participants adjust stop‑losses and hedge exposures.
Looking ahead, the $70k‑$80k corridor could become a decisive battleground. Should Bitcoin experience another corrective wave, the lack of established support may trigger sharper declines before a new consolidation phase can form. Analysts recommend monitoring on‑chain metrics and futures open interest for early signals of stress. Portfolio managers might consider diversifying exposure or employing options strategies to mitigate downside risk, while keeping an eye on macro factors that could amplify price swings. In a market where historical support patterns guide expectations, the current gap underscores the importance of data‑driven risk assessment.
Bitcoin’s $70,000 to $80,000 zone highlights gap in historical price support
0
Comments
Want to join the conversation?
Loading comments...