Polkadot Slides 4% as Technical Resistance Triggers Selloff
•November 25, 2025
0
Why It Matters
The drop underscores the sensitivity of crypto assets to technical thresholds, signaling potential downside risk for investors and prompting traders to reassess short‑term positioning in Polkadot and similar altcoins.
Key Takeaways
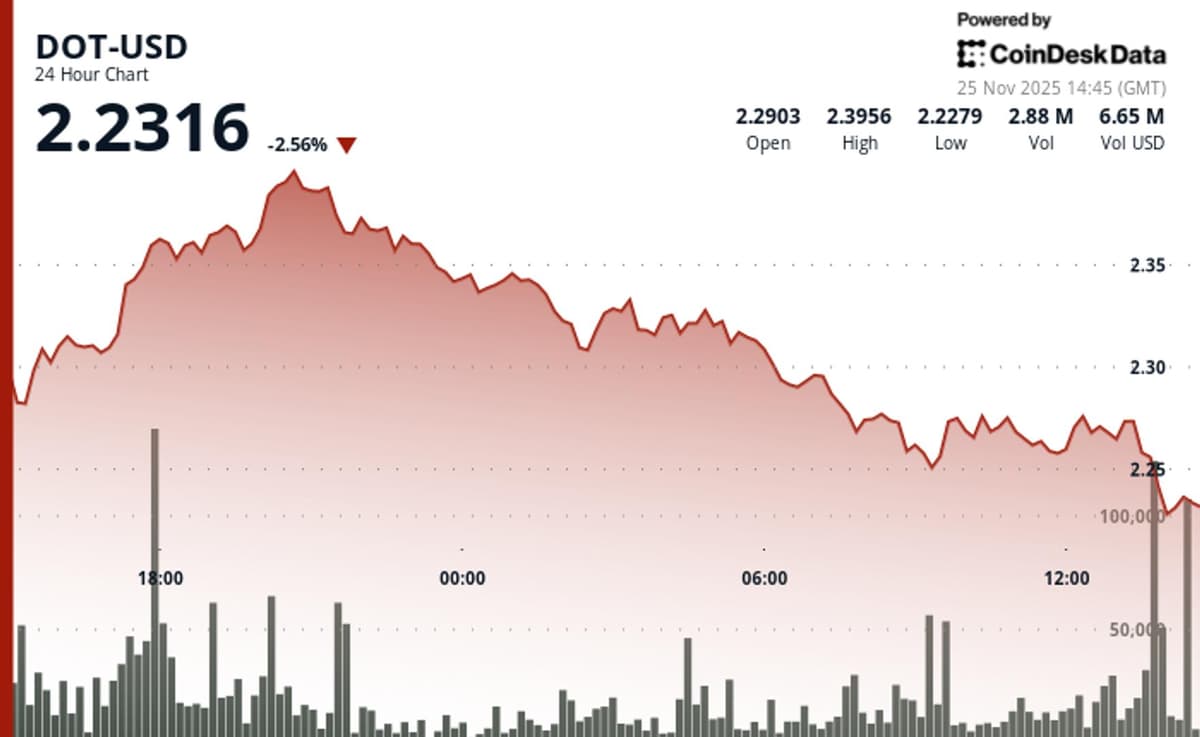
- •Polkadot dropped 4% hitting key resistance level
- •9% intraday volatility signaled heightened trader anxiety
- •Trading range narrowed to $0.21 amid sell pressure
- •Potential spillover to broader DeFi market expected
- •Technical charts show bearish divergence on MACD
Pulse Analysis
Technical resistance levels act as price ceilings that, when breached, often trigger rapid reversals. In DOT's case, the resistance hovered near the $X.XX mark, and once the price slipped below, automated sell orders and algorithmic traders accelerated the decline. Coupled with a 9% intraday swing, the narrow $0.21 range highlighted a market caught between short‑term speculation and longer‑term positioning, a pattern frequently observed in high‑volatility crypto assets.
The ripple effect extends beyond Polkadot itself. As a prominent layer‑1 protocol supporting a vibrant DeFi ecosystem, DOT’s price weakness can erode confidence in related tokens, especially those that rely on its parachain slots for scalability. Recent MACD bearish divergence and weakening volume suggest that traders are reallocating toward assets perceived as safer, such as Bitcoin or Ethereum, or even moving into stablecoins. This behavior amplifies cross‑asset correlations, making the broader crypto market more susceptible to technical triggers.
Looking ahead, market participants will monitor whether DOT can reclaim the resistance zone or settle into a lower consolidation range. Key metrics to watch include on‑chain activity, parachain auction demand, and macro‑level risk sentiment driven by regulatory news. Traders might employ tighter stop‑losses given the observed volatility, while long‑term investors could view the dip as a buying opportunity if fundamentals remain strong. Ultimately, the episode reinforces the importance of technical analysis in crypto trading, especially for assets with high liquidity and active developer communities.
Polkadot Slides 4% as Technical Resistance Triggers Selloff
0
Comments
Want to join the conversation?
Loading comments...