Why It Matters
The breakdown signals increased selling pressure from larger players, raising short‑term risk for investors and potentially influencing broader market sentiment toward proof‑of‑stake ecosystems.
Key Takeaways
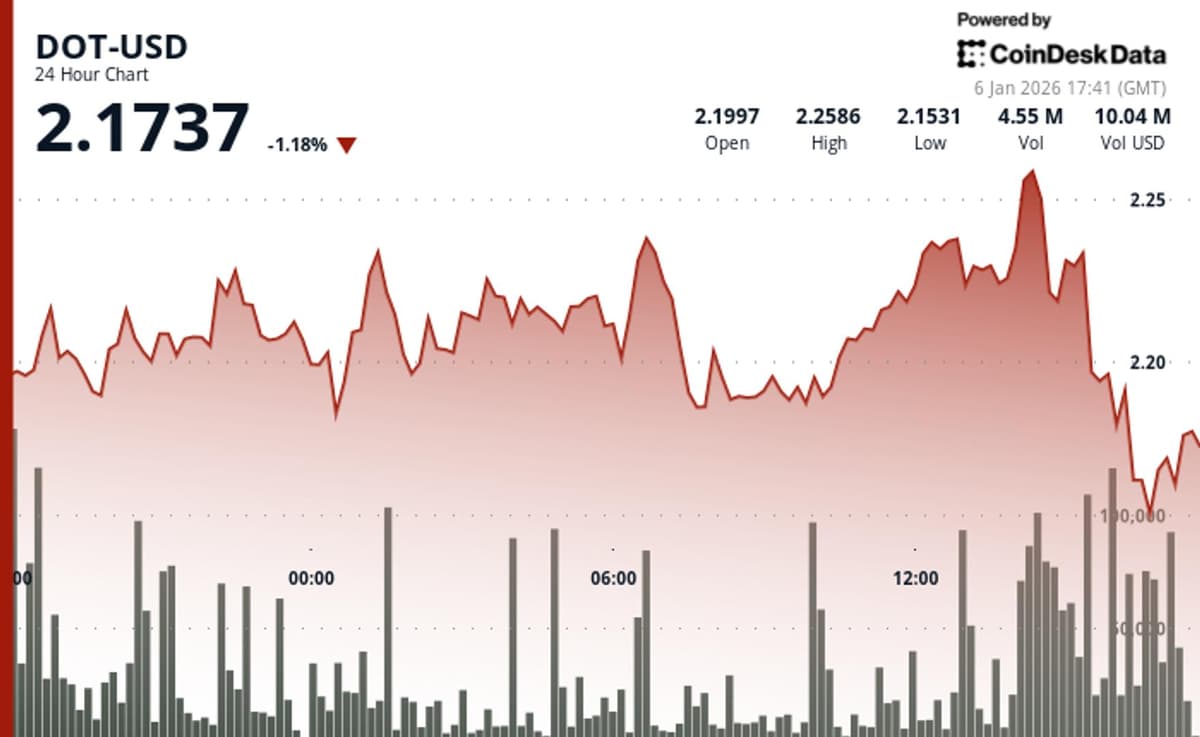
- •DOT fell 3.3% to $2.19, breaking key support.
- •24‑hour volume up 17% above 30‑day average.
- •Institutional selling indicated by elevated volume, not retail panic.
- •Resistance at $2.24‑$2.26 blocked breakout attempt.
- •Next support zone lies between $2.14 and $2.15.
Pulse Analysis
The recent DOT price action underscores how quickly momentum can reverse in the cryptocurrency market, especially when key technical thresholds are breached. While the broader crypto index slipped modestly, DOT’s sharper decline reflects a confluence of heightened trading volume and a failed breakout attempt at the $2.24‑$2.26 resistance band. Analysts interpret the 17% volume spike as a sign that institutional participants are reallocating assets, a behavior that often precedes more sustained downtrends in proof‑of‑stake networks.
From a technical perspective, DOT’s chart now displays a classic bearish pattern: a series of lower highs followed by a decisive break below the $2.19 support zone. This shift redefines the immediate resistance at the broken level and pushes the next critical demand area down to $2.14‑$2.15. Traders monitoring price action will watch for a retest of $2.19; a successful rebound could halt the downtrend, whereas further erosion would likely trigger stop‑loss orders and deepen the sell‑off.
For portfolio managers and crypto‑focused funds, the DOT slide serves as a reminder to balance exposure across volatile assets. The elevated volume suggests that larger holders are exiting positions, potentially to reallocate capital into higher‑yielding staking opportunities or to hedge against macro‑economic uncertainty. Incorporating robust risk‑management protocols—such as dynamic position sizing and stop‑loss thresholds—can mitigate the impact of sudden technical breakdowns while preserving upside potential if DOT recovers.
Polkadot's DOT declines in U.S. afternoon selloff
0
Comments
Want to join the conversation?
Loading comments...