This Bitcoin Price Pattern Has Emerged 3 Times Since Late 2023, Triggering Corrections
Why It Matters
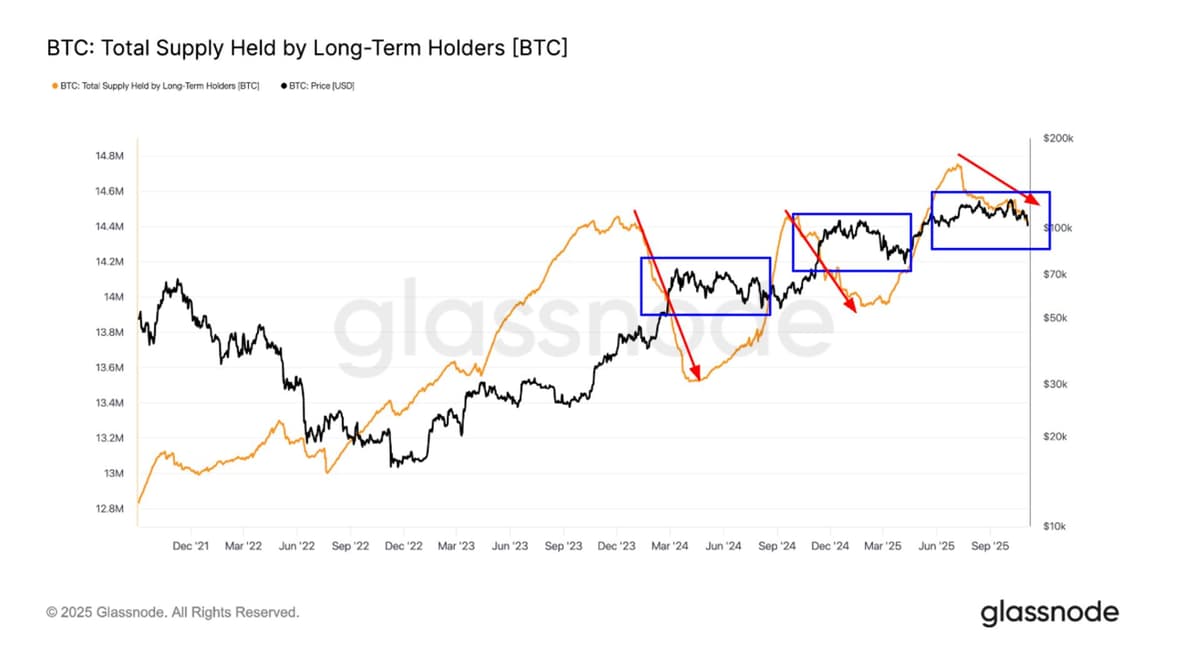
The erosion of long‑term holder supply and the breach of key 365‑day moving averages signal heightened downside risk, potentially triggering another correction that could reshape sentiment and liquidity in the broader cryptocurrency market.
Summary
Bitcoin slipped below $100,000 on Tuesday, touching $98,951 and testing the 365‑day simple moving average ($102,055) and exponential moving average ($99,924) that have acted as support in the current bull cycle. The dip marks the third notable profit‑taking wave by long‑term holders—investors with positions of at least 155 days—who have reduced their on‑chain supply from 14.7 million BTC in July to about 14.4 million BTC. Historically, each of these long‑term‑holder sell‑offs has preceded corrections of 10% or more, as seen in late 2023, August 2024 and April 2024. The pattern suggests that the market may face renewed downward pressure if the moving‑average supports are breached again.
This Bitcoin Price Pattern Has Emerged 3 Times Since Late 2023, Triggering Corrections
Comments
Want to join the conversation?
Loading comments...