This Onchain Metric Has Identified the Bitcoin Bottom Every Cycle
•February 4, 2026
0
Why It Matters
A convergence of profit and loss supply signals a likely market bottom, offering a data‑driven entry point for long‑term investors and risk managers.
Key Takeaways
- •Convergence of profit/loss supply signals market capitulation
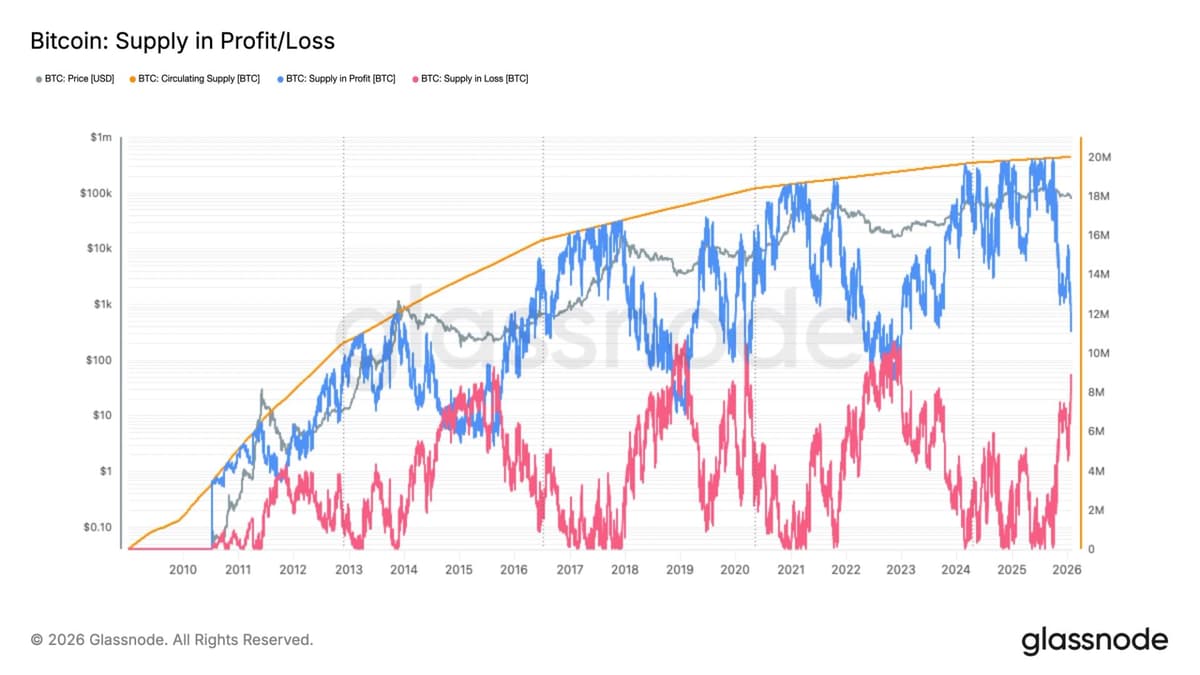
- •Glassnode shows 11.1M BTC in profit, 8.9M in loss
- •Past bottoms occurred when profit and loss supplies aligned
- •Metric offers a data‑driven entry point for long‑term investors
- •Indicator not foolproof; must combine with macro factors
Pulse Analysis
The BTC profit‑vs‑loss supply metric tracks the amount of Bitcoin held at a cost basis above the current price (in loss) versus below it (in profit). Data providers such as Glassnode aggregate wallet‑level acquisition prices to estimate how many coins sit on paper gains or deficits. When the two pools converge, it indicates that a sizable portion of the market is indifferent—neither strongly bullish nor bearish—often preceding a capitulation phase. Because the measure reflects aggregate investor sentiment rather than isolated trades, it serves as a macro‑level barometer for potential turning points.
Historical back‑testing shows the convergence signal lined up with every major Bitcoin bottom since 2015. In November 2022, profit and loss supplies met just before the price rebounded from $15,000, while similar alignments preceded recoveries in March 2020, January 2019, and the 2015 low near $200. The consistency stems from the metric’s ability to capture mass‑psychology: as losses mount, holders become more willing to sell, driving prices down until the remaining profit‑holding cohort provides a floor. Nonetheless, the indicator can produce false positives during short‑term volatility spikes, so analysts pair it with on‑chain activity, volume trends, and macroeconomic data.
With Glassnode reporting roughly 11.1 million BTC in profit against 8.9 million in loss, the gap is narrowing, suggesting a possible convergence in the coming weeks. Traders who monitor this metric can time long‑position entries or hedge strategies as the profit‑loss balance approaches parity, especially when combined with rising on‑chain demand signals such as increasing active addresses or reduced supply on exchanges. However, investors should remain cautious; external factors like regulatory news or macro‑policy shifts can disrupt historical patterns. Integrating the profit‑vs‑loss supply gauge into a broader analytical framework enhances risk management while preserving exposure to Bitcoin’s long‑term upside.
This onchain metric has identified the Bitcoin bottom every cycle
0
Comments
Want to join the conversation?
Loading comments...