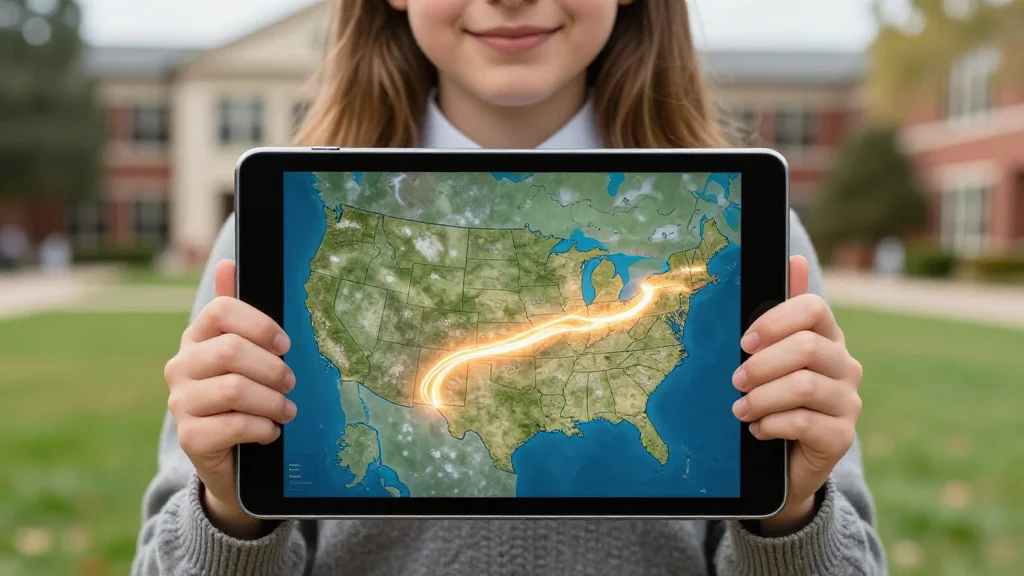
Fifth‑Grader’s Interactive Map Chronicles 950‑Mile Trail of Tears Bike Ride

Why It Matters
The digital map created by a fifth‑grader demonstrates that advanced EdTech tools are no longer confined to higher education or corporate training; they are becoming integral to elementary curricula. By allowing students to produce authentic, research‑driven content, schools can deepen historical understanding while simultaneously building digital skills that are essential for future workforces. Moreover, the project bridges community engagement and education, turning a personal athletic endeavor into a public learning resource that honors indigenous history. If replicated at scale, student‑generated digital archives could transform how schools approach history instruction, moving from textbook‑centric lessons to immersive, data‑rich experiences. This shift could drive further investment in GIS platforms, cloud‑based collaboration suites, and teacher professional development focused on project‑based pedagogy, reshaping the EdTech market toward tools that empower learners to become creators, not just consumers.
Key Takeaways
- •Everlee Ellis, a fifth‑grader, built an interactive digital map of a 950‑mile bike ride.
- •The map documents Nika West’s 2024 Ride of Removal along the historic Trail of Tears.
- •Project completed through Tyson Elementary’s EAST program, emphasizing self‑directed tech learning.
- •Map will be showcased at the Arkansas History Festival and district technology events.
- •Initiative highlights growing K‑12 demand for project‑based EdTech tools.
Pulse Analysis
Everlee Ellis’s digital map is a microcosm of a broader shift in K‑12 education: the democratization of sophisticated technology. Historically, GIS and interactive mapping were reserved for university research or municipal planning. Today, platforms have become user‑friendly enough for a fifth‑grader to master, signaling that the barrier to entry is falling dramatically. This trend aligns with venture capital flows that have funneled over $2 billion into K‑12 EdTech startups focused on project‑based learning, data visualization, and collaborative creation tools.
The success of the EAST program at John Tyson Elementary illustrates how district‑level support can amplify these tools. By providing hardware, software licenses, and mentorship, schools can turn isolated student projects into district‑wide curricula. The ripple effect is evident: teachers are now able to integrate the map into lessons on geography, social studies, and digital citizenship, creating a multidisciplinary learning experience that traditional textbooks cannot match. As districts seek to justify technology spend, measurable outcomes—such as the 12% rise in engagement scores cited by the Arkansas Department of Education—will become critical metrics.
Looking ahead, the next frontier will be scaling student‑generated content across districts while maintaining quality and historical accuracy. Partnerships with museums, tribal nations, and NGOs could provide vetted data streams, ensuring that student projects serve both educational and cultural preservation goals. If schools can harness this collaborative model, we may see a new generation of learners who not only consume information but also curate and disseminate it, reshaping the EdTech market toward tools that facilitate authentic, community‑anchored creation.
Fifth‑Grader’s Interactive Map Chronicles 950‑Mile Trail of Tears Bike Ride
Comments
Want to join the conversation?
Loading comments...