Where Agency Revenue Is Heading: Fewer Big Retainers, More Mid-Market Retainers, and Longer Engagements
Why It Matters
Longer, lower‑budget retainers signal a maturing market that favors steady cash flow over large project spikes, reshaping agency growth strategies. Operational shifts toward dedicated managers and utilization tracking reflect scaling pressures and profitability focus.
Where Agency Revenue Is Heading: Fewer Big Retainers, More Mid-Market Retainers, and Longer Engagements
State of Digital Agencies 2025 – Client Services & Operations Results
Recently, Rand and I released the results of the State of Digital Agencies survey for 2025. Our goal of this annual survey is simple – get a temperate check on the digital agency world and give folks a benchmark for how they’re performing compared to their peers.
If you missed the launch post, you can catch up on it here:
Note: Some charts and takeaways below overlap with the launch post. They are included here for completeness and to keep all client‑services and operations results in one place.
Below, we focus on the client services and operations section of the survey.
Generally, sentiment on this topic appears positive compared with 2024. Agencies report modest head‑count growth and plans to hire more over the next 12 months. Agencies also report longer client relationships—a positive sign.
At the end of the post you’ll find demographics of the survey respondents.
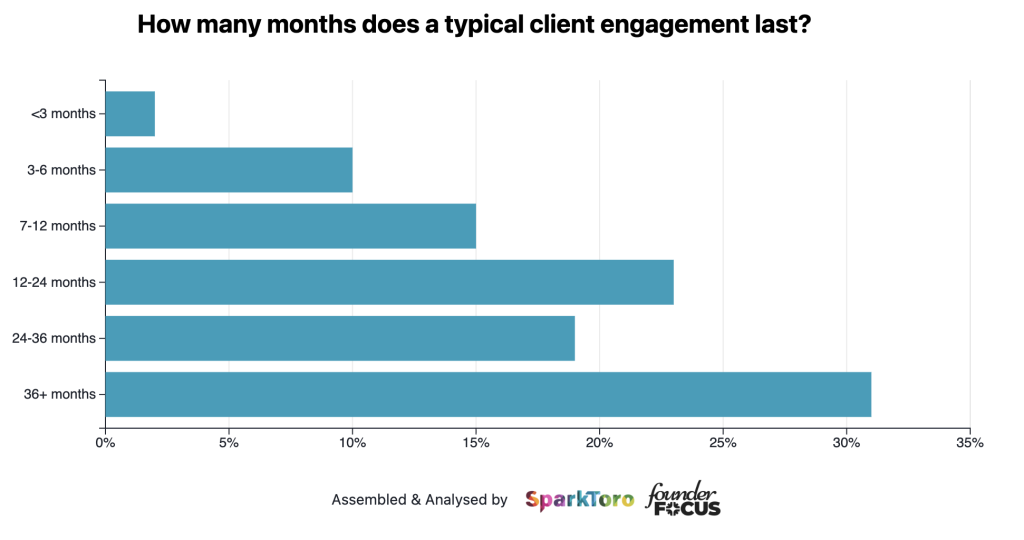
Agencies are retaining clients for longer and tend to work with clients for at least two years
We asked respondents how long they typically work with clients. About a third (31 %) said they work with clients for over three years, while a fifth (19 %) said 2‑3 years.
Image 1 – Chart: Duration of typical client engagements (less than 3 months to 36+ months).
This appears to have improved compared with a year ago, with more agencies reporting 36+ months as a typical engagement length.
Image 2 – Bar graph: Length of typical client engagements, 2024 vs 2025.
A decent chunk (25 %) still work with clients for less than 12 months.
Dedicated account managers are most common at larger agencies
An ongoing question for agency owners is whether to have dedicated account managers. The overall results were almost split, but tilted toward not having account managers:
Image 3 – Pie chart: 56 % yes, 44 % no to “Do you have staff who are 100 % dedicated to Account Management/Client Services?”
When segmented by agency size, larger agencies lean heavily toward having dedicated account managers:
Image 4 – Horizontal bar chart: Dedicated account managers by agency size.
Agencies with more than 50 people consistently report having dedicated account managers. This aligns with the need for additional management layers as agencies grow and often become multi‑service.
To time‑track or not to time‑track – that is the question
Another perennial question is whether to enforce time tracking / timesheets. Agencies are fairly evenly split:
Image 5 – Pie chart: 57 % yes, 43 % no to “Does your team record timesheets for their client work?”
There is a slight tilt toward using timesheets (57 %). Segmenting by size shows a clear trend: larger teams are more likely to use timesheets.
Image 6 – Chart: Timesheet usage by team size.
For agencies that do use timesheets, the majority (65 %) also set utilization targets:
Image 7 – Pie chart: 65 % yes, 35 % no to “Do you have utilization/billable time targets for your team?”
Image 8 – Bar graph: Utilization targets by team size.
Utilization targets
The most popular utilization targets for a typical mid‑level team member are:
-
70‑79 % – 39 % of agencies
-
80‑89 % – 35 % of agencies
Larger agencies tend to set higher utilization targets.
Image 9 – Bar graph: Average % of a mid‑level team member’s time expected to be billable.
Image 10 – Bar graph: Utilization targets by agency size.
The vast majority of agencies prefer to work on a retainer model
85 % of agencies prefer a retainer basis, up from 81 % in 2024.
Image 11 – Pie chart: 85 % retainer, 15 % one‑off project.
This holds across most agency sizes, though solo consultants and freelancers are more likely to work on a one‑off basis.
Image 12 – Bar graph: Retainer vs. one‑off project by agency size.
Agency monthly retainer budgets are typically $10 k or less
-
86 % of agencies report an average monthly retainer ≤ $10 k.
-
49 %: $1 k‑$5 k
-
31 %: $5 k‑$10 k
-
Image 13 – Typical monthly retainer budget distribution.
The next largest segment is $25 k‑$50 k (10 %). As agencies grow toward 50 people, the $5 k‑$10 k range becomes more common.
Image 14 – Retainer budgets by agency size.
Geographically, $25 k+ retainers appear only in North America and Europe, while smaller retainers dominate in Africa, Asia, and Central/South America.
Image 15 – Retainer budgets by region.
Over half of agencies charge $1 k‑$10 k for one‑off projects
- 54 % of agencies charge between $1 k‑$10 k for a one‑off project.
Image 16 – Typical one‑off project budget distribution.
Recall that only 15 % of agencies primarily work on a project basis.
Agencies are working with freelancers more often than a year ago
Image 17 – Bar graph: Change in number of freelancers/contractors used over the last 12 months.
-
About 50 % say the number of freelancers they work with has stayed the same.
-
Roughly 30 % say they have increased the number of freelancers they work with.
Headcount trends
-
55 % of agencies report headcount stayed roughly the same (+/‑5 %).
-
21 % grew by 5‑30 %.
-
16 % shrank by 5‑30 %.
Image 18 – Headcount change over the last 12 months.
Compared with 2024, growth has risen slightly (2024: 22 % grew; 2025: 26 % grew).
Image 19 – Headcount change comparison 2024 vs 2025.
Outlook for the next 12 months
-
47 % expect headcount to remain stable.
-
40 % expect to hire (some or many).
-
6 % expect a shrink via natural churn.
-
5 % anticipate layoffs/redundancies.
-
4 % expect a large hiring wave.
Image 20 – Staff headcount outlook.
Client meetings are increasingly virtual
-
80 % of agencies run client meetings remotely via video (up from 77 % in 2024).
-
10 % host meetings at the client’s office.
-
8 % host at the agency’s office.
-
3 % use rented meeting space or a coffee shop/restaurant.
Image 21 – Typical locations for client meetings.
Remote meetings are now the norm, raising questions about maintaining strong client relationships without frequent face‑to‑face interaction.
Who took the survey?
Image 22 – Demographics: services offered, agency age, size, and primary geography.
The survey includes agencies of varied sizes, geographies, and service offerings, with a concentration in small‑to‑medium (1‑50 person) agencies, North America & Europe, $100 k‑$5 M revenue, and specialties such as SEO, SEM, Content, and Analytics. Further sections break out responses by specific slices to illustrate key differentiators and patterns.
Comments
Want to join the conversation?
Loading comments...