Commodities Blogs and Articles
  • All Technology
  • AI
  • Autonomy
  • B2B Growth
  • Big Data
  • BioTech
  • ClimateTech
  • Consumer Tech
  • Crypto
  • Cybersecurity
  • DevOps
  • Digital Marketing
  • Ecommerce
  • EdTech
  • Enterprise
  • FinTech
  • GovTech
  • Hardware
  • HealthTech
  • HRTech
  • LegalTech
  • Nanotech
  • PropTech
  • Quantum
  • Robotics
  • SaaS
  • SpaceTech
AllNewsDealsSocialBlogsVideosPodcastsDigests

Commodities Pulse

EMAIL DIGESTS

Daily

Every morning

Weekly

Sunday recap

NewsDealsSocialBlogsVideosPodcasts
CommoditiesBlogsUS Grain Storage Capacity Growth Has Stopped
US Grain Storage Capacity Growth Has Stopped
CommoditiesGlobal Economy

US Grain Storage Capacity Growth Has Stopped

•February 9, 2026
0
Farmdoc daily
Farmdoc daily•Feb 9, 2026

Why It Matters

Stagnant storage capacity threatens grain supply‑chain efficiency and could widen price gaps between producers and end‑users, prompting urgent investment decisions.

Key Takeaways

  • •Storage capacity growth halted since 2020 despite rising production
  • •2025 on‑farm utilization reached 80%, near historic highs
  • •Surplus capacity shrank to 5% of total, down from 15%
  • •Off‑farm storage growth lagged, shifting burden to farmers
  • •Investment uncertainty driven by construction costs and low returns

Pulse Analysis

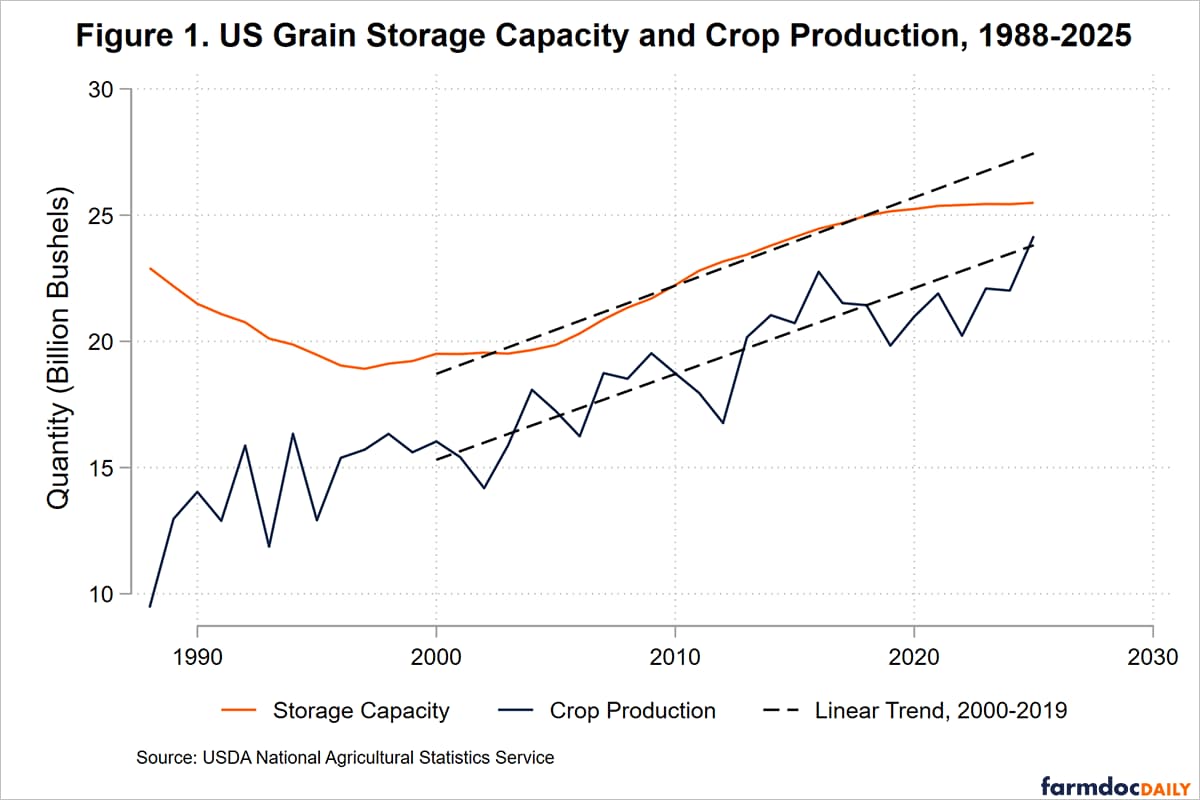
Grain storage is the linchpin of the United States’ agricultural logistics, allowing producers to capture optimal market prices and smoothing seasonal supply fluctuations. From 2000 to 2019, capacity kept pace with production, expanding by an average of 349 million bushels annually. That alignment vanished after 2020, leaving the nation with roughly 25 billion bushels of storage while crop output continued to climb, especially in corn. The resulting squeeze has pushed overall surplus capacity to a five‑year low, setting the stage for systemic stress.

The most visible symptom of this strain is the surge in on‑farm storage utilization. By the end of the 2025 harvest, farmers were using 80 % of their on‑farm bins, compared with 65 % off‑farm, reversing a decades‑long trend where intermediaries handled the bulk of post‑harvest storage. Regional analysis shows the Western Corn Belt and Northern Great Plains relying heavily on on‑farm facilities, increasing exposure to local bottlenecks and transport constraints such as low Mississippi River water levels. Higher utilization amplifies basis differentials, potentially inflating farm‑gate prices while compressing margins for downstream processors.

Looking ahead, the storage gap hinges on capital allocation decisions. Rising construction costs, higher interest rates, and uncertain revenue streams make new silos a risky proposition, especially when returns are modest under normal market conditions but spike only during shocks. Stakeholders may need to explore public‑private partnerships, tax incentives, or innovative financing models to revive capacity growth. Meanwhile, short‑term mitigations—such as temporary bagging, ground piles, or improved inventory rotation—can alleviate pressure, but a sustainable solution will require coordinated investment to keep the U.S. grain supply chain resilient and competitive.

US Grain Storage Capacity Growth Has Stopped

Grain storage infrastructure including bins, elevators, bunkers, and sheds, allows farmers, grain merchants, and others to take advantage of price differences across time, storing grain when it is relatively cheap and bringing it to market when it is more valuable. Storage also facilitates grain aggregation and movement to end‑users. Thus, storage infrastructure is critical to the effective operation of US grain supply chains and the efficiency of US grain markets. Robust grain storage infrastructure allows farmers to receive the highest possible price for their crops, conditional on demand.

The US generally has sufficient grain storage infrastructure, but there are concerning changes in recent storage capacity data. For about twenty years, from 2000 to 2019, grain storage capacity grew in lock step with increases in US grain production. This parallel growth implied capacity was ‘right sized’ for existing grain supply chains. Since 2020, capacity growth has disappeared. While crop production continues to rise, storage capacity both on farm and off farm has remained roughly constant. This change holds across all major grain‑growing regions.

Less storage capacity relative to crop production is concerning if it creates bottlenecks in the grain handling and transportation system that raise costs and generate significant differences in price between producer and end‑user. In transportation, for example, shipping constraints on the Mississippi River waterway due to low water levels have periodically led to large swings in inland crop prices relative to prices at export terminals (Flores and Janzen, 2023). This year’s large US corn crop has led to record‑high US storage capacity utilization, particularly in on‑farm storage. Recently released data showed 80 % of on‑farm storage capacity was used by major crops as of December 1, 2025. Stagnant capacity growth raises at least two unanswered questions for the US grain industry from the farmer forward through the supply chain:

  1. How much capacity utilization is too much before capacity constraints disrupt supply chains and affect market prices?

  2. Who will invest in new storage capacity if increases in crop production are expected to continue?

Capacity Growth Stopped

An earlier farmdoc daily article (Janzen and Swearingen, 2020) described changes in US grain storage capacity over time. It showed US grain storage capacity as reported by USDA’s National Agricultural Statistics Service grew by an average of 349 million bushels per year between 2000 and 2019 (Figure 1). This growth followed a period of rationalization in the 1990s where storage capacity shrank. By 2019, total US grain storage capacity was just over 25 billion bushels.

US grain production growth was remarkably similar to storage capacity growth over this earlier period. Total production of crops that can plausibly use grain storage infrastructure (barley, canola, chickpeas, corn, flaxseed, lentils, mustard, oats, peas, rye, safflower, sorghum, soybeans, sunflower and wheat) was typically 2.5–5 billion bushels less than total storage capacity. Average annual production growth was about 340 million bushels per year, mirroring the storage‑capacity trend shown in Figure 1.

After 2019, these parallel trends have diverged. Grain storage capacity growth has been negligible, increasing only 337 million bushels in six years—less than a single average year previously. Had capacity growth continued its linear trend, the US would now have 27.5 billion bushels of grain storage capacity. One might argue that the end of growth was a prescient response to a slowdown in production growth, as national grain production was below trend every year between 2019 and 2024. However, the 2025 US crop was large, driven by record corn yields and historically elevated corn acreage (Franken and Janzen, 2025), and crop production is closer to total capacity this year than any since 1988. Surplus aggregate storage capacity (capacity in excess of production) was just 5 % in 2025, well below the average level of 15 % observed since 2000.

It is hard to assess how restrictive the grain storage capacity constraint is in the US. First, not all production is harvested at once, so the same facilities may handle multiple bushels per year, especially where early‑harvested crops like wheat are produced alongside late‑harvested crops like corn. Farmers and grain merchants can also temporarily exceed storage capacity through alternative methods such as bags and ground piles. However, the location of grain storage infrastructure is fixed in the short run and may not be near production, transportation, or end‑use locations. Depending on the origin and destination of US crop output, local capacity bottlenecks may be more or less likely.

Image 1: Line chart showing US grain storage capacity and crop production from 1988 to 2025 measured in billion bushels.

The location and amount of grain storage capacity varies across regions, especially the share of storage on farms. Figure 2 shows on‑farm and off‑farm storage capacity for four broad regions that comprise a large share of US grain production. There is proportionally more on‑farm storage capacity in the Western Corn Belt and Northern Great Plains—regions generally farther from end‑users with relatively weaker cash‑commodity prices. During the storage‑capacity growth period of 2000‑2019, off‑farm capacity grew more rapidly than on‑farm capacity, suggesting a growing role for intermediaries in the grain handling and transportation system. Since 2020, growth in capacity has halted at all locations. Both farmers and grain handlers are limiting investment in new capacity. What is clear from Figures 1 and 2 is that storage‑capacity constraints are now closer to becoming a real constraint than at any time in recent memory.

Image 2: Four‑panel chart displaying US grain storage capacity by region from 1988 to 2025 in billion bushels, comparing off‑farm (orange solid line) and on‑farm (gray dashed line) storage.

Capacity Utilization Has Increased

To examine how US grain storage capacity is used, I calculate a measure of storage‑capacity utilization based on quarterly grain‑inventory data from USDA NASS. Capacity utilization is grain inventory in each quarter as a percentage of annually updated capacity. Inventories here include only major grains and oilseeds—barley, corn, oats, sorghum, soybeans, and wheat—for which stocks data are reported in all quarters. These commodities account for the lion’s share of total inventories.

Much of the variation in crop inventory is seasonal. Inventories peak immediately after harvest, especially on‑farm, and are moved off‑farm and drawn down through the marketing year as commodities move to end‑users. Changes in capacity utilization across years are mainly driven by changes in commodity supply. High‑production years feature the largest inventories and higher capacity utilization.

Image 3: Four‑panel chart showing quarterly average US grain storage capacity utilization across four time periods from 1988 to 2025. Each panel displays seasonal patterns from December through September with off‑farm (orange circles) and on‑farm (gray squares) utilization percentages.

To summarize long‑run changes in capacity utilization (as distinct from the short‑run drivers discussed above), Figure 3 plots quarterly average utilization for four sub‑periods since the 1988/89 marketing year. These periods correspond with:

  • the initial consolidation before 2006,

  • the ethanol‑boom period of 2006‑2014 (higher prices and tighter supply),

  • the low‑price environment of 2014‑2020, and

  • the most recent years since 2020.

Two points are evident from Figure 3. First, utilization has grown over time. Average utilization at the end of the US grain harvest (December 1) rose from about 60 % before 2006 to roughly 70 % in the 2020‑2025 period. The drawdown in utilization has also increased: average on‑farm storage use at the September 1 low declined from 16 % to 10 % over the same span, clearing additional space for the incoming harvest.

Second, farmers are taking on more of the initial post‑harvest storage task. On‑farm utilization rates were typically similar to off‑farm use prior to 2020. Since then, average on‑farm utilization is 69 % versus 61 % off‑farm. These averages do not include the most recent data point for December 1, 2025, where on‑farm capacity was 80 % compared to 65 % off‑farm.

Discussion

US grain storage capacity grew in parallel with production from 2000‑2019 at roughly 350 million bushels per year but has stagnated since 2020 across all regions and facility types. This stagnation, combined with continued production growth, has led to record‑high utilization rates, particularly in on‑farm storage. The 2025 crop brought these tensions to a head, with December 1 on‑farm utilization reaching 80 % of national on‑farm storage capacity.

What is less clear is why investment in grain storage capacity dropped. Possible relevant factors include increased construction costs and higher interest rates in the post‑2020, post‑COVID economy; concerns about future production growth; and the irregular, unpredictable nature of grain‑storage demand. It may be difficult to justify investment when the timing and magnitude of benefits are uncertain. Storage capacity may earn low returns in typical market conditions but become much more valuable after specific supply or demand shocks. It takes time and effort for farmers and other firms to consistently generate revenue from storage capacity.

In the aggregate, it is difficult to determine if current US storage capacity is sufficient for efficient operation along grain supply chains. At what level of utilization do bottlenecks form and capacity constraints begin to materially affect basis relationships, price volatility, and farmer marketing flexibility? The grain industry, from the farmer outward, will need to consider these questions as it addresses the continually shifting geography of global grain production and consumption in the years ahead.

Read Original Article
0

Comments

Want to join the conversation?

Loading comments...