
Recent Posts
Social•Feb 19, 2026
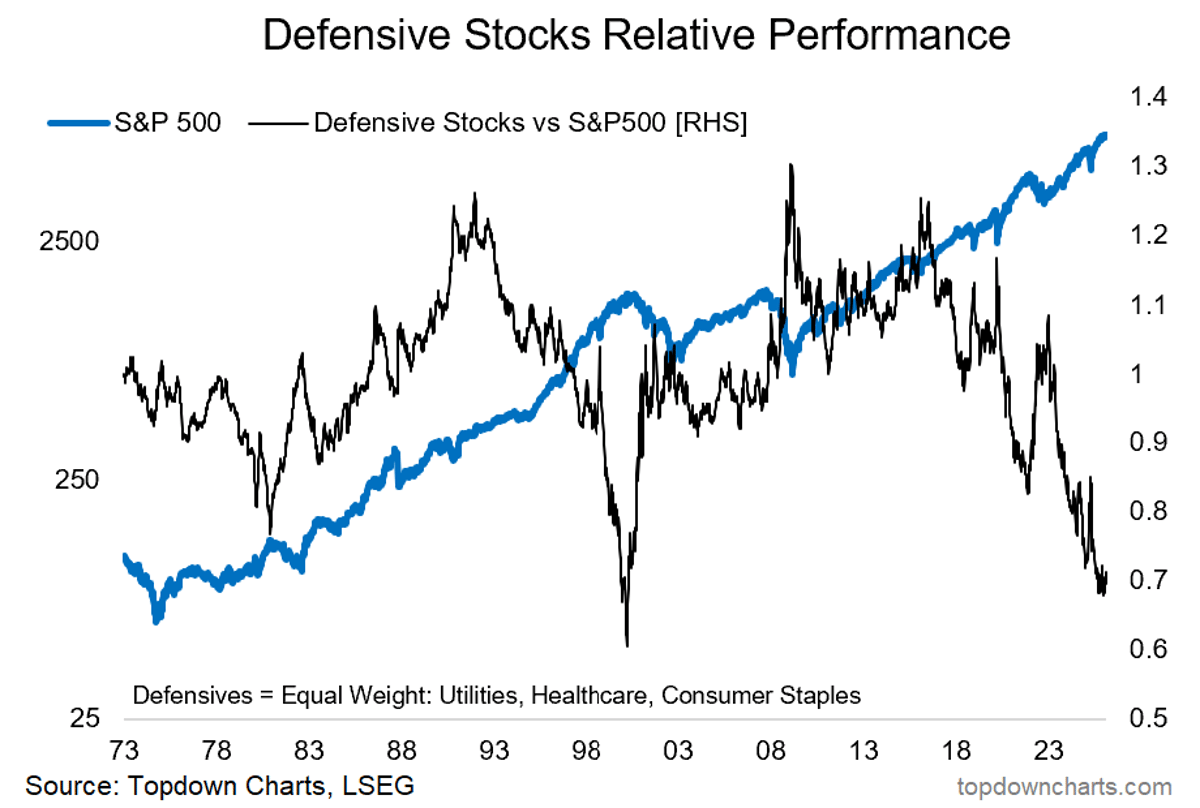
Defensives Hit Dot‑Com Lows, Poised for Rally
Chart of the Week - Defensives With tech in trouble (+a number of macro risks lurking on the horizon), defensives are starting to look interesting… Defensives (i.e. an equal-weighted basket of: Utilities, Healthcare, Consumer Staples) are turning up vs the S&P500 —after going through what has been a major relative bear market. But in particular, the following conditions make for a contrarian bullish (relative) setup for Defensives: Defensives’ relative value indicator reached similar levels to that seen at the peak of the dot com bubble (Defensives are extreme cheap vs the index). Investor allocations to defensives are ticking up from record lows. The market cap weight of defensives reached an all-time low late last year. The relative price (black line in the chart below) has seen an extended and extreme period of underperformance. And on the flipside, US (tech) stocks have likewise seen a number of extreme readings on sentiment, valuations, and allocations in the opposite direction (i.e. overall stock market downside risk is higher than we’ve seen since 2000 due to the key growth engine of tech stocks being overheated and looking somewhat burnt out lately). Interestingly, this bullish outlook for defensive stocks is actually bearish for the stockmarket as a whole… To be clear, when I say bullish outlook for defensives, I mean in relative terms — i.e. you expect defensive stocks to fall less or at best hold ground while the rest of the market falls more. In this sense, defensives are interesting to keep tabs on both as a source of information on the market cycle (they fare relatively well in a downturn and lag behind in an upturn), but also as a sort of alternative hedge or portfolio risk dampener. So seeing the defensives’ relative performance line ticking up from extreme lows (and the contrarian bullish setup for defensives I just outlined) tells us we need to pay closer attention to risk management and smart diversification right now. Key point: Defensives are looking good (that’s bad).
By Callum Thomas
Social•Feb 16, 2026
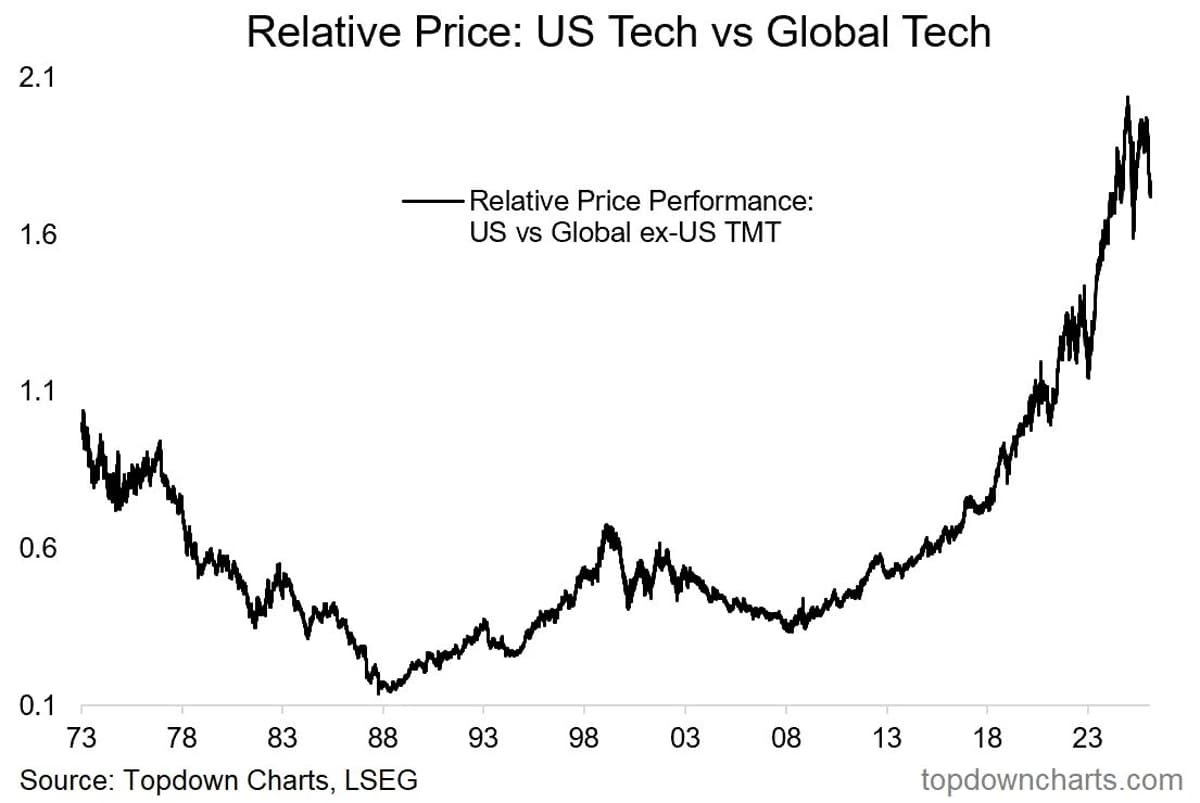
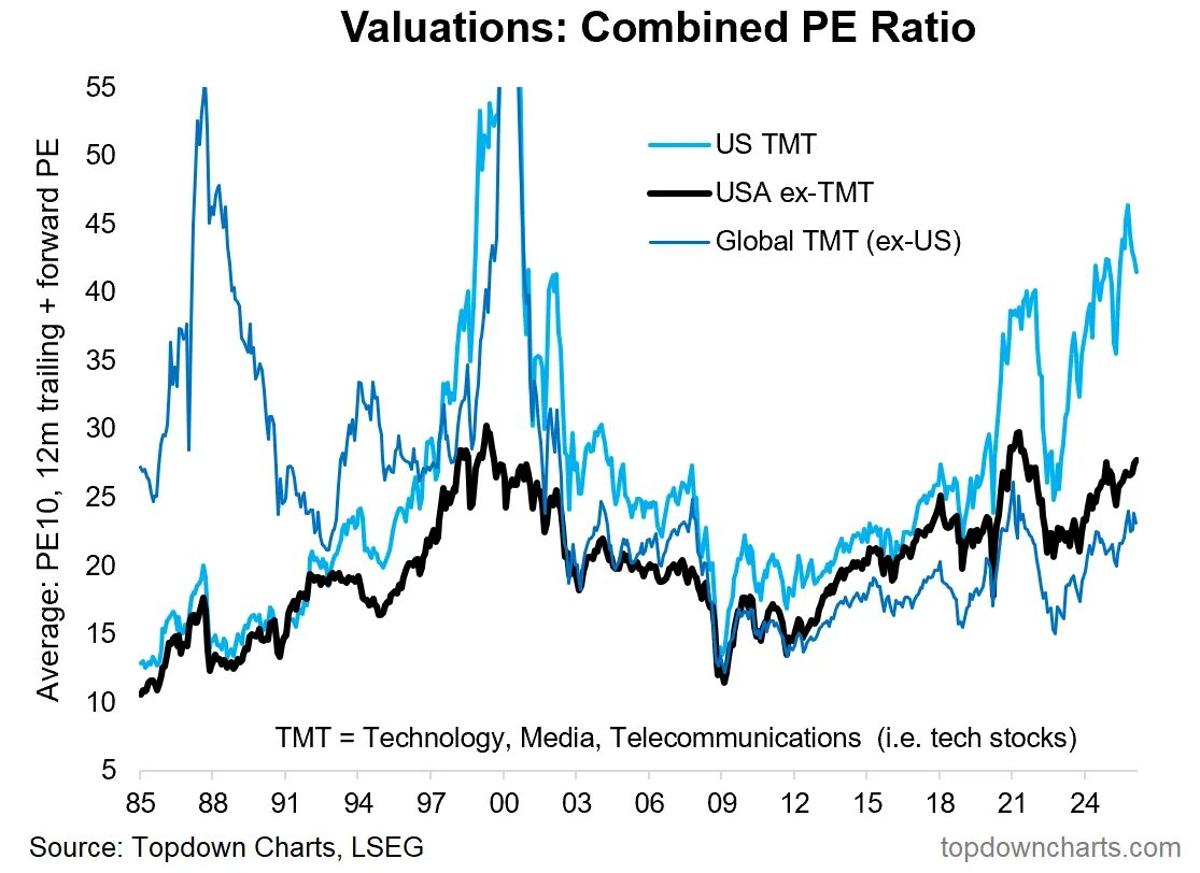
US Tech Dominance Fades as Global Rotation Shifts
This chart captures the 2 most important themes in the Stockmarket right now. 1. Global vs US rotation 2. Top in tech stocks For the past 17-years US Tech stocks have dominated global markets, but that is starting to change... https://t.co/6DhUXusR6C
By Callum Thomas

Social•Feb 16, 2026
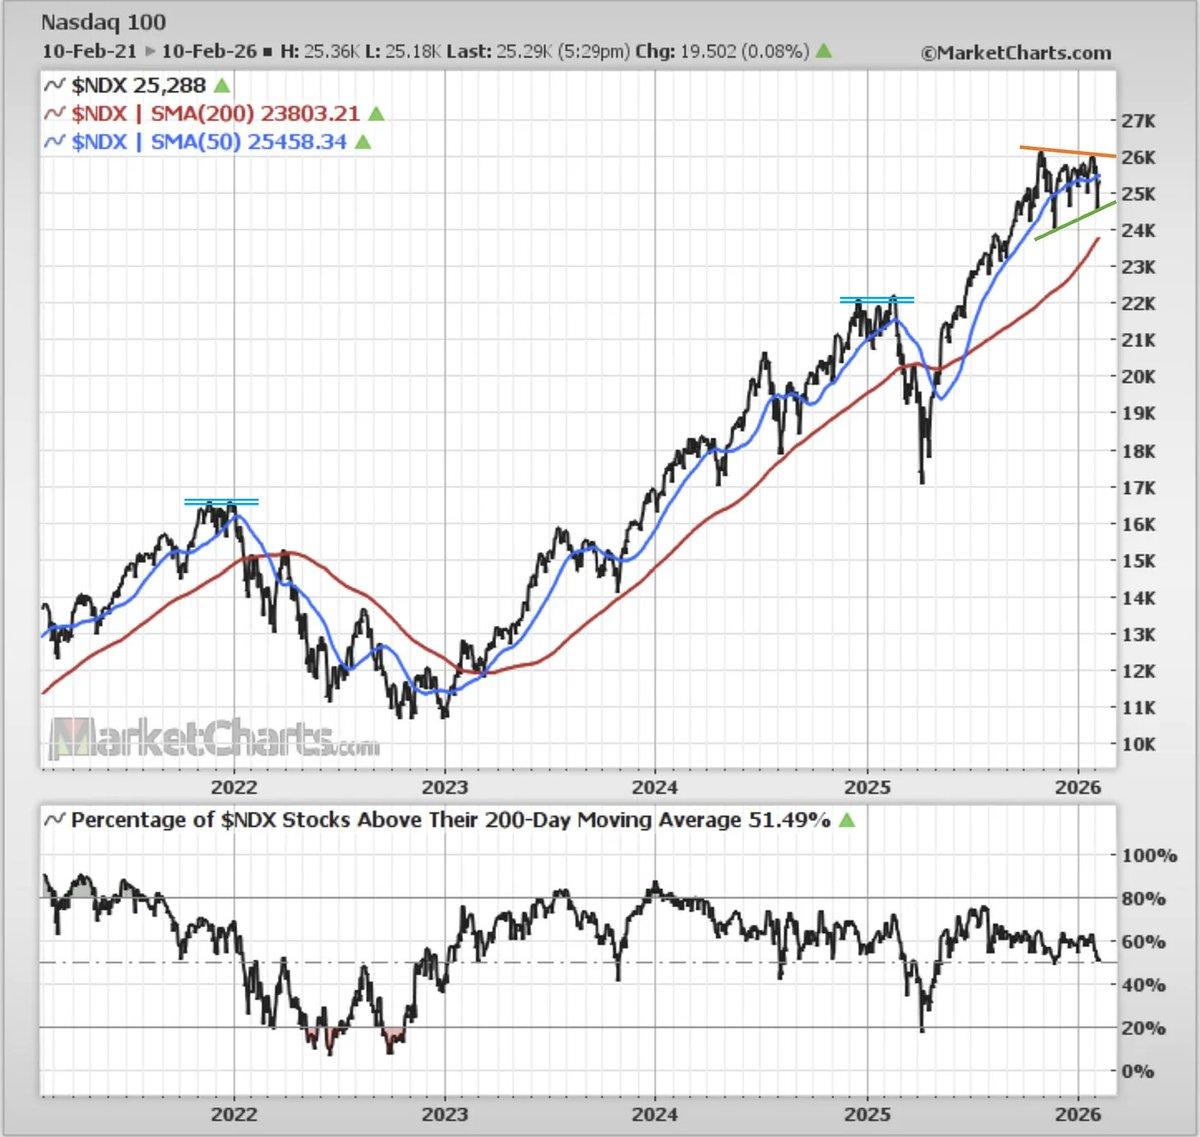
Weekly S&P 500 Chart Review Highlights Key Trends
ICYMI: Weekly S&P500 #ChartStorm blog post https://t.co/B5a4uBC2Q4 Thanks + follow reco to chart sources @MarketCharts @topdowncharts @dailychartbook @MauiBoyMacro @KobeissiLetter @StealthQE4 @HayekAndKeynes
By Callum Thomas
Social•Feb 15, 2026
Tech Pressure Rises, Defensives Gain Amid Market Crossroads
Learnings and conclusions from this week’s charts: 1. Tech stocks (particularly software) remain under pressure. 2. Investor exposure to tech is at historically elevated levels. 3. Surging tech capex is coming at the cost of buybacks. 4. Private equity stocks are also coming under...
By Callum Thomas
Social•Feb 14, 2026
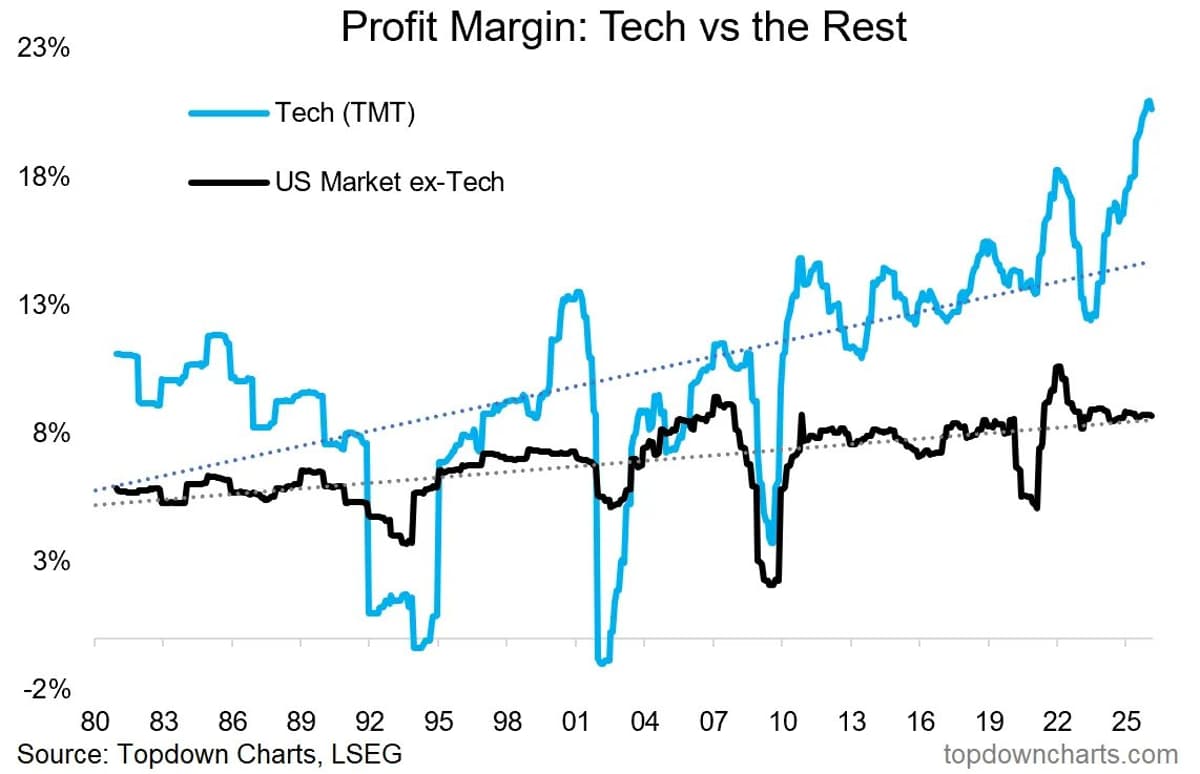
Tech Stocks' Valuations Soar, Yet Margins Remain Stretched
Biggest strength for Tech Stocks. and their biggest weakness? (stretched valuations are underpinned by stretched profit margins) https://t.co/JyYGvhtRlC
By Callum Thomas
Social•Feb 12, 2026
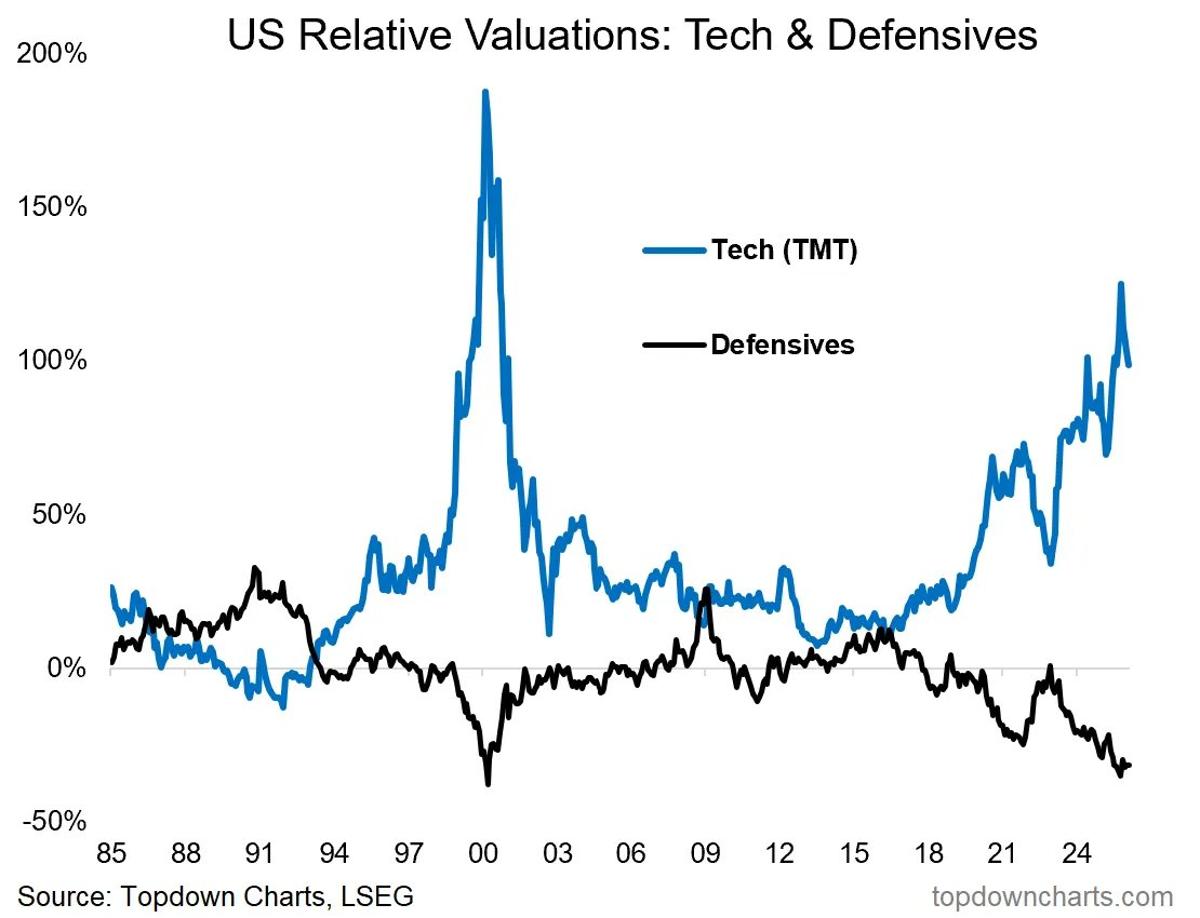
Tech Stocks Peaked; Valuations Stretched, Technical Outlook Shaky
The big issue is Tech Stocks have peaked, are on technically shaky ground ---AND this is coming from a starting point of stretched Valuations. https://t.co/3QKdtdJm7n
By Callum Thomas
Social•Feb 11, 2026
Tech Peaks; Next Moves Mapped in 10 Charts
Off-Topic ChartStorm - Tech Stocks Tech has topped, what's next? Here's 10 charts outlining the situation and thoughts on the risks + opportunities: https://t.co/WKltkF9gOt https://t.co/k0pxNxZedy
By Callum Thomas
Social•Feb 10, 2026
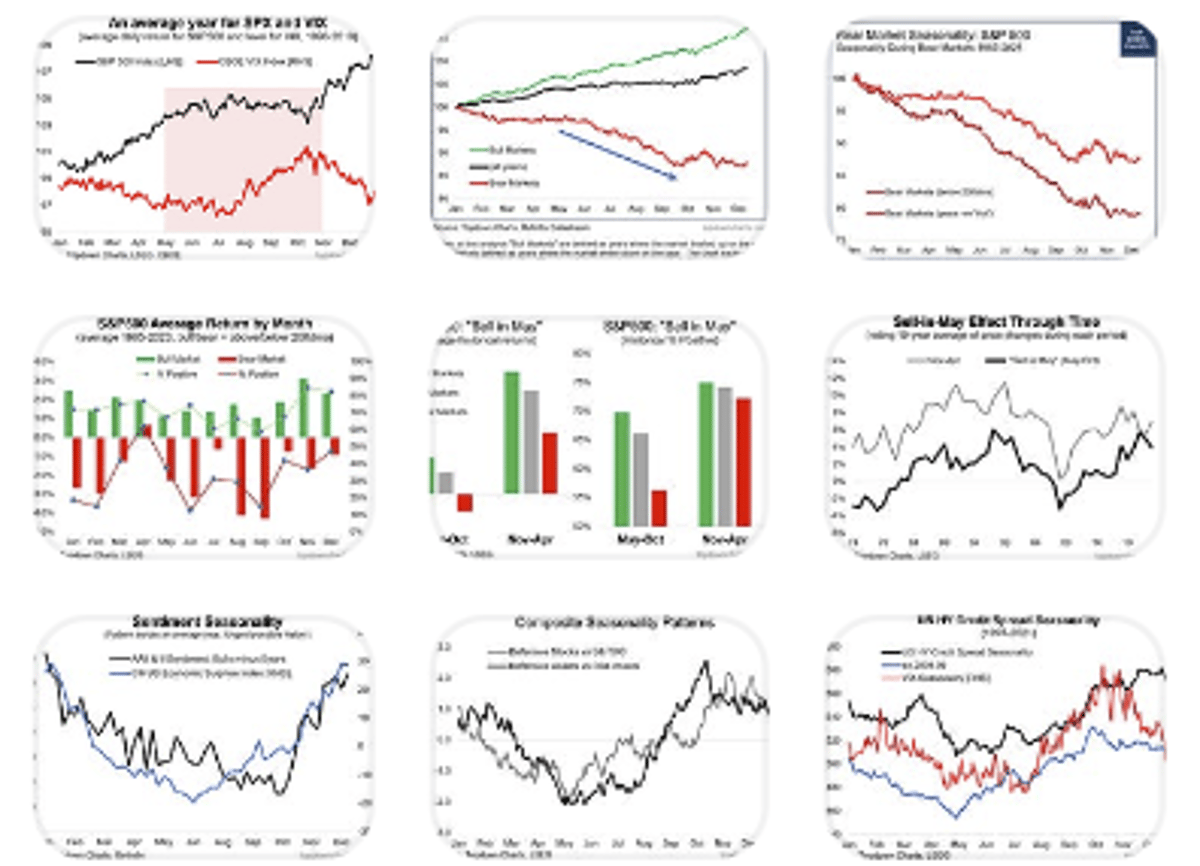
Weekly ChartStorm Reveals Hidden Stock Market Seasonality Angles
You may think you know all about stockmarket seasonality... but this special focus piece from the Weekly ChartStorm lays out a few more angles and details that you might not have considered before: https://t.co/5sf2QCC8pE https://t.co/XBuZIufwiB
By Callum Thomas

Social•Feb 9, 2026
Weekly S&P 500 ChartStorm Highlights Market Trends
ICYMI: Weekly S&P500 ChartStorm blog post https://t.co/eQY6d47hAk Thanks + follow reco to chart sources @topdowncharts @MarketCharts @MikeZaccardi @BlakeMillardCFA @WillieDelwiche @alphacharts @AugurInfinity @SnippetFinance @EricBalchunas @TuttleCapital @Todd_Sohn
By Callum Thomas