
Recent Posts
Video•Feb 20, 2026
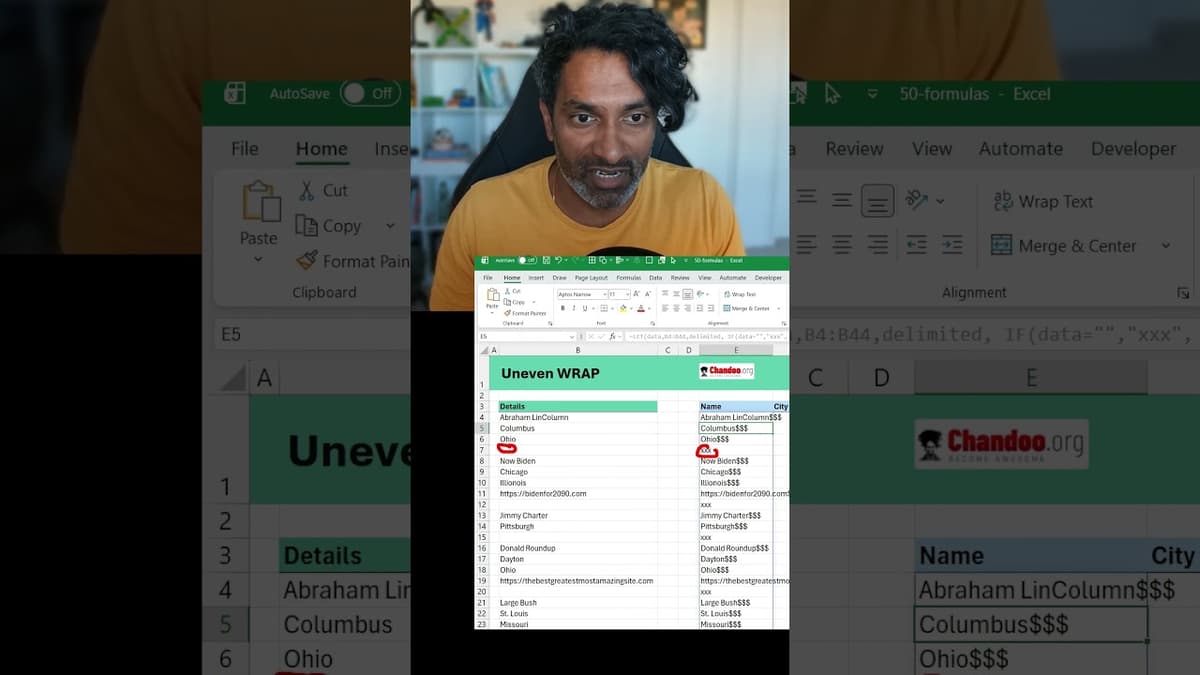
Excel Data Cleaning Trick💡for Uneven Rows of Data #EXCEL
The video demonstrates a practical Excel formula chain for turning uneven, single‑column data into a clean multi‑column table. By leveraging the LET function, the presenter creates local variables for the raw data and a custom delimiter, then substitutes empty cells with a unique placeholder ("xxx") and appends a four‑dollar‑sign token that does not appear elsewhere in the dataset. The core steps involve concatenating the modified rows into one long string, feeding that string into TEXTSPLIT, and using the dollar token as the column delimiter while the placeholder marks missing values. The author also shows how to activate TEXTSPLIT’s ignore‑empty flag and set a pad‑width of blank cells, which removes stray #N/A entries and aligns rows into a tidy table. Key moments include the line, "If data is equal to nothing, then we want to return a special variable like xxx," and the visual confirmation that the combined string, once split, yields the desired four‑ or five‑column layout without manual copy‑pasting. The demonstration underscores how a few nested functions can replace labor‑intensive data‑cleaning steps. For analysts and business users, this technique streamlines the transformation of irregular data feeds into structured tables, cutting down on manual effort, reducing errors, and accelerating downstream reporting and analysis.
By Chandoo

Video•Feb 14, 2026
Build Your First Power BI Report in One Hour (Free Masterclass + Sample Files 📂)
The livestream walks viewers through building a complete Power BI report in roughly an hour, using a fictitious "Awesome Clinic" dataset. The instructor opens a blank Power BI file, imports three pre‑packaged tables—patients, doctors, and a calendar—then demonstrates how to clean, model,...
By Chandoo

Video•Feb 5, 2026
How to ACTUALLY Use AI + PYTHON to Analyze Data (Real-Time Example)
The video demonstrates how AI tools like Google Gemini can write Python code in real time to load, merge, and analyze a hospital data set within Google Colab. The presenter walks through three escalating tasks—basic exploratory analysis, answering a specific...
By Chandoo

Video•Jan 30, 2026
Forget Complex DAX, Use This Instead in Power BI
The video demonstrates how Power BI’s new visual‑calculation feature can replace traditional, complex DAX formulas when building month‑over‑month change visuals. Starting from a simple total‑amount measure, the author adds a ‘versus previous’ visual calculation, which automatically creates a field‑minus‑previous‑field expression. By editing...
By Chandoo