

20 AI Terms Explained in Plain English in 20 Minutes 🕓
The video walks viewers through twenty of the most common artificial‑intelligence terms, translating technical jargon into plain English for non‑engineers. It begins with the foundation of large language models (LLMs), explaining how they autocomplete text by predicting the next token, and expands to broader model concepts that generate images, audio, or video. Key insights include the mechanics of prompts—zero‑shot, few‑shot, system prompts, and reusable "skills"—and how tokens compose prompts. The presenter highlights practical limits such as the context window and token caps, which can cause the model to forget earlier instructions and produce hallucinations. Adjustable parameters like temperature control output randomness, while advanced techniques like retrieval‑augmented generation (RAG) and model‑context protocol (MCP) enable LLMs to pull in external data and execute tasks. Illustrative examples pepper the discussion: completing "New York is a city in ___" demonstrates zero‑shot prompting; Excel’s Copilot shows a skill‑based system prompt; a vacation‑planning chat illustrates context‑window growth; an agent that emails daily summaries exemplifies autonomous task execution. The speaker also references popular models—ChatGPT, Claude, Gemini—and how they integrate into everyday tools. Understanding these concepts equips business users to deploy LLMs responsibly, mitigate hallucinations, and leverage agents or RAG for workflow automation, ultimately turning AI from a buzzword into a productivity asset.
The Excel Trick that Saves Me Hours on MIS Reports 💡
The video demonstrates an Excel‑based workflow for answering common MIS compliance questions by merging an employee roster with a training log. The presenter shows how to link the two tables via employee ID, add helper columns, and apply COUNTIFS to...
![Live Power Query Data Cleaning Masterclass [FREE Workbook]](/cdn-cgi/image/width=1200,quality=75,format=auto,fit=cover/https://i.ytimg.com/vi/UhD3LbbimZ0/maxresdefault.jpg)
Live Power Query Data Cleaning Masterclass [FREE Workbook]
The video is a live masterclass that walks viewers through using Power Query for data cleaning, transformation, and management inside Power BI, with identical steps applicable to Excel. The presenter provides a free sample workbook—a fabricated 1,000‑employee dataset—so participants can follow...
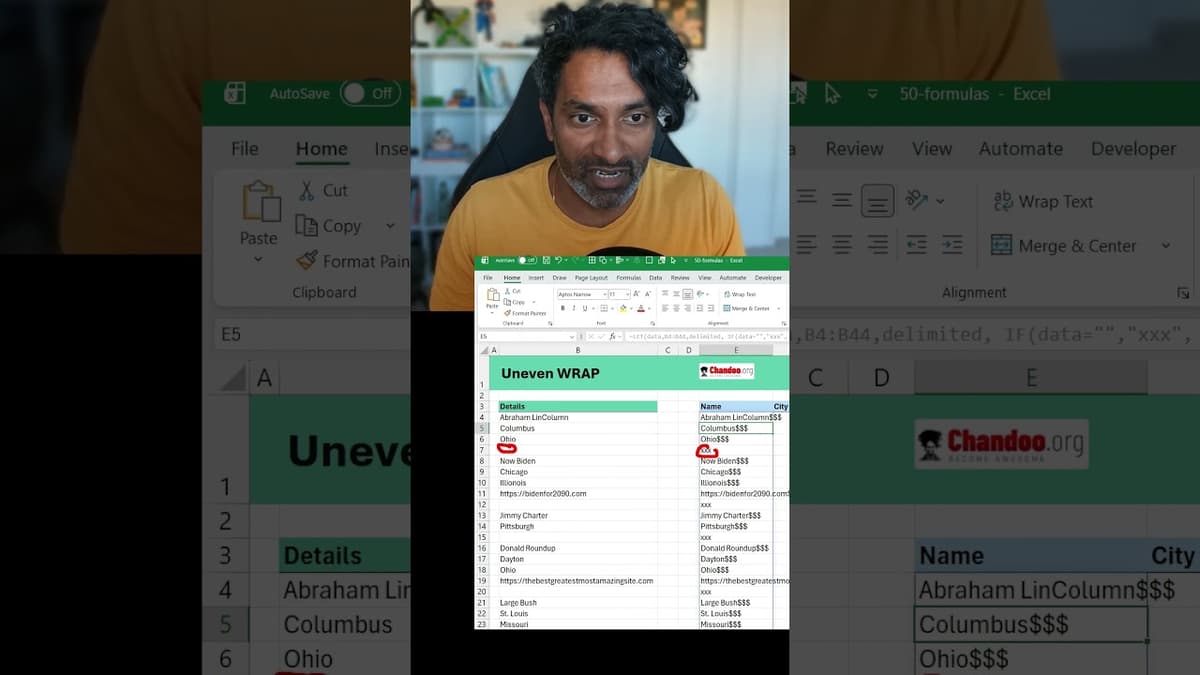
Excel Data Cleaning Trick💡for Uneven Rows of Data #EXCEL
The video demonstrates a practical Excel formula chain for turning uneven, single‑column data into a clean multi‑column table. By leveraging the LET function, the presenter creates local variables for the raw data and a custom delimiter, then substitutes empty cells...
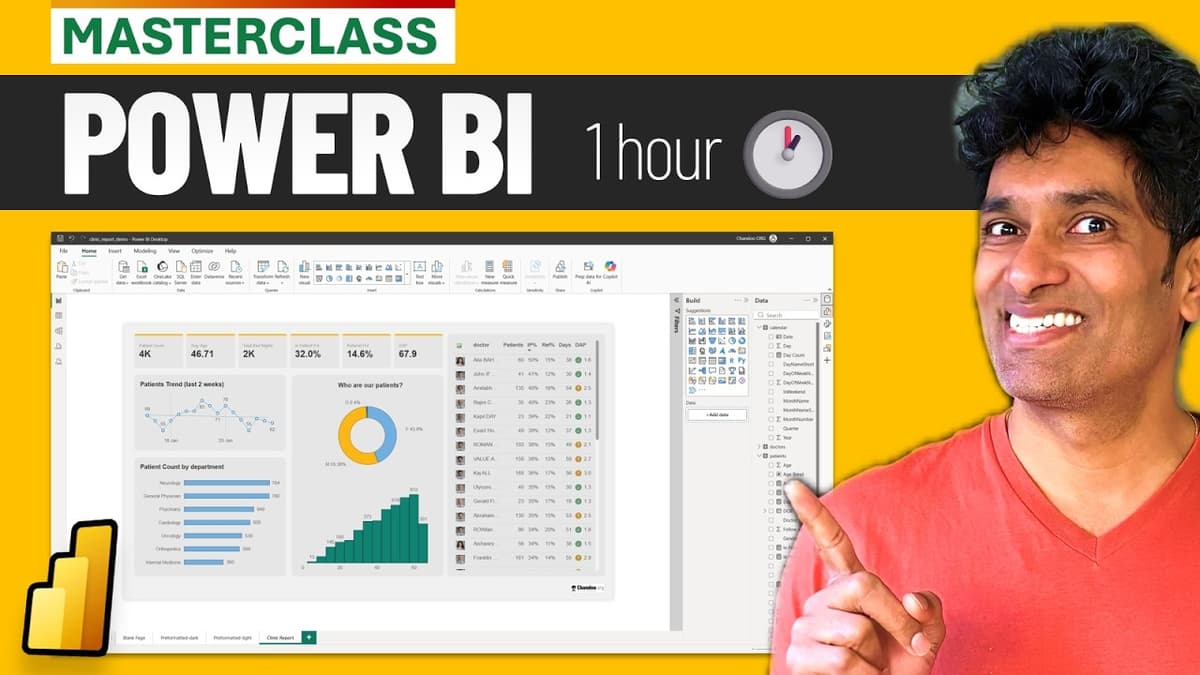
Build Your First Power BI Report in One Hour (Free Masterclass + Sample Files 📂)
The livestream walks viewers through building a complete Power BI report in roughly an hour, using a fictitious "Awesome Clinic" dataset. The instructor opens a blank Power BI file, imports three pre‑packaged tables—patients, doctors, and a calendar—then demonstrates how to clean, model,...

How to ACTUALLY Use AI + PYTHON to Analyze Data (Real-Time Example)
The video demonstrates how AI tools like Google Gemini can write Python code in real time to load, merge, and analyze a hospital data set within Google Colab. The presenter walks through three escalating tasks—basic exploratory analysis, answering a specific...
Forget Complex DAX, Use This Instead in Power BI
The video demonstrates how Power BI’s new visual‑calculation feature can replace traditional, complex DAX formulas when building month‑over‑month change visuals. Starting from a simple total‑amount measure, the author adds a ‘versus previous’ visual calculation, which automatically creates a field‑minus‑previous‑field expression. By editing...