
Karina | Python | Excel | Stats | DataScience | DataAnalytics
Creator
0 followers
Data analytics/science educator; active, high‑engagement posts on pandas/Python and big‑data‑adjacent workflows for analytics.
Recent Posts
Social•Feb 22, 2026
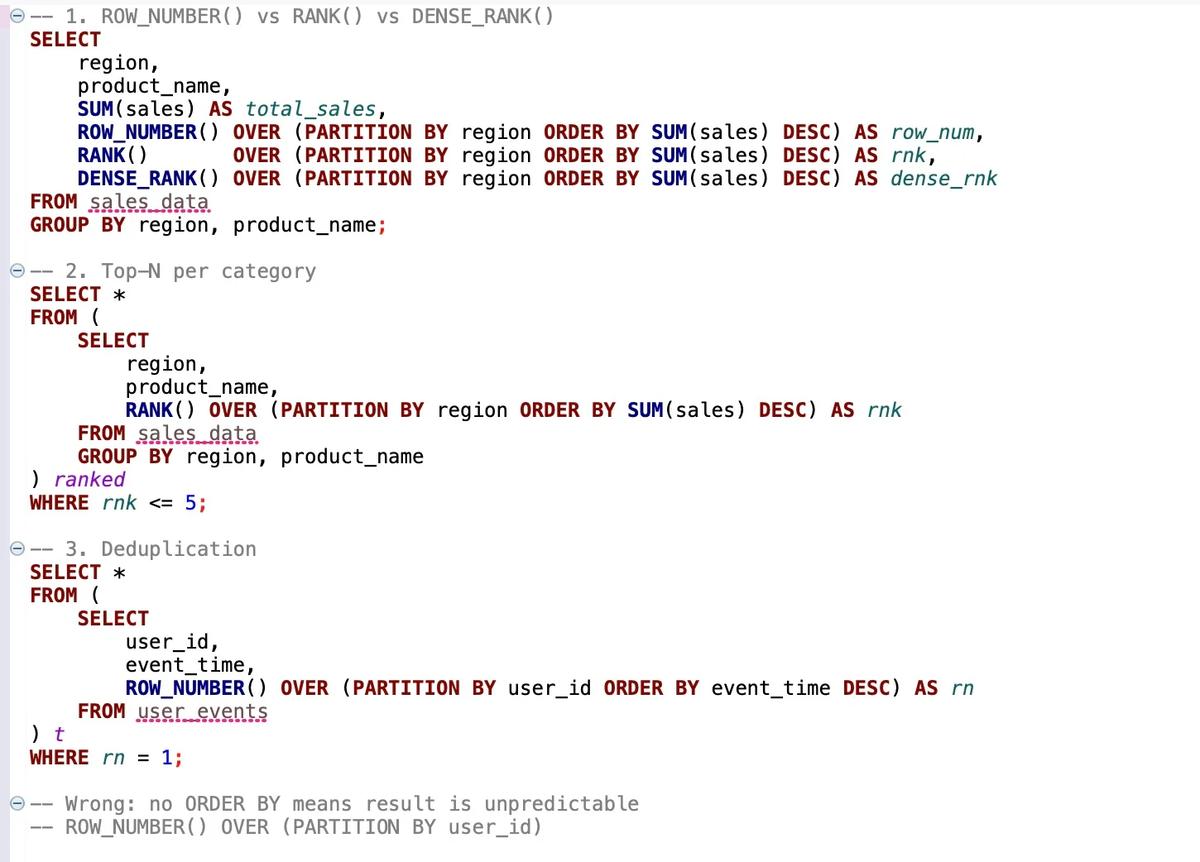
Choose the Right SQL Ranking Function to Avoid Misleading Gaps
ROW_NUMBER(), RANK(), DENSE_RANK(). Three functions, three different behaviors. Pick the wrong one and your rankings mislead. Here are 4 patterns to get it right: - ranking with gaps vs without - top-N per category - deduplication - running totals 1. ROW_NUMBER() vs RANK() vs DENSE_RANK() Three functions, three behaviors when there are ties. - ROW_NUMBER(): always unique (1, 2, 3, 4) - RANK(): gaps on ties (1, 2, 2, 4) - DENSE_RANK(): no gaps on ties (1, 2, 2, 3)
By Karina | Python | Excel | Stats | DataScience | DataAnalytics

Social•Feb 21, 2026
Analyst Ads Overpromise Python; Excel, SQL Dominate Daily
Unpopular opinion: Data analyst job postings ask for Python. Data analyst jobs don't actually use Python. What you'll use daily: Excel — every single day SQL — every single day Power BI or Tableau — multiple times per week Python — maybe once a month This pattern holds...
By Karina | Python | Excel | Stats | DataScience | DataAnalytics

Social•Feb 20, 2026
Replace If‑elif Chains with Clean Python Dispatch Patterns
The more if-elif chains you write, the harder your code gets to change. Python has cleaner patterns for this. Here are 4 worth knowing: - dictionary dispatch - guard clauses - match/case - conditional expressions 1. Dictionary dispatch. Replace long equality checks with a dict. Constant-time lookup. No branching....
By Karina | Python | Excel | Stats | DataScience | DataAnalytics

Social•Feb 19, 2026
Free Resources Replace Costly Bootcamps—Discipline Is Key
You don't need a bootcamp to become a data analyst. Everything you need is free: Excel/SQL/Python/Power BI tutorials — YouTube SQL practice — SQLZoo, LeetCode, HackerRank Datasets for portfolio projects — Kaggle, data.gov, Google Dataset Search Resume feedback — Reddit (r/datascience, r/resumes), LinkedIn communities Interview prep...
By Karina | Python | Excel | Stats | DataScience | DataAnalytics

Social•Feb 17, 2026
Master Six Core Concepts to Decode Regression Results
Most analysts can run a regression. Very few can explain what the output actually means. That gap is a statistics fundamentals problem. Not a tools problem. Not a Python problem. Not a years-of-experience problem. If you can't explain what your numbers mean, you...
By Karina | Python | Excel | Stats | DataScience | DataAnalytics

Social•Feb 16, 2026
Decode Common SQL Errors and Their Real Fixes
Common SQL errors and what they REALLY mean "Column ambiguously defined" You joined tables with the same column name. Fix: Add table aliases (customers.id not just id) "Not a single-group group function" You mixed aggregated + non-aggregated columns. Fix: Add all non-aggregated columns to GROUP BY "Division...
By Karina | Python | Excel | Stats | DataScience | DataAnalytics
Social•Feb 13, 2026
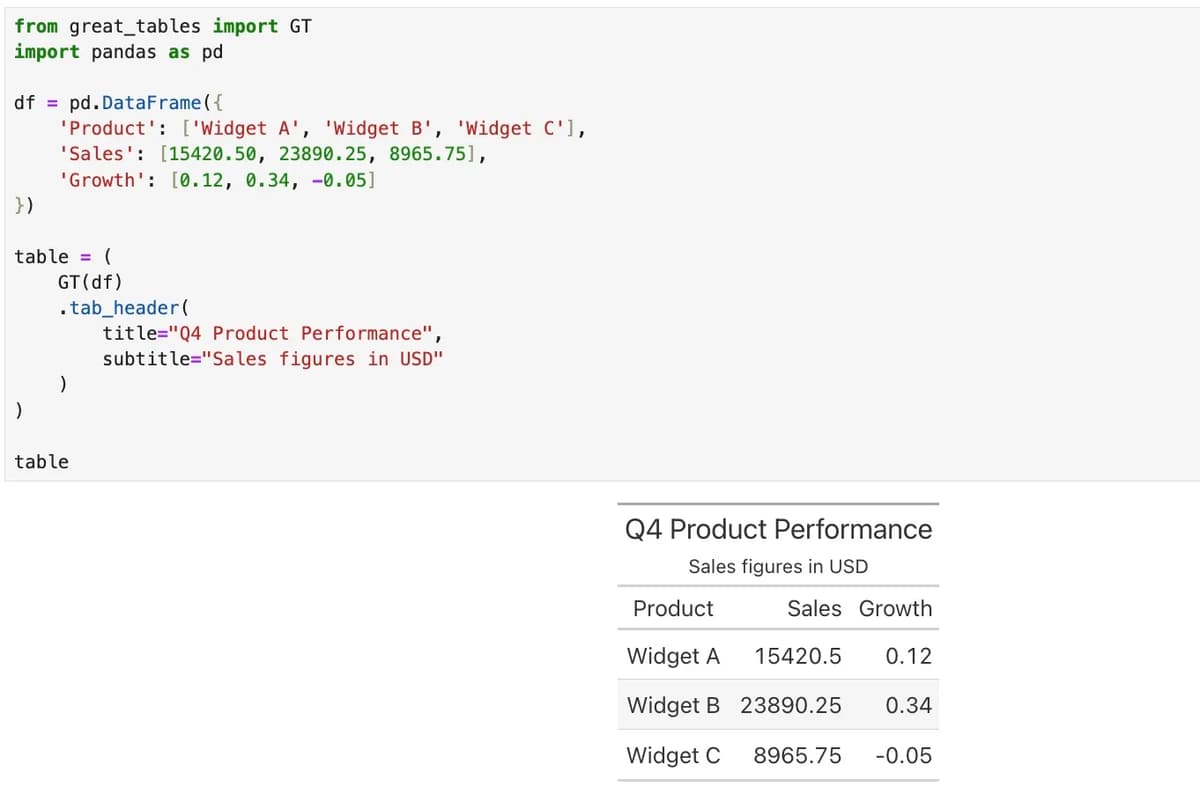
Great Tables Turns DataFrames Into Presentation‑ready Tables
Turning a DataFrame into a presentation-ready table in Python. Recently I tried a library called Great Tables and it makes formatting tables very easy. - Works with Pandas & Polars - 19 formatting methods (currency, percentages, dates, scientific notation) - Export to HTML, LaTeX,...
By Karina | Python | Excel | Stats | DataScience | DataAnalytics

Social•Feb 10, 2026
Decompose Sales Data to Distinguish Real Growth
Your manager asks: "Sales jumped in December — is that a real growth or seasonality?" You pull up a line chart. Sure, it shows the spike. But it doesn't tell you why. And that's what they actually want to know. This is where time...
By Karina | Python | Excel | Stats | DataScience | DataAnalytics

Social•Feb 8, 2026
Visualize Churn Timing with Python Cohort Heatmaps
At my work every month we look at customer retention. A single churn rate doesn't tell the whole story. You need to show when customers are leaving. Here's how you can do it with a cohort analysis heatmap in python
By Karina | Python | Excel | Stats | DataScience | DataAnalytics