
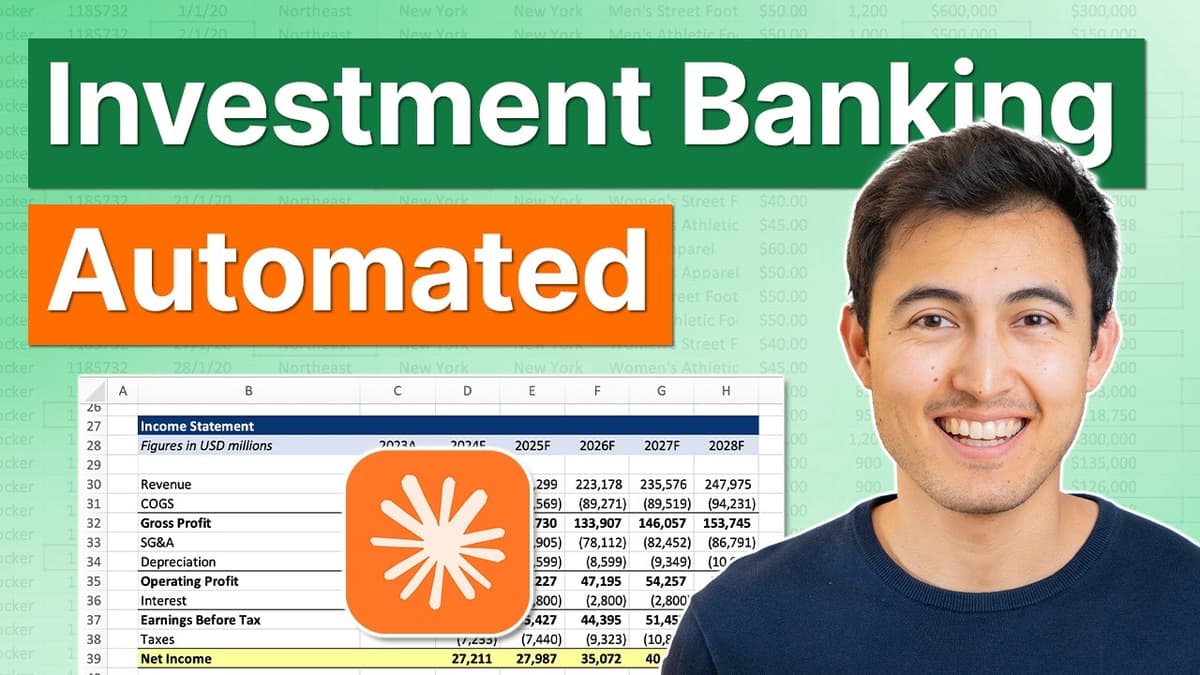
New Claude for Investment Banking Is INSANE
The video introduces Claude’s new finance‑focused plugins and agents, a suite designed to streamline investment‑banking workflows from market research to pitch‑deck creation. Viewers learn how to download the Claude desktop app, add plugins by pasting a GitHub repository URL, and sync the library, unlocking tools for equity research, private‑equity, and wealth‑management tasks. Key insights include the distinction between plugins (single‑skill functions) and agents (end‑to‑end workflows). Users can invoke specific capabilities with slash commands—e.g., "/DCF" for discounted cash‑flow models or "/onepager" for a concise slide. The demo walks through building a Chipotle one‑pager, generating a 22‑page market‑research memo, and producing a comparable‑company valuation spreadsheet that auto‑references earlier research. Notable examples feature a fully branded PowerPoint deck assembled from the research, then transformed via the Claw.ai design add‑on into an interactive HTML presentation with scenario toggles and slicers. The presenter highlights both the speed gains and practical limits, such as high credit consumption and occasional performance drops when using lower‑tier models. Overall, Claude’s finance extensions promise to cut weeks of manual analysis into minutes, but firms must balance productivity gains against cost and model‑limit considerations, especially as AI usage scales across banking teams.

Master Claude in Excel in Just 10 Minutes
The video demonstrates Claude for Excel’s expanded capabilities beyond chat, showing installation, model selection (Opus 4.7 vs Sonnet 4.6), and paid-access requirements. It highlights connectors (Gmail, Google Drive) to import files directly into Excel, custom formatting via saved instructions (example:...

Claude vs Copilot vs ChatGPT vs Tracelight in Excel (Surprising Results)
The video pits Claude, Tracelight, ChatGPT and Microsoft Copilot against each other in Excel, testing five real‑world tasks from PDF balance‑sheet extraction to error detection in complex financial models. Across the board the tools diverge on speed, accuracy and presentation. Tracelight...

I Tried 100+ AI Tools. These Are the Best for Finance
The video walks viewers through a curated suite of AI applications that cover every stage of a financial analyst’s workflow, from initial company research to the final pitch‑deck. It highlights tools such as FinTool for investment thesis drafting, AlphaSense for...

Build INSANE Financial Models With This AI Tool
Trace Light is an AI‑powered Excel add‑in designed for consulting, banking and private‑equity professionals, promising to turn raw spreadsheets into polished financial models in seconds. The video walks through five escalating use‑cases—from basic formatting to a full discounted cash‑flow valuation—showcasing...
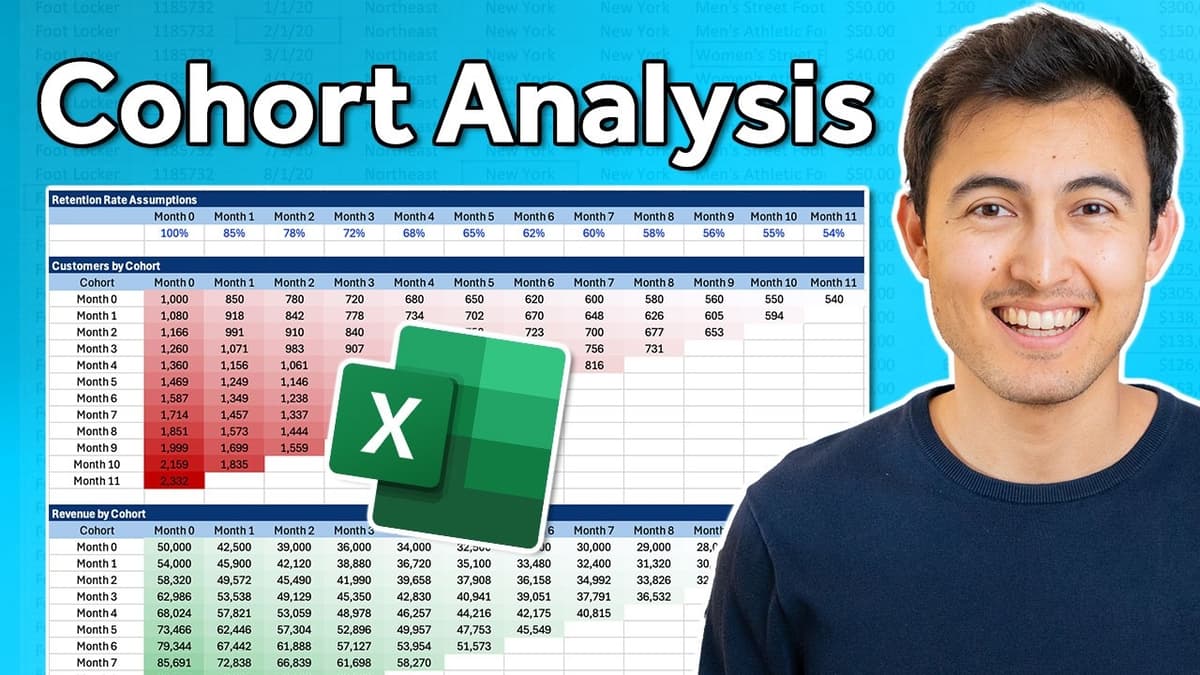
Make a Cohort Analysis in Excel
The video walks viewers through constructing a dynamic cohort analysis template in Excel, enabling businesses to track customer behavior, revenue generation, and acquisition profitability across monthly cohorts. It begins by defining assumptions—initial customers, month‑over‑month growth, average revenue per user, acquisition cost,...

Create Clickable Tabs Inside an Excel Sheet
The video demonstrates how to build fully clickable, color‑changing tabs inside a single Excel worksheet, turning a static table into an interactive budget dashboard. The process starts by converting raw data into an Excel table (Ctrl T), naming a cell “selected_month”, and...