Recent Posts
Social•Feb 21, 2026
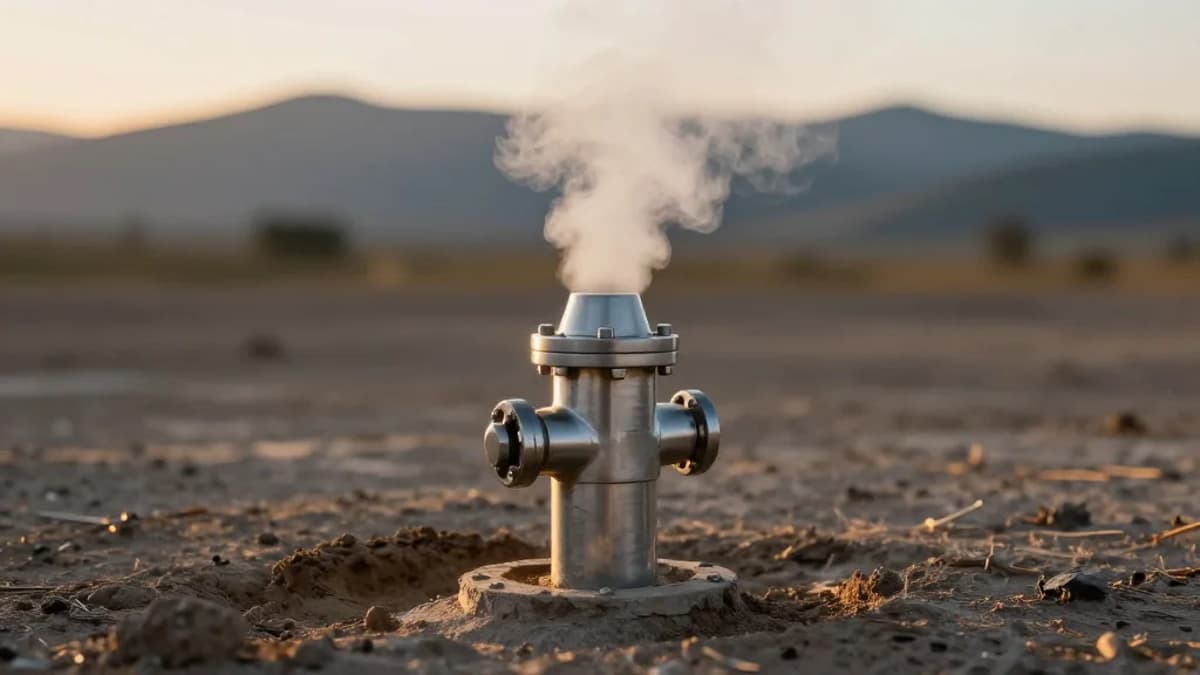
Enhanced Geothermal Beats New Nuclear on Cost, Speed, Cleanliness
And why bother with new nuclear when enhanced geothermal does the exact same thing but faster, cheaper, cleaner & safer and with less land & no mining and can be done most anywhere. https://web.stanford.edu/group/efmh/jacobson/Articles/I/150Country/150-CountriesEGS.pdf https://news.stanford.edu/stories/2026/01/geothermal-clean-renewable-energy-transition-study-research Nuc pushers have no idea what the alternatives are.
By Mark Z. Jacobson

Social•Feb 21, 2026
Nuclear Costs Billions, Takes Decades—Solar Wins
New nuclear is crazy-and useless $47.2 bil for 3.26 GW Hinkley Point C=$14.5/W vs $1/W for solar and wind And HPC will take 22 years from planning to operation (2008-2030), vs 1-3 for PV/wind Similar statistics for Vogtle Vaporware SMRs are worse https://t.co/M80o9ICaUb
By Mark Z. Jacobson

Social•Feb 21, 2026
Fake Eagle Photo Debunked; Turbines Kill Far Fewer Birds
Fact-checkers debunk doctored photo shared by US government, who claimed it was of a bald eagle hurt by a wind turbine. Also, wind turbines account for fewer bird deaths than fossil fuels and only 0.002-0.028% of bird deaths. https://t.co/JXeX407CcE
By Mark Z. Jacobson
Social•Feb 19, 2026
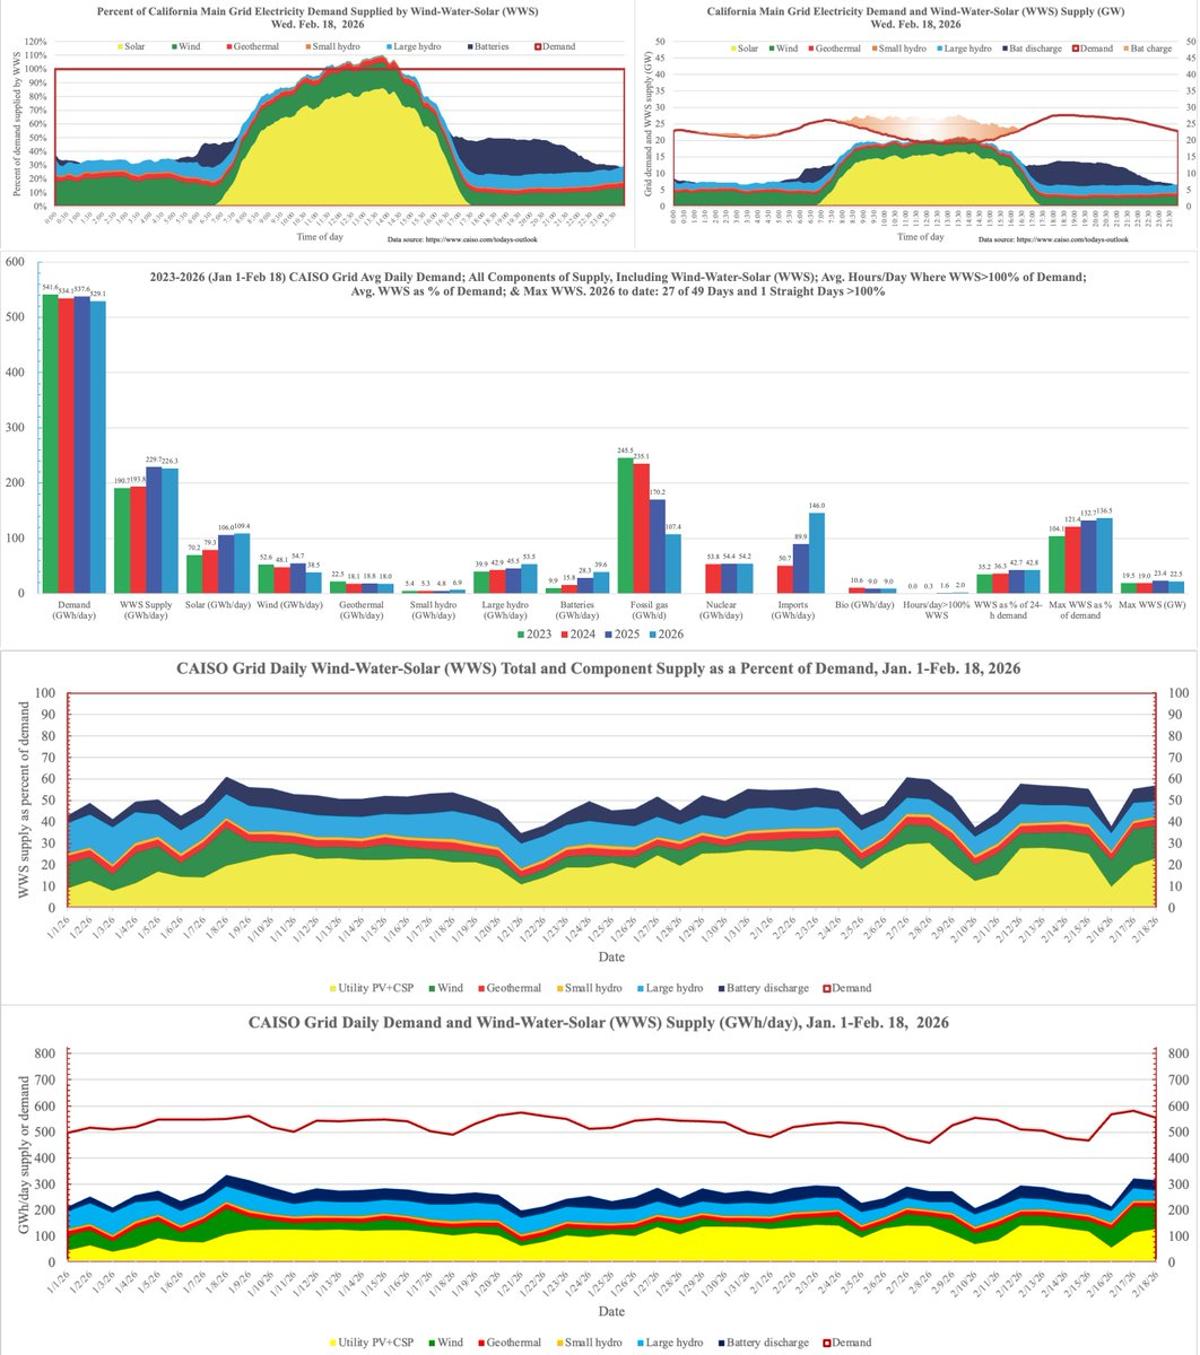
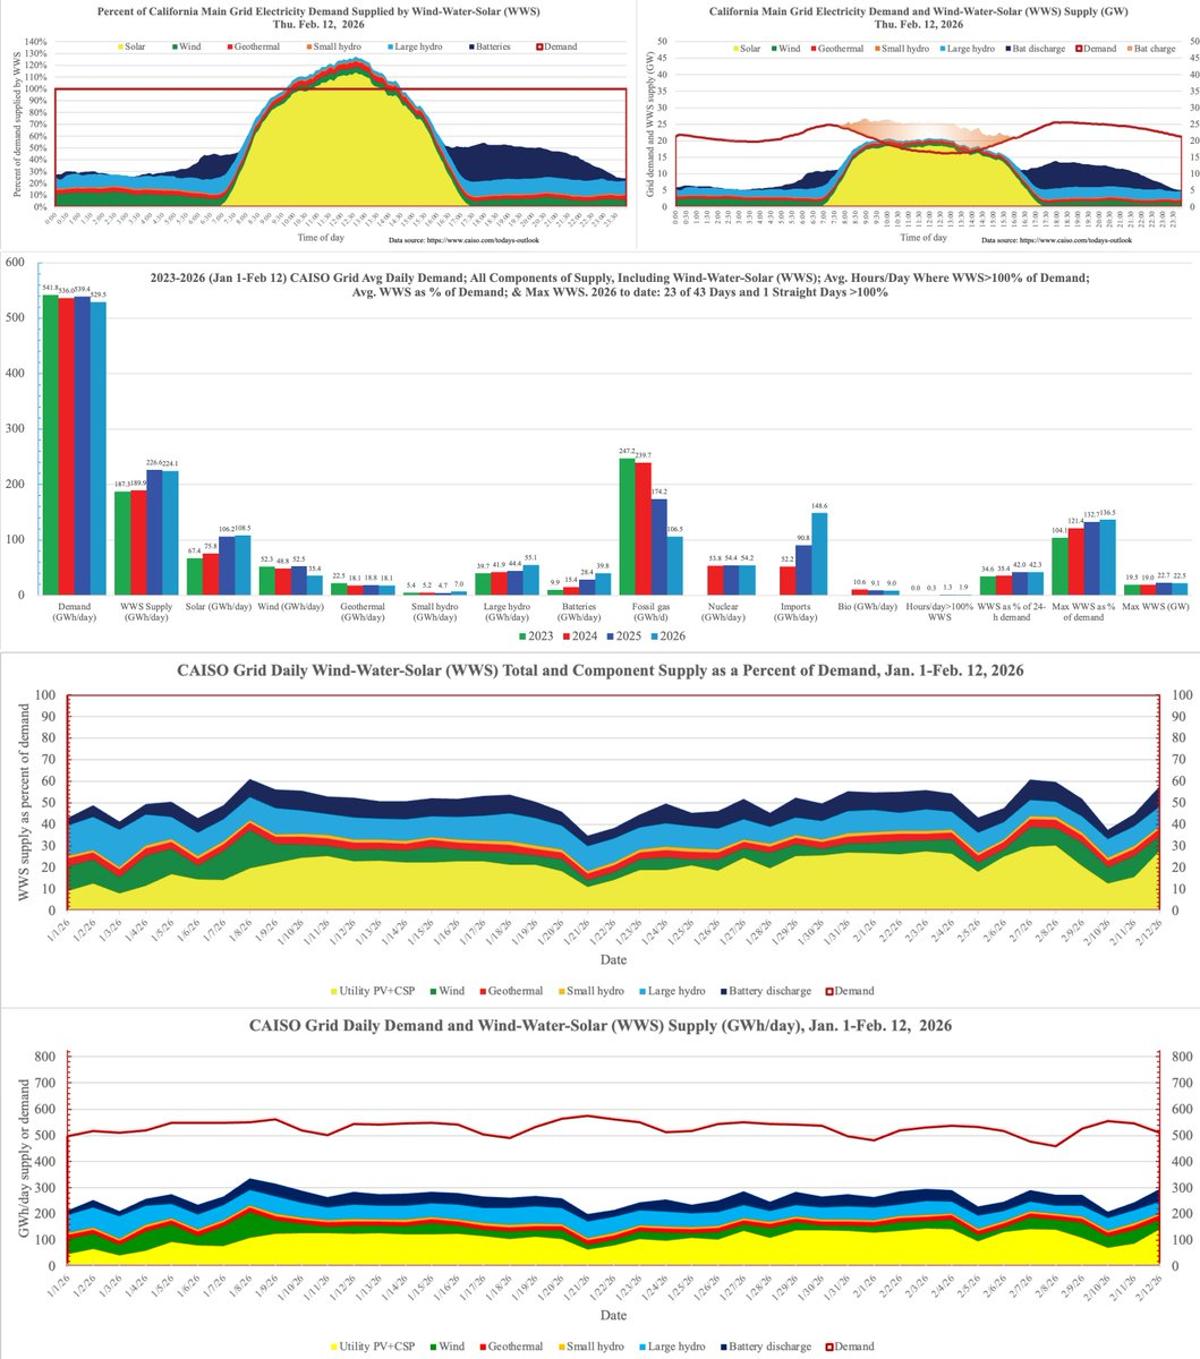
CAISO Hits >100% Renewable, Gas Share Drops Sharply
27th of 49 days in 2026 with >100% WindWaterSolar on the @CaliforniaISO grid. Gas own 54% in vs 2024 and 56% vs 2023 Batteries up 54% vs 2024 and 301% vs 2023 PV up 38% vs 2024 and 56% vs 2023 PV+Batteries displacing gas Imports...
By Mark Z. Jacobson

Social•Feb 16, 2026
Test Your Myths: Wind Power Misconceptions Quiz
Can you spot these misconceptions around wind power? Take our quiz @washingtonpost https://www.washingtonpost.com/opinions/interactive/2026/wind-power-renewables-us-energy-mix-quiz/ by Keith Moore
By Mark Z. Jacobson
Social•Feb 13, 2026
California Grid Demand Falls as Rooftop Solar Offsets EVs
California grid electricity demand continues to decline despite 2.5 million EVs and lots of data centers in the state 2026 Demand on CAISO grid down 1.84% v '25; 1.22% v '24; and 2.27% v '23 Due to growth in behind-the-meter roof PV,...
By Mark Z. Jacobson
Social•Feb 11, 2026
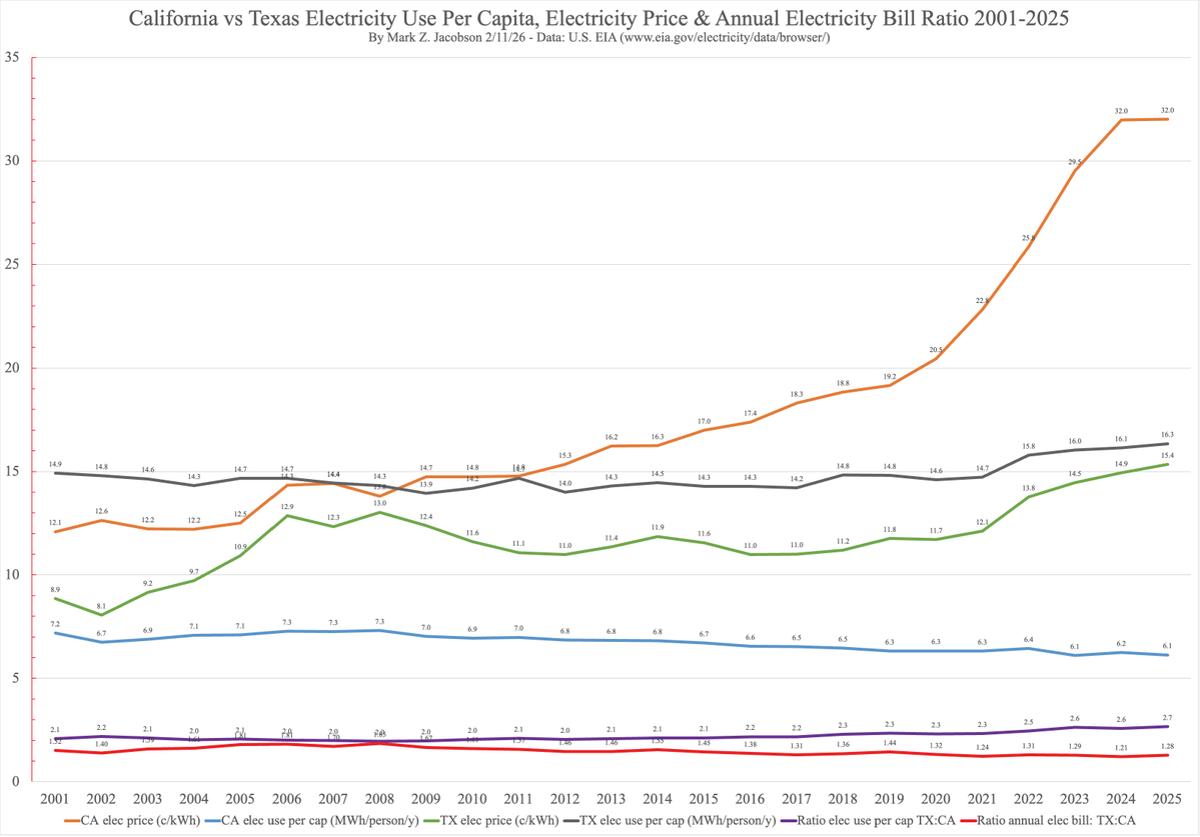
Texans Use More Power, Paying 28% More Per Capita
Despite CA having 2x the elec price as TX, Texans pay 28% more per cap for elec yearly because TX uses 2.7x the elec per cap as CA (vs 2.1x in 2001, so nothing to do with weather) even with...
By Mark Z. Jacobson

Social•Feb 10, 2026
Louisiana's Blue Ammonia Gamble Fuels Pollution, Costs
“These plants increase air pollution, they increase global warming...they increase not only energy costs, but total social costs, and so there’s zero benefit — except to the people who are taking the subsidies" Louisiana bets big on ‘blue ammonia https://t.co/3Se0MmNpqO
By Mark Z. Jacobson

Social•Feb 9, 2026
California Solar's Reliability Nears That of US Coal
CA solar has similar reliability as US coal: 2025 avg capacity factor of all 21.58 GW* of solar on @California_ISO grid: 30.2% 2024 CF US coal: 42.6% https://t.co/hFwYGckUSR Coal not much more reliable than CA solar *=avg Dec '24 & Dec '25 nameplates Solar: 57,054 GWh/y
By Mark Z. Jacobson