
Recent Posts
Video•Feb 28, 2026
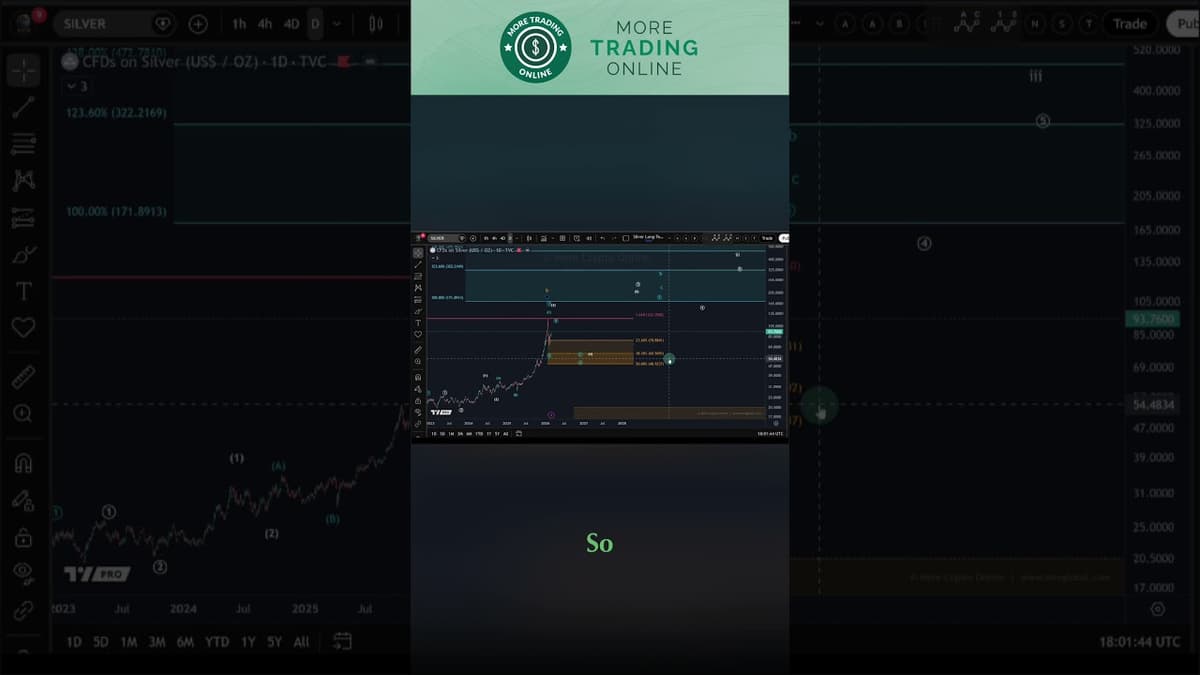
Silver Long-Term Roadmap | Elliott Wave Analysis Weekly Chart
The video presents a long‑term roadmap for silver, emphasizing analysis on the weekly chart and higher‑time‑frame structures. The presenter frames the discussion against the backdrop of escalating geopolitical tensions involving Iran, Israel, and the United States, noting that such uncertainty often fuels safe‑haven demand for precious metals. Key insights include a detailed look at current market structure, identification of critical pivot zones, and the expectation that heightened geopolitical risk will push silver higher alongside gold. The analyst stresses that the market’s volatility creates “very very important pivots and inflection points” that could dictate the next directional move. Notable remarks highlight the direct link between geopolitical escalation and precious‑metal price dynamics, with the speaker stating that “uncertainty in the markets drives gold and silver higher.” The video refrains from deep political commentary, focusing instead on technical signals that may precede a bullish breakout. For investors, the implication is clear: monitor higher‑time‑frame charts, watch identified pivot levels, and consider silver’s potential as a hedge amid ongoing geopolitical risk. Timing entries around these inflection points could capture significant upside while managing downside exposure.
By More Trading Online
Video•Feb 27, 2026
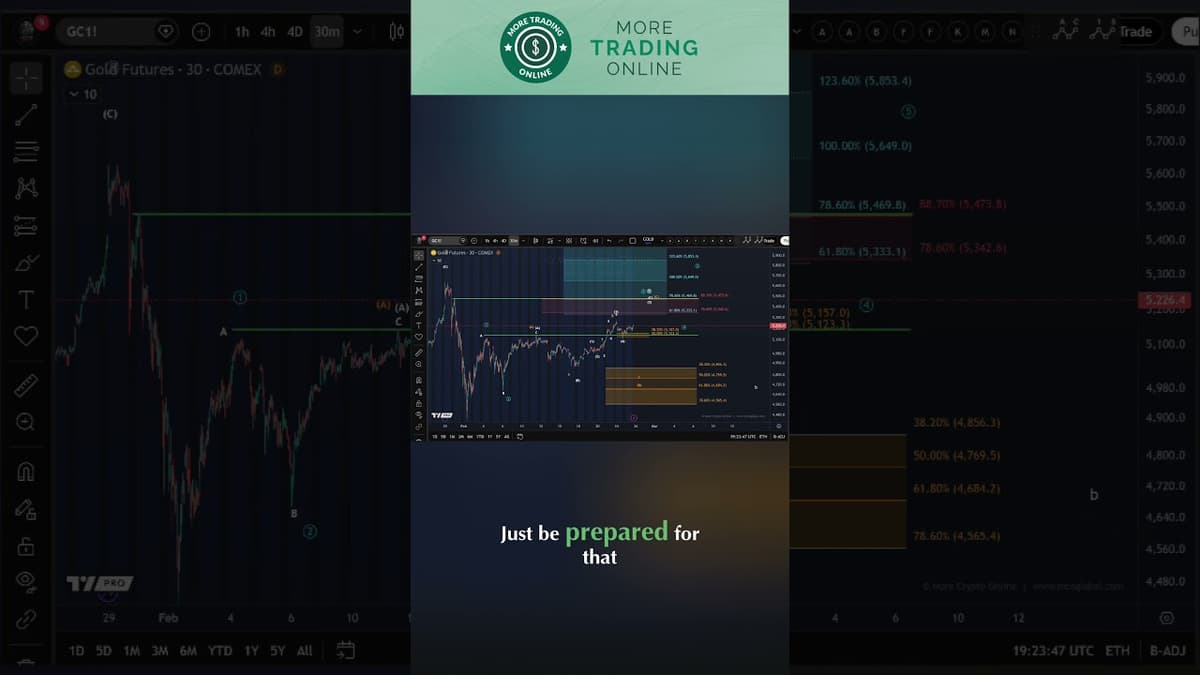
Gold Chart Analysis Today: Key Support Levels Based on Elliott Wave Analysis
The video provides an Elliott Wave analysis of gold, focusing on the current support zone and potential upward movement. The analyst notes gold is trading just above the $5,123‑$5,157 support band. The C‑wave remains incomplete, requiring an additional high to satisfy...
By More Trading Online
Video•Feb 26, 2026
Gold Chart Analysis Today: Key Support Levels Based on Elliott Wave Analysis
The video provides a technical breakdown of gold’s price action through the lens of Elliott Wave theory, zeroing in on whether the metal is poised to launch into a third‑wave impulse. The analyst stresses that a decisive breakout above the...
By More Trading Online

Video•Feb 26, 2026
Gold Chart Analysis Today: Key Support Levels Based on Elliott Wave Analysis
The video delivers a detailed Elliott Wave and technical analysis of gold, pinpointing current price structure, key support around $1,950 and resistance near $2,050. It outlines short‑term setups, mid‑term wave‑5 completion scenarios, and longer‑term structural risks. The presenter also references...
By More Trading Online
Video•Feb 25, 2026
Gold Chart Analysis Today: Key Support Levels Based on Elliott Wave Analysis
The video delivers a professional Elliott Wave and technical analysis of gold, pinpointing current price structure, key support around $1,950 and resistance near $2,050. It outlines short‑term setups, mid‑term corrective wave possibilities, and longer‑term bullish impulse scenarios. The analyst also...
By More Trading Online

Video•Feb 25, 2026
Gold Chart Analysis Today: Key Support Levels Based on Elliott Wave Analysis
The video delivers a detailed Elliott Wave and technical analysis of gold, pinpointing current support around $1,950 and resistance near $2,050 per ounce. It outlines short‑term setups, mid‑term bullish scenarios, and a longer‑term corrective wave that could last through 2025....
By More Trading Online

Video•Feb 23, 2026
Gold Chart Analysis Today: Key Support Levels Based on Elliott Wave Analysis
The video delivers a detailed Elliott Wave and technical breakdown of gold, pinpointing current price structure, key support around $1,950 and resistance near $2,050. It outlines short‑term setups and mid‑to‑long‑term scenarios, suggesting a potential bullish impulse if the market clears...
By More Trading Online