
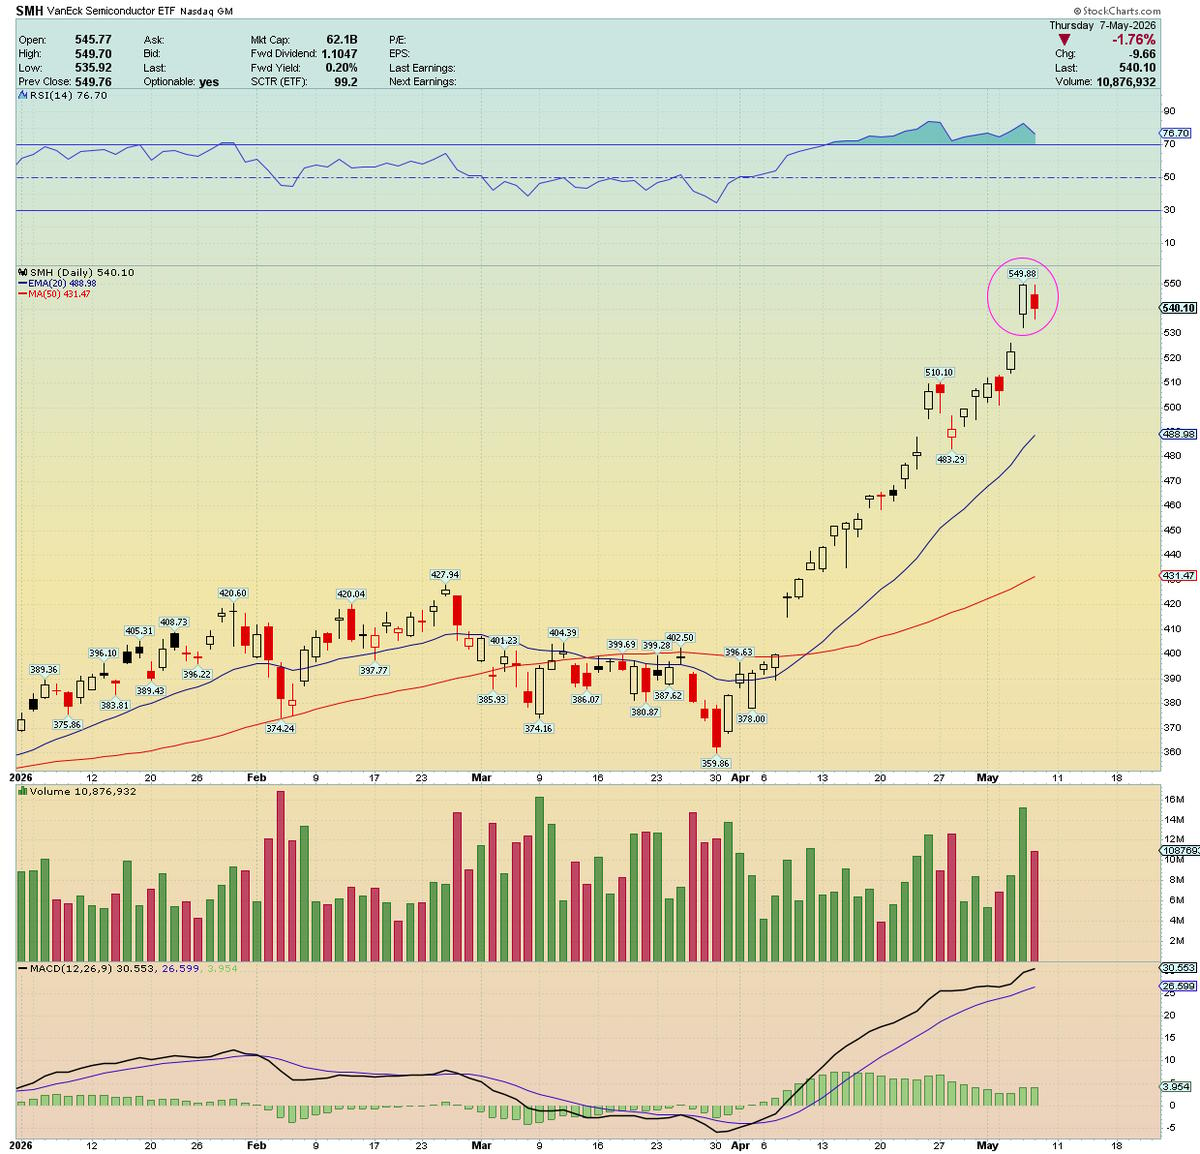
Bearish Harami Signals Overdue SMH Pullback Opportunity
A Bearish Harami candlestick pattern printed in $SMH this week(yesterday and today) ... If a healthy and overdue pullback in this sector is ever going to happen, here's the spot to do it, imho https://t.co/83usB5FgMR

Simple Finviz Scanning Method Stands the Test.
I use @finviz_com as my primary scanning platform... then I use this simple method for scanning: https://t.co/VUcH772iYX Often times, the simplest process works best and survives the test of time
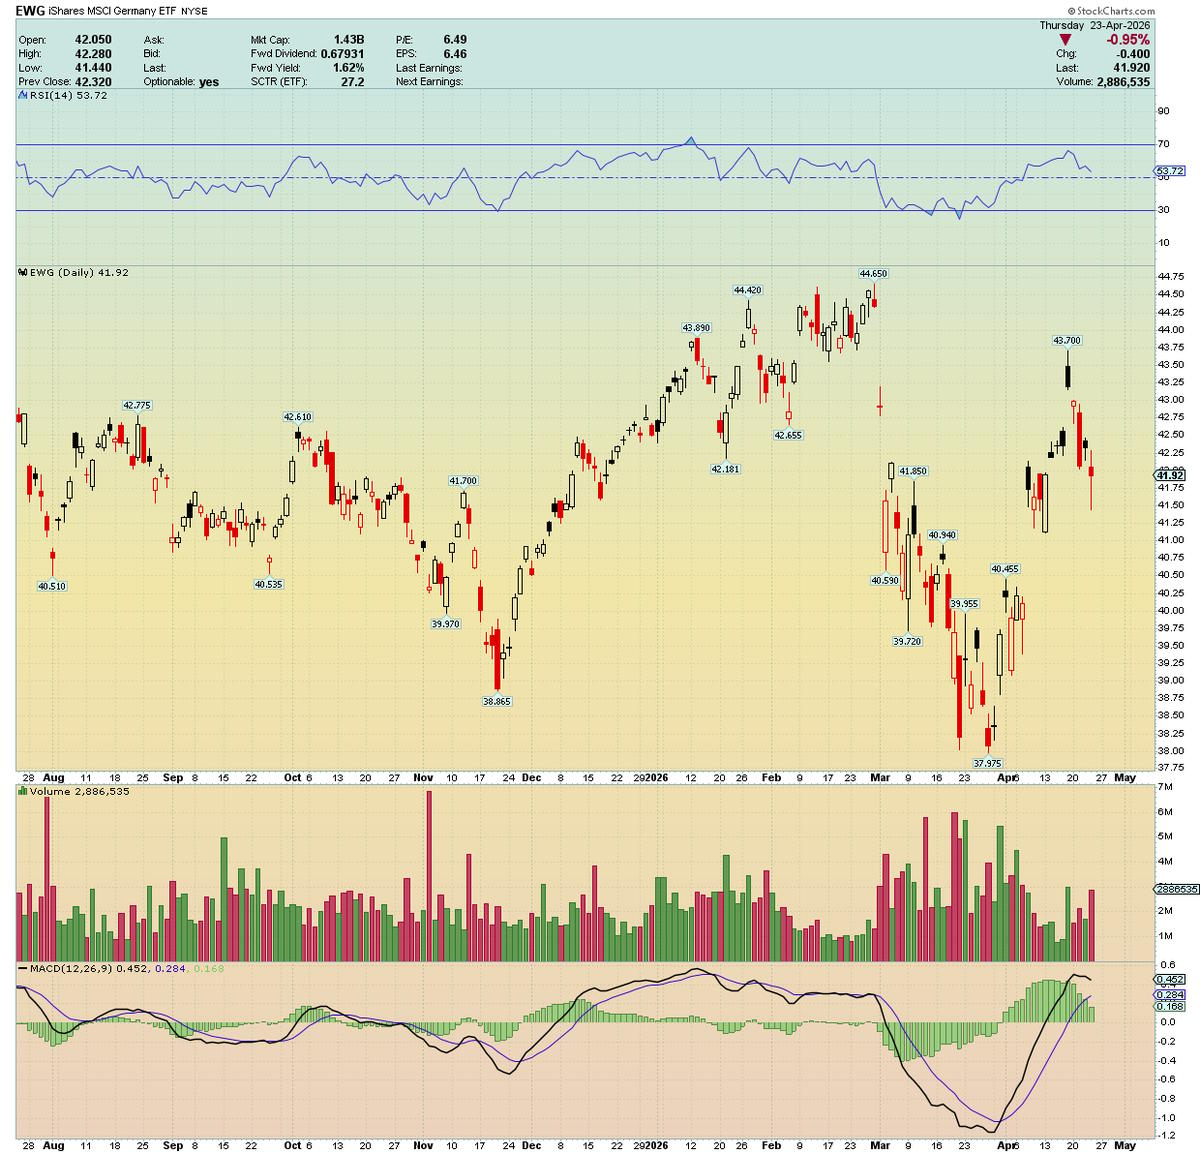
US Market Rally Leaves Europe, China Trailing
What's notable about the recent mega-insta-rally taking place in the majority of US indices is that it's not bringing in the European and Chinese market indices along for the ride?? German Index, Euro Stoxx50, FTSE and Shanghai exchange are noticeably...

AXTI Poised for Multi‑day Bounce Toward $55‑$60
$AXTI Wedging nicely after ~40% pullback since printing new highs a mere 6 days ago. Short-term oversold enough here for a multi-day bounce. Printed an INSIDE DAY candle today. Look for upside traction from here as we move into the second...

GLW Poised for Upside After 50‑day MA Reversal
$GLW A good setup to watch next few days. Lovely reversal off the 50 day MA today to print an INSIDE DAY candle. Look for upside follow-thru tomorrow. $GLW is a direct beneficiary from A.I. integration ecosystem. Targets $160 https://t.co/xF1tgLnRf6

Bullish Divergence Signals Short‑term Nasdaq, S&P Bounce
We have an interesting development after today's action and close. NYMO entered oversold territory last week but NAMO still has not. However, today we're sitting at a potential bullish divergence in that the indices close red to extend last week's...
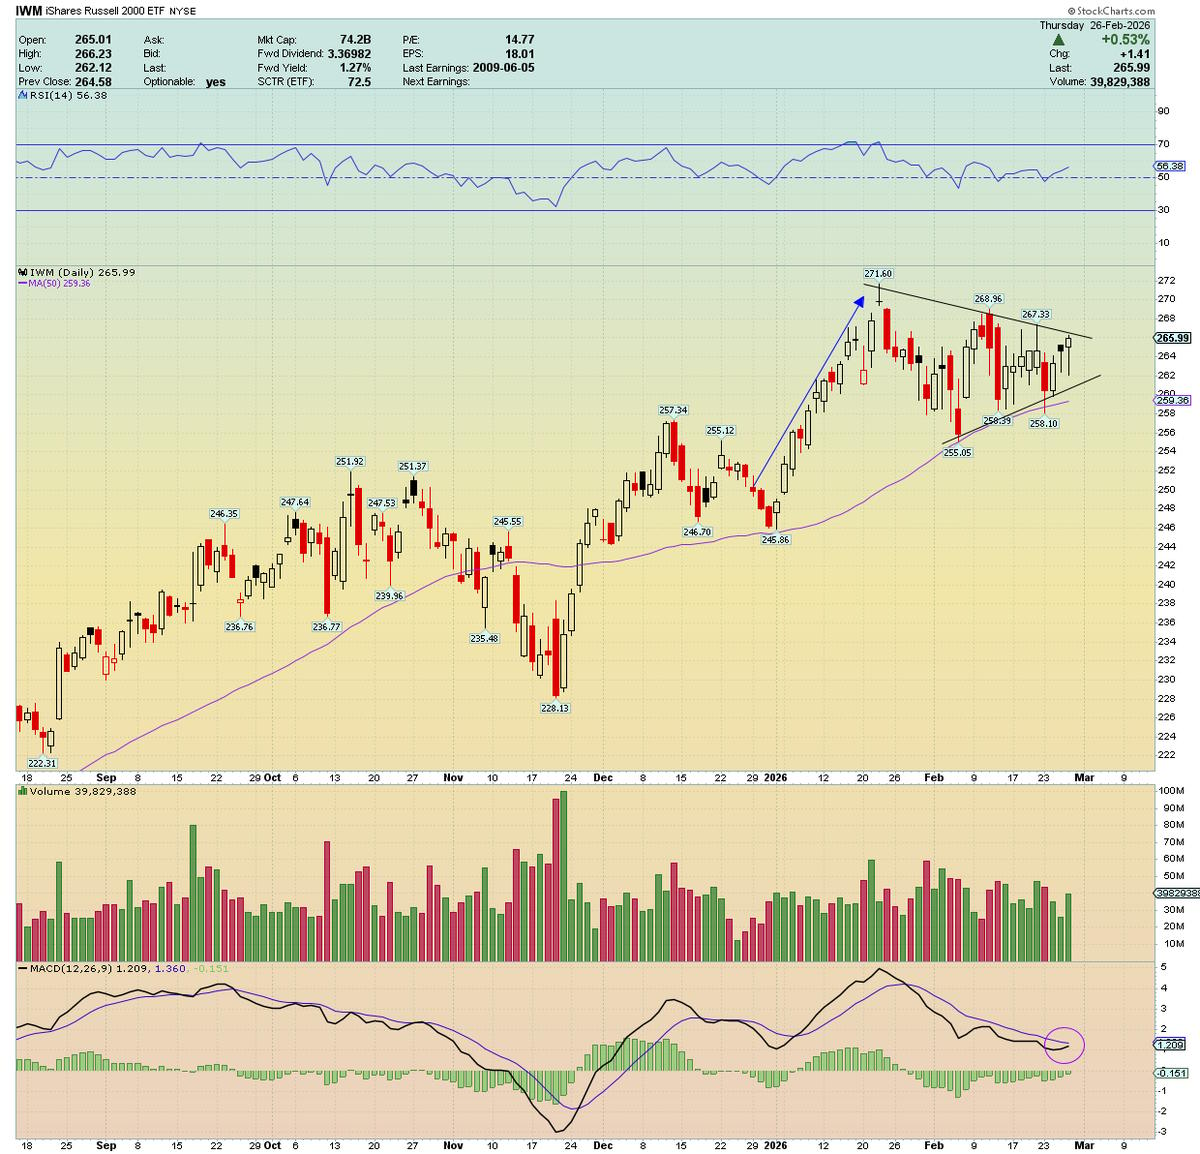
IWM Projected to Hit $290‑$300 by 2026
Check out the beauty of this $IWM chart ... 2026 targets: $290 to $300 https://t.co/pFti1OyqaH