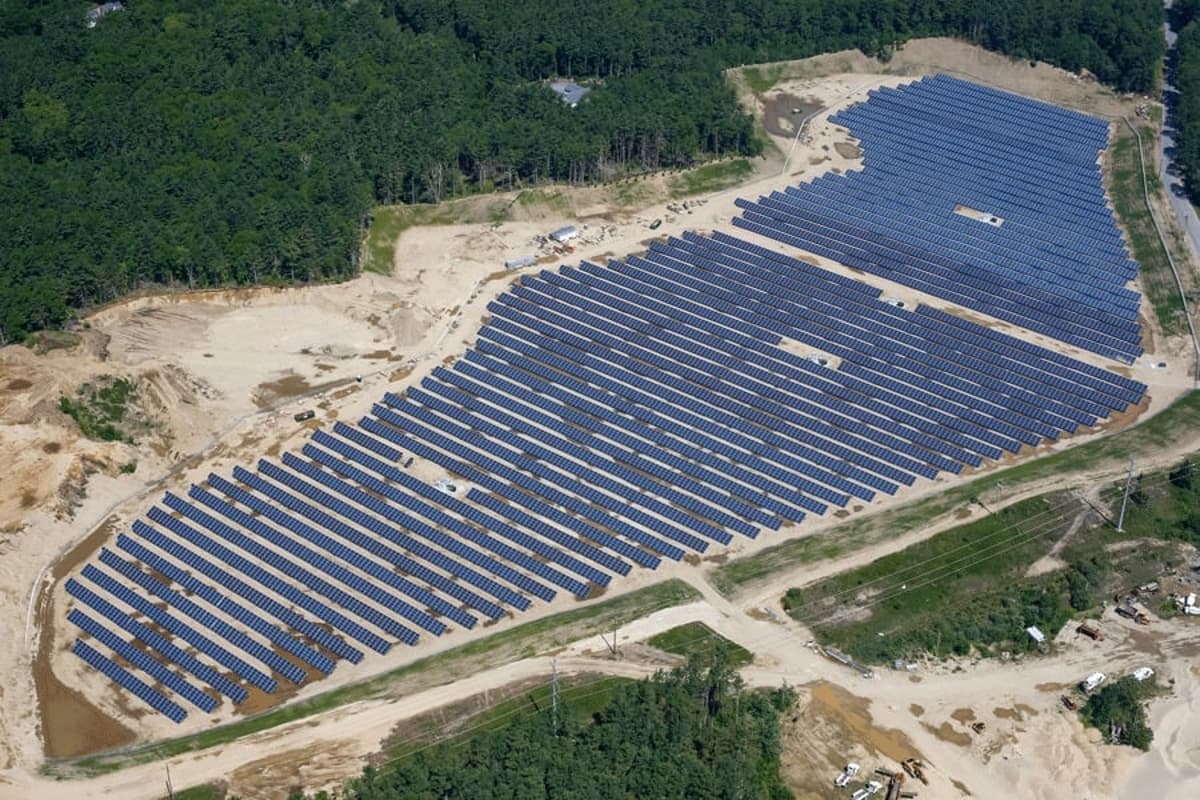
US Adds 43.2GW of New Solar PV Capacity in 2025
•March 10, 2026
0
Why It Matters
The slowdown highlights how policy shifts and tax‑credit timing can rapidly affect deployment, while the projected market expansion underscores the sector’s long‑term growth potential for investors and manufacturers.
Key Takeaways
- •2025 solar installations fell 14% to 43.2 GW.
- •Utility‑scale capacity dropped 16% to 34.7 GW, Q4 slump 40%.
- •C&I solar grew 6% while residential flatlined.
- •New domestic wafer plant opened, boosting manufacturing.
- •Market projected to triple to 769 GW by 2035.
Pulse Analysis
The 2025 solar deployment dip underscores how quickly federal policy can reshape the U.S. renewable landscape. Revised tax‑credit timelines under the One, Big, Beautiful Bill Act introduced a ‘safe‑harbour’ requirement that forced developers to lock in construction starts by July 2026, prompting a 40 % plunge in utility‑scale installations during Q4. By deferring projects to meet the safe‑harbour window, firms sacrificed near‑term capacity growth for a more secure pipeline, illustrating the power of tax incentives to dictate project timing and cash flow. Projects that missed the July 2026 threshold will lose eligibility for the Investment Tax Credit, potentially reshaping financing structures for large‑scale solar.
Segment‑level data reveal a mixed performance across the market. Utility‑scale capacity fell 16 % to 34.7 GW, while residential installations slipped only 2 % to 4.6 GW, reflecting the missed rush before the 25D credit expiration and lingering equipment shortages. In contrast, commercial‑industrial solar rose 6 % to 2.3 GW, buoyed by California’s legacy NEM 2.0 projects. Community‑solar projects contracted 25 % as pipelines in Maine and New York stalled. Meanwhile, domestic manufacturing gained momentum, highlighted by Corning’s first U.S. wafer plant since 2016, expanding the supply chain. The community‑solar contraction signals a shift toward larger, utility‑linked projects as states recalibrate incentives.
Looking ahead, analysts still forecast the U.S. solar market to nearly triple to 769 GW by 2035, driven by data‑center demand, permitting reforms, and evolving tariff regimes. However, the pending Foreign Entity of Concern (FEOC) rules introduce uncertainty for both developers and manufacturers, especially as the July 2026 construction‑start deadline approaches. Investors should monitor Treasury guidance and state‑level incentives, as the balance between policy stability and supply‑chain resilience will determine whether the sector can sustain its projected growth trajectory. Domestic wafer capacity could mitigate import reliance, positioning U.S. firms to capture a larger share of the expanding market.
US adds 43.2GW of new solar PV capacity in 2025
0
Comments
Want to join the conversation?
Loading comments...