
Korean Options Mania: How AI, Retail Leverage, and Memory Stocks Turned South Korea Into the World’s Most Volatile Market
South Korea’s derivatives market entered a frenzy in 2026 as retail investors poured roughly $39 billion into leveraged equity products, including ELWs, weekly options and 2× leveraged ETFs. The surge centers on AI‑driven memory‑chip stocks such as Samsung Electronics and SK Hynix, each flirting with a $1 trillion market cap. Record margin debt and a flood of new accounts pushed VKOSPI volatility into the 70‑plus range, with spikes up to 89 during stress periods. The combination of AI fundamentals and aggressive retail leverage makes Korea the world’s most volatile equity market today.
Triple Witching + FOMC Fuels Volatility Risk
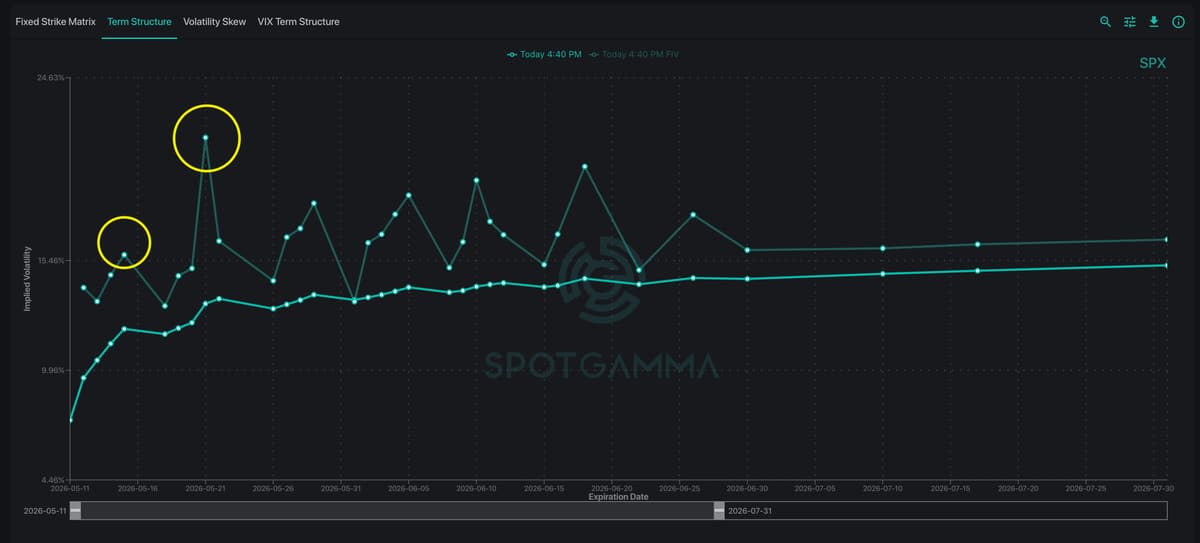
Last week’s market volatility was driven by the CPI report, the massive SpaceX IPO and heightened geopolitical headlines, all occurring alongside a surge in short‑dated (0DTE) options trading. Dealer positioning shifted to negative gamma, meaning market‑makers now hedge in the...

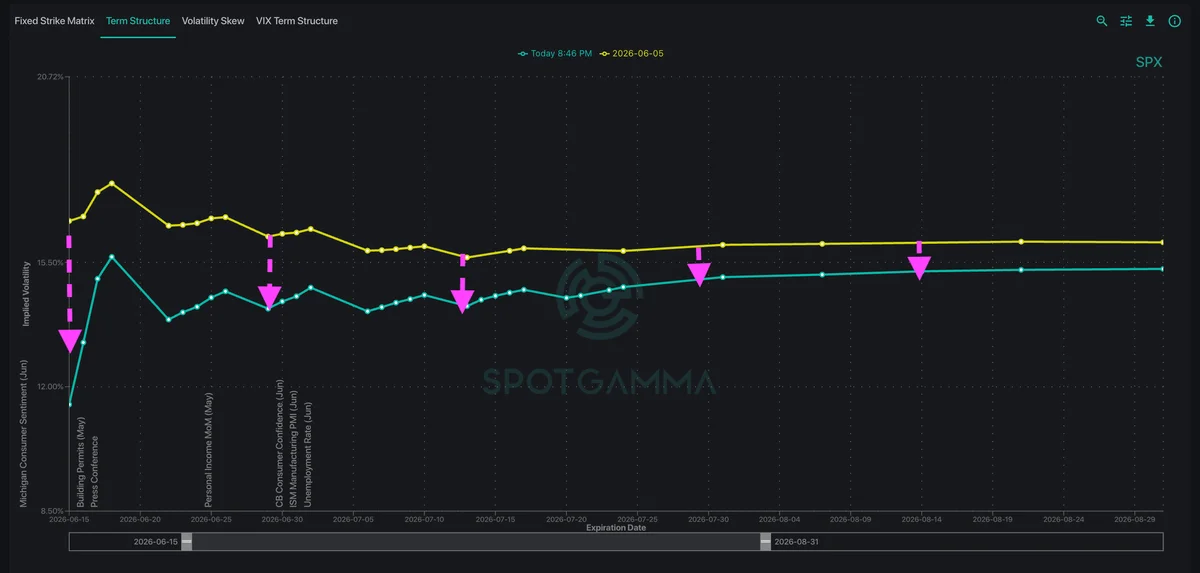
Navigating Market Uncertainty Ahead of CPI and SpaceX IPO: Gamma Dynamics, Key Support Levels, and Options Flow Insights
Investors are bracing for heightened volatility as the U.S. Consumer Price Index (CPI) release and the anticipated SpaceX IPO loom. SpotGamma’s analysis highlights a tightening gamma landscape, with short‑dated options pulling the market toward key support zones around the 4500‑4600...

Dispersion & Correlation Are Screaming Overbought. Downside Hedging Is Cheap.
The CBOE Dispersion Index (DSPX) has surged to levels last seen during the Covid crash, while the Correlation Index (COR1M) has slipped to near‑record lows. This rare divergence reflects extreme positioning in AI‑related equities, creating a pronounced risk of a...

ES Calls Surge 406% as SpotGamma Identifies the 6830 Gamma Magnet Before the Move
On April 9, SpotGamma’s TRACE heatmap and HIRO indicator highlighted a developing negative‑gamma zone at the SPX 6830 level, signaling a potential bullish move in the S&P 500. Trader Doug Pless entered a 0‑DTE ES call at $8.10 after bullish options flow confirmed the...

Navigating The Market Gamma Dynamics Amid Record Call Buying And Elevated Risk Taking
Record call buying has driven unprecedented gamma exposure in the equity options market, prompting heightened risk‑taking among traders. The surge in call volume amplifies market makers' hedging obligations, inflating implied volatility and widening bid‑ask spreads. Elevated gamma levels increase the...

Record Highs and Thinning Hedges
The S&P 500 posted its eighth consecutive weekly gain, the longest streak since 2023, while Nvidia (NVDA) delivered a 6% earnings beat but slipped nearly 5% by week’s end. Options data show dealer gamma in NVDA moving from a strong positive...
The AI Trade Roars — But for How Long?
The S&P 500 and Nasdaq have surged 15% and 28% respectively over the past six weeks, driven by an AI‑fuelled rally that has funneled capital into semiconductors and the so‑called Mag 7 stocks. Semiconductor exposure is extreme – the SMH ETF is...

Quiet Indices, Roaring Stocks: The Volatility Dispersion Trade
Robust earnings from the Magnificent Seven and semiconductor leaders have propelled the S&P 500 and Nasdaq to fresh highs while index implied volatility fell to a three‑month low. In contrast, single‑stock volatility remains elevated, creating a pronounced dispersion between index and...

How to Trade the Vanna Rally: Profiting When Volatility Drops
The article explains the Vanna rally, a market move where a drop in implied volatility forces options dealers to buy S&P futures, pushing the index higher regardless of fundamentals. It outlines a four‑step process: identify a short‑Vanna regime via SpotGamma’s...

Vanna and Charm Explained: The Hidden Greeks Driving Market Rallies
Vanna and Charm are second‑order options Greeks that capture how an option’s delta shifts with changes in implied volatility and the passage of time. In the S&P 500, a short‑Vanna environment forces market makers to buy futures as volatility drops, creating...

5 Stocks with the Most Predictable Earnings IV Crush
The article identifies NVIDIA, Tesla, Netflix, Apple and Amazon as the five stocks that consistently experience the sharp post‑earnings implied volatility (IV) collapse known as an IV crush. These high‑growth and consumer‑staple giants see option premiums inflate dramatically ahead of...

Decoding April 23 Market Drop: Hero’s $2 Billion Delta Shift, Trace Map Insights, and Strategic Options Flow Analysis
On April 23 the S&P 500 slipped about 1.2%, a move anchored by a $2 billion delta shift in options on the ticker HERO. SpotGamma’s trace‑map visualized a surge of put buying at key resistance levels, signaling aggressive bearish positioning. The flow...

Mastering Zero DTE with Altos Trading: Unveiling the Golden One Day Options Trade and Market Insights
Altos Trading unveiled a systematic "Golden One Day" options play that targets zero‑days‑to‑expiration (Zero DTE) contracts. The strategy combines high‑probability entry signals with tight risk controls, aiming to capture daily market volatility while limiting capital exposure. Altos provides members with...

Vol Crush Lifts the S&P 500 — Will the Rally Last?
Last week the S&P 500 jumped roughly 3% to 6,800 as implied volatility collapsed, driving a sharp VIX decline. The rally was powered by a “vol crush” that reduced put deltas, prompting dealers to unwind short hedges—a process known as vanna....