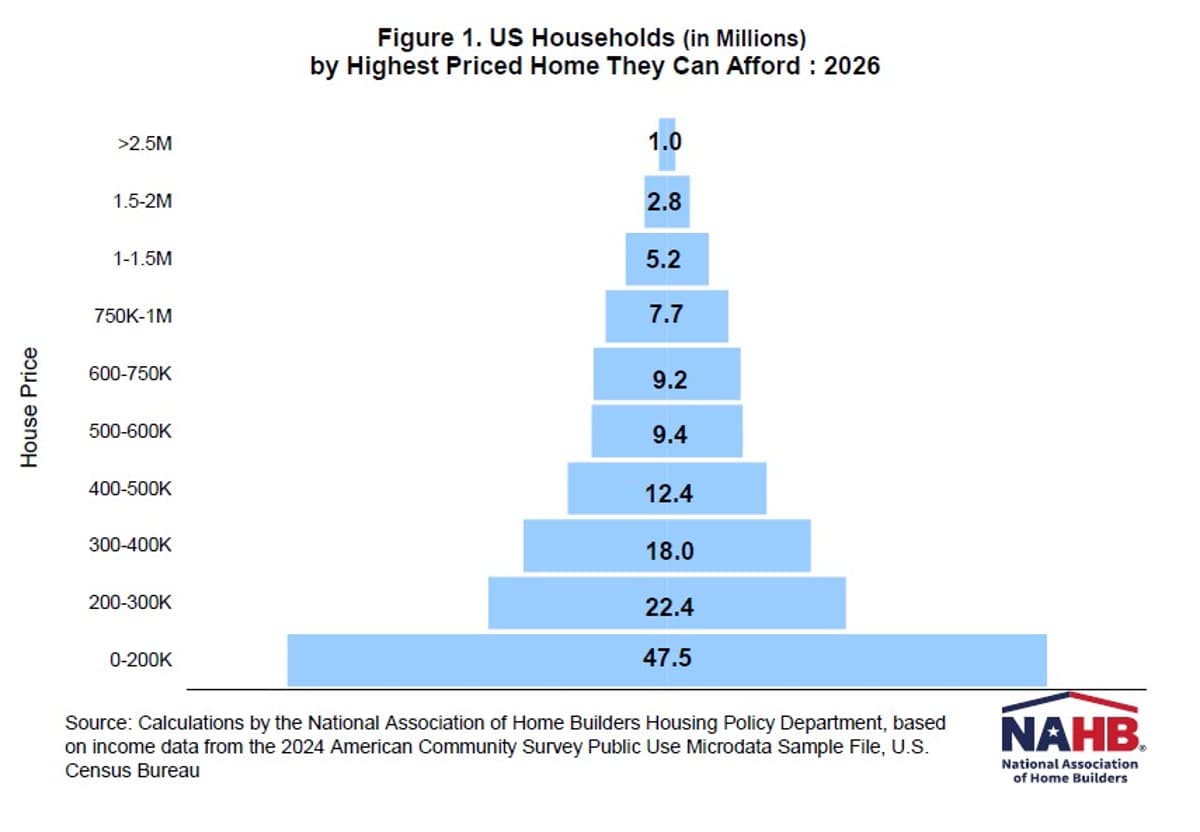
Affordability Pyramid Shows Over Half of U.S. Households Cannot Buy a $300,000 Home
•February 26, 2026
0
Why It Matters
The widening gap threatens home‑ownership rates for middle‑ and low‑income families and pressures policymakers to address supply constraints. Builders and lenders must adapt product offerings to a shrinking pool of qualified buyers.
Key Takeaways
- •52% of U.S. households priced out of $300k homes.
- •Median new home price projected at $410k in 2026.
- •47.5M households can only afford homes under $200k.
- •Supply of affordable homes far below demand in low-price tiers.
- •Affordability gap widens as mortgage rates hover around 6%.
Pulse Analysis
The latest NAHB priced‑out study arrives at a moment when both home prices and borrowing costs are straining the American dream of ownership. While median new‑home values have climbed to roughly $410,000, mortgage rates hovering around 6 % push the required household income for a modest $200,000 purchase to over $55,000. This combination of higher financing costs and limited wage growth creates a structural barrier for many families, especially those in the lower income brackets that already face tighter budgets.
The pyramid visualization makes the affordability gap starkly visible: 47.5 million households can only consider homes priced below $200,000, yet the existing stock in that segment is just over 20 million units. As price tiers rise, the pool of potential buyers shrinks dramatically, leaving only about one million households capable of purchasing homes above $2.5 million. This mismatch not only suppresses transaction volumes in the mid‑range market but also fuels price pressure in the scarce affordable segment, further entrenching the divide between supply and demand.
Policymakers and industry players are now forced to confront the affordability crunch with a mix of short‑term relief and long‑term planning. Expanding credit access, incentivizing the construction of entry‑level housing, and revisiting zoning restrictions could help rebalance the market. Meanwhile, builders are experimenting with smaller footprints, modular construction, and alternative financing models to appeal to the shrinking base of qualified buyers. The trajectory of U.S. housing will hinge on how quickly these interventions can close the gap between household income and home prices.
Affordability Pyramid Shows Over Half of U.S. Households Cannot Buy a $300,000 Home
0
Comments
Want to join the conversation?
Loading comments...