Indicator of the Day (Video): DOW Intermediate Term Breadth Momentum Oscillator
Key Takeaways
- •ITBM tracks intermediate‑term breadth momentum across Dow‑listed stocks.
- •Divergence between ITBM and S&P 500 signals possible market turning points.
- •Indicator helps traders refine entry/exit timing beyond price trends.
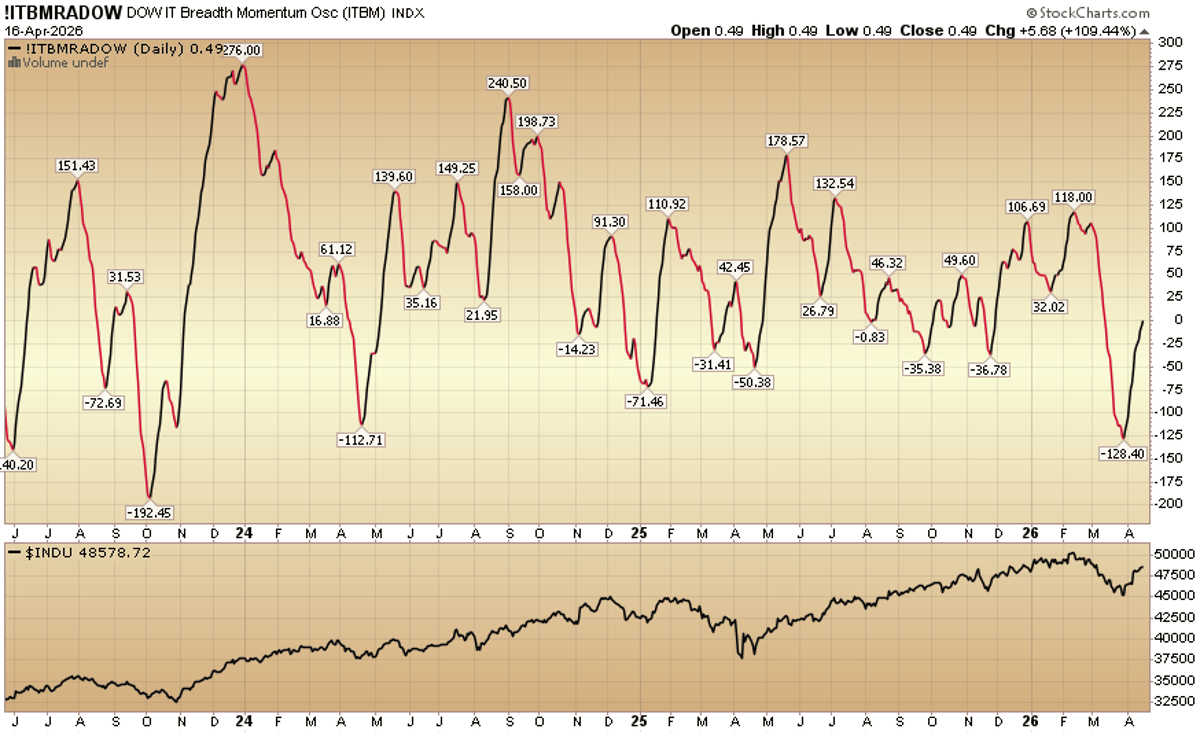
- •Visual chart covers April 2024‑April 2026, highlighting key momentum swings.
Pulse Analysis
Breadth momentum oscillators measure the net direction of advancing versus declining stocks, offering a lens into market health that pure price indices can miss. The DOW Intermediate Term Breadth Momentum Oscillator (ITBM) focuses on a 3‑ to 6‑month window, smoothing short‑term noise while still reacting quickly enough to catch emerging trends. By aggregating the daily breadth of all Dow‑component equities, the ITBM provides a composite signal that reflects collective investor sentiment, making it especially useful for gauging the sustainability of a rally or the depth of a correction.
The recent chart spanning April 2024 to April 2026 illustrates several notable divergences: when the S&P 500 surged, the ITBM occasionally lagged, suggesting that the rally was driven by a narrower set of heavyweights rather than broad market participation. Conversely, periods where the ITBM rose ahead of the index often preceded modest up‑turns, indicating that widening participation was building momentum. Compared with traditional tools like the Advance‑Decline Line or the Relative Strength Index, the ITBM’s intermediate focus balances responsiveness with stability, reducing false alarms while still flagging meaningful shifts.
Traders can integrate the ITBM into multi‑factor models, using it as a confirmation layer alongside price‑action patterns or macroeconomic data. For example, a bullish crossover of the ITBM paired with improving earnings forecasts may justify a position increase, whereas a bearish divergence could trigger defensive rebalancing. However, users should remain aware of its limitations: the indicator reflects only Dow‑listed stocks, which may not capture the full market breadth, and extreme market events can temporarily distort its signal. Overall, the ITBM adds a nuanced, data‑driven perspective for investors aiming to anticipate market turns before they become evident in price alone.
Indicator of the Day (video): DOW Intermediate Term Breadth Momentum Oscillator
Comments
Want to join the conversation?