
FTSE100 Stuck Sideways, Bullish
#FTSE100 doji Candle and Sideways for ages. Resistance 10557, 10683, ATH 10935. Support 10279, 10152, 10000. RSI 53 near Neutral. 13/21 day EMAs Bullish. Doji Candle on Weekly. Top Bollinger Band 10580. Midpoint Line 10402. Bottom Band 10223.
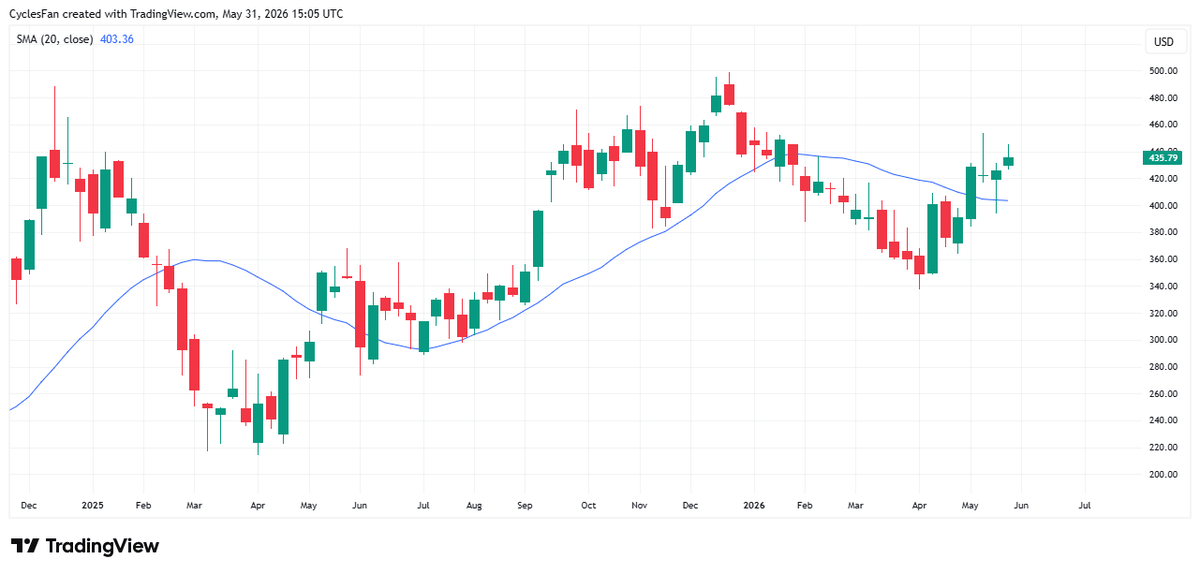
Tesla Eyes $
$TSLA - Despite the choppy action we saw in the last 3 weeks it still has a bullish structure that is likely to lead to a continuation of the rally to the all time high at 499. That will change...
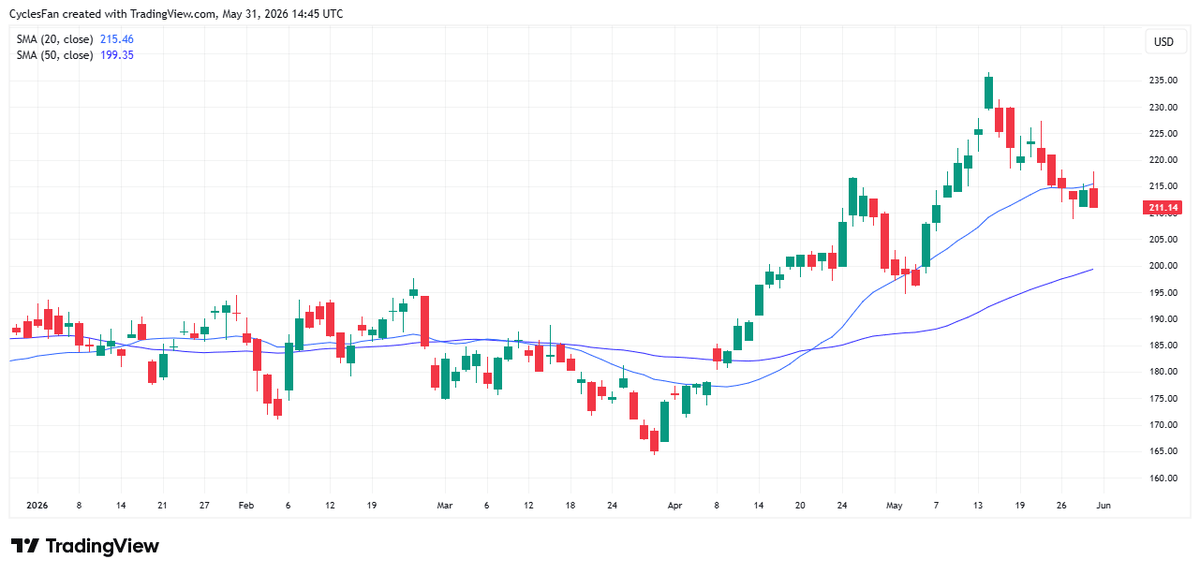
NVDA Needs 20‑Day MA Recovery or Slides to $200
$NVDA - Closed below the 20 day MA on Wednesday and failed to regain it on Friday. Unless it regains the 20 day MA tomorrow the next downside target would be the 50 day MA around $200. https://t.co/hyIzzCrg9a
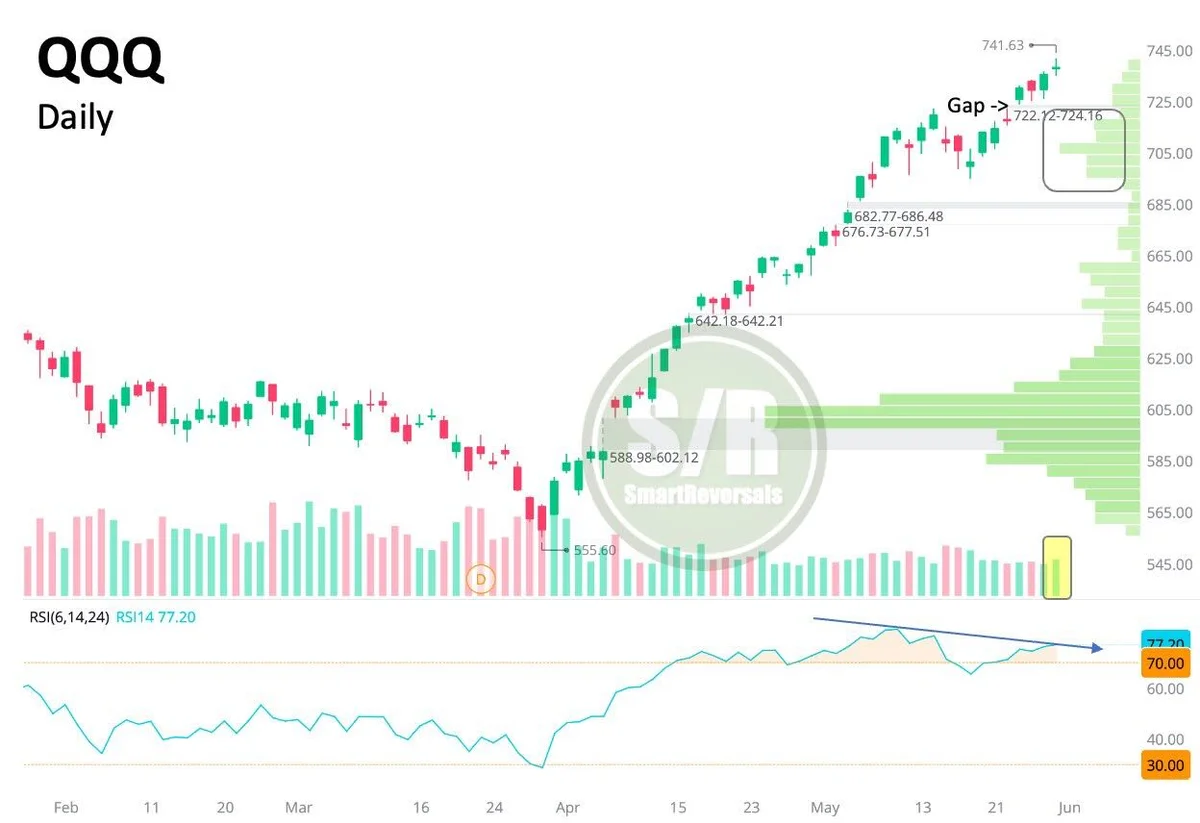
QQQ Likely Consolidates Amid Overbought Divergence and Gap
#QQQ: Indecisive daily price action, an overbought RSI divergence, and a gap sitting below at $722. With no major geopolitical news fueling the tape this weekend, a consolidation or a pullback is highly possible here. The volume shelf is a...
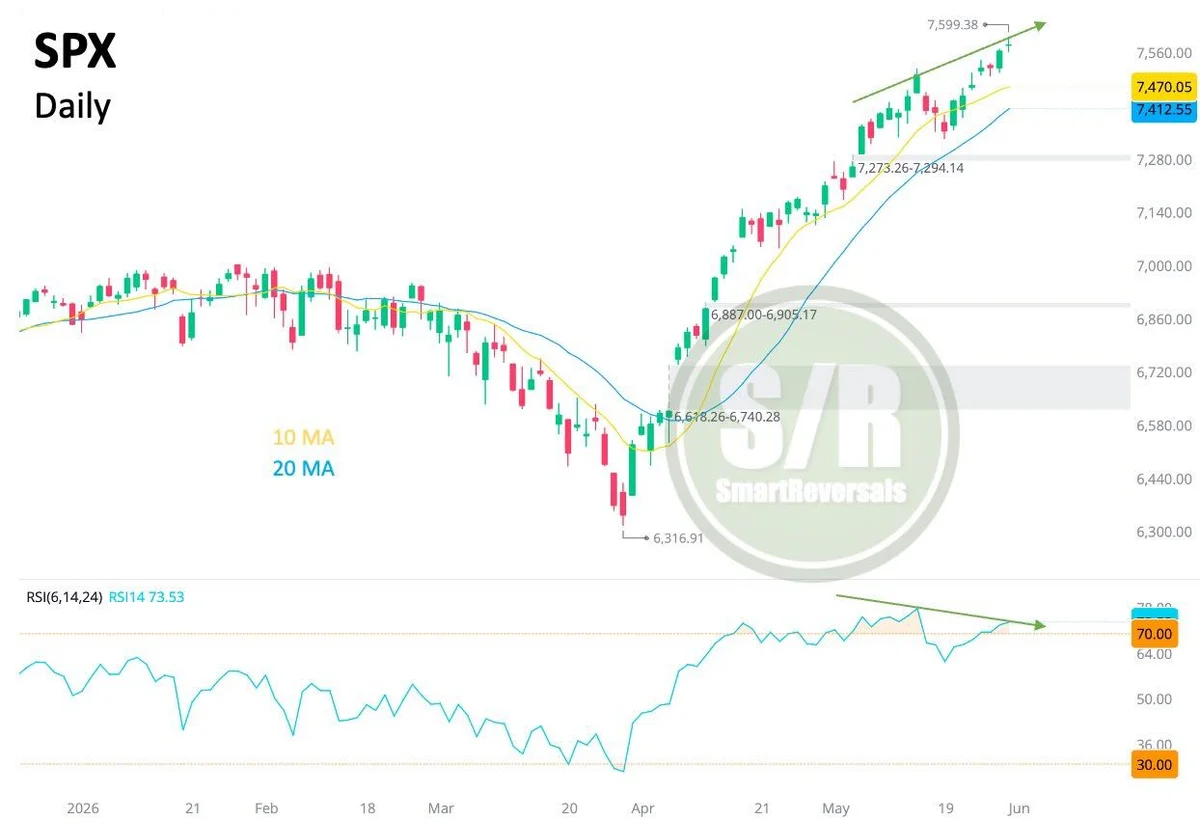
SPX Shows Bearish RSI Divergence Amid Overbought Doji
#SPX: Indecisive price action again (doji), printing a bearish RSI divergence with both peaks locked in overbought territory. Will weekend news arrive to fuel momentum again, or is the market simply widening this structural divergence before a pullback?

Patience and VWAP Strategy Secured a 10‑Point Win
📉 This trade almost got cut before the move happened. Real-time futures trading using VWAP, LVNs, and price behavior around the lower band. Patience paid off with a clean 10-point winner. See exactly how I manage stops, scale out, and avoid sabotaging...
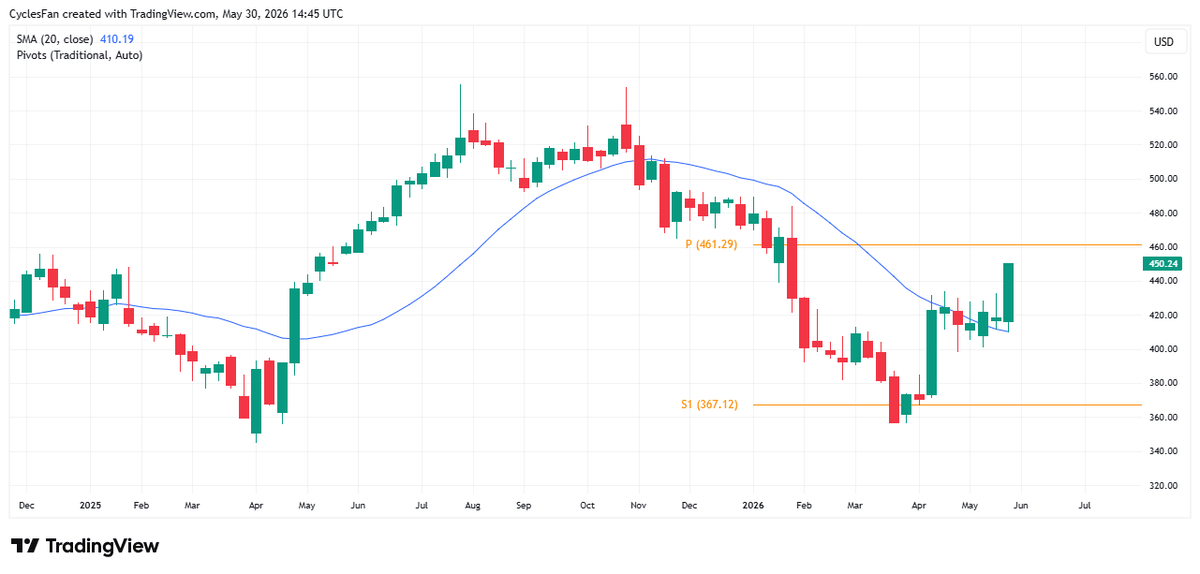
MSFT Needs 461 Close to Avoid Low Retest, Target 555
$MSFT - As anticipated in my last post, the rally off the March low gained traction this week and the stock is headed to the yearly pivot at 461. It needs a weekly close above 461 in order to rule...
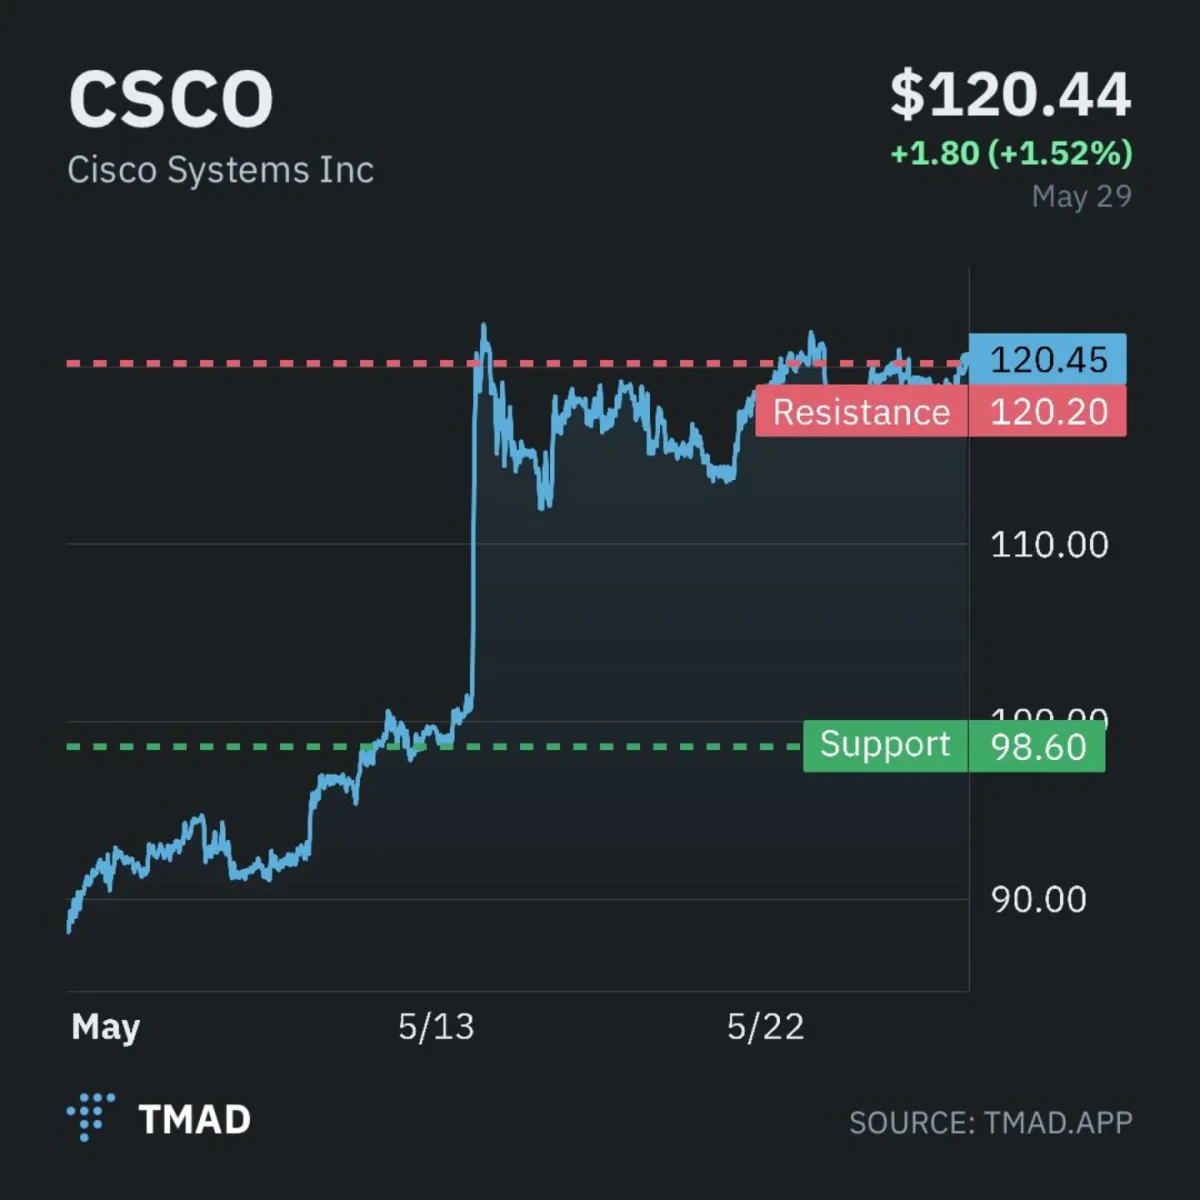
Cisco Poised for Breakout Above $120, Bullish Momentum
$CSCO — BATTLE for the $120 level ⚔️ Bulls and bears fighting hard here, but the chart still looks constructive 👀 Holding strength while momentum stays intact is exactly what you want to see. A clean breakout above $120 could open the door...
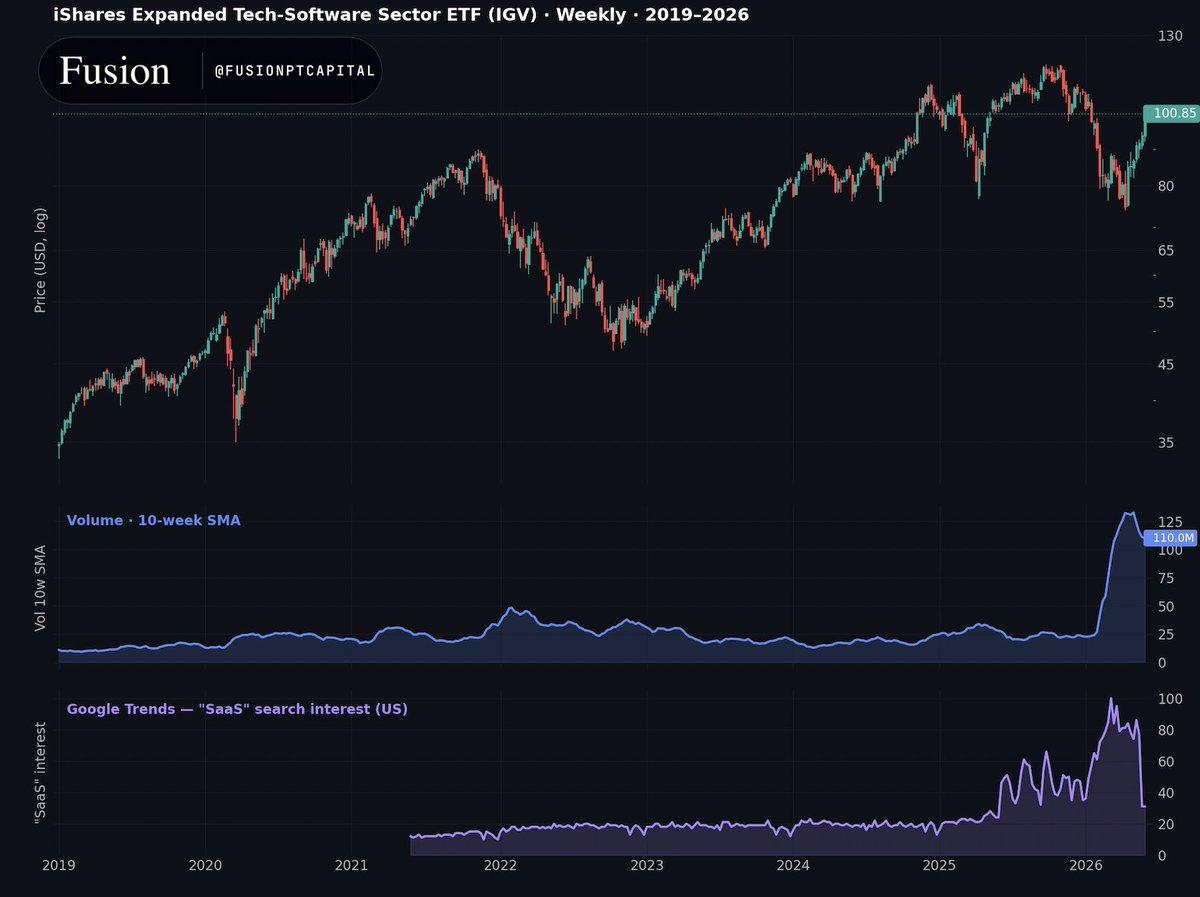
IGV Volume Spikes 100M as SaaS Interest Soars
Small pt but you can look for ST clues to countertrend and prob find a bunch of false ones (you will) but def helps when larger wave is at least behind you when you see them. 10 week SMA on $IGV...

Dell Opens July 350 Puts, Closing May Strangles
$DELL sold to open 4x July 350 puts to buy to close May 29 Exp strangles
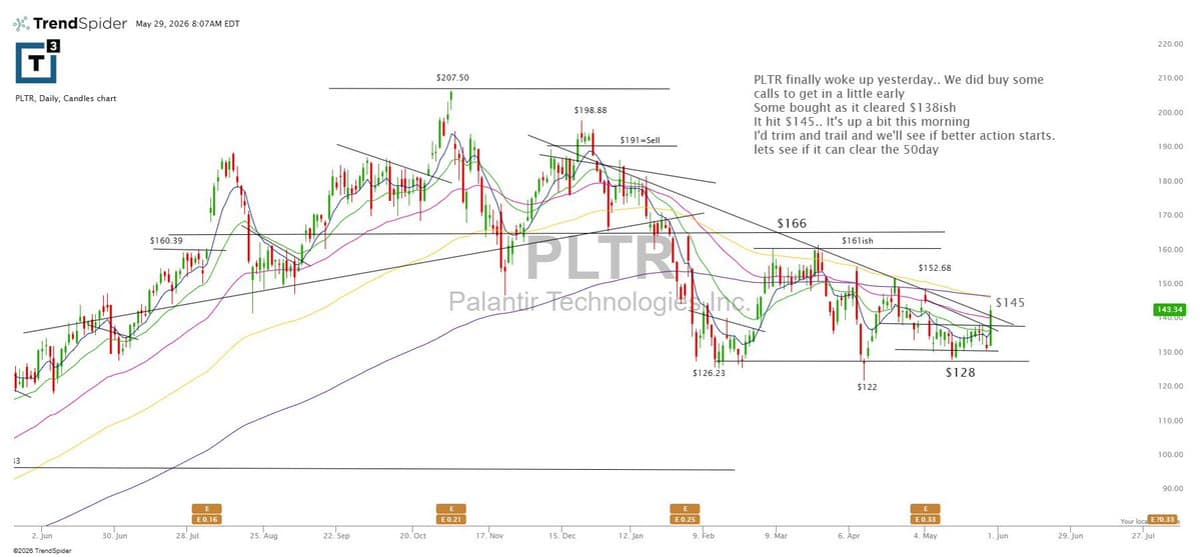
Pltr Offers Strong Entry, Follow‑through; Still Upside
$pltr gave us a great entry and nice follow thru today to trim. Has room https://t.co/WUe4xiG3QJ
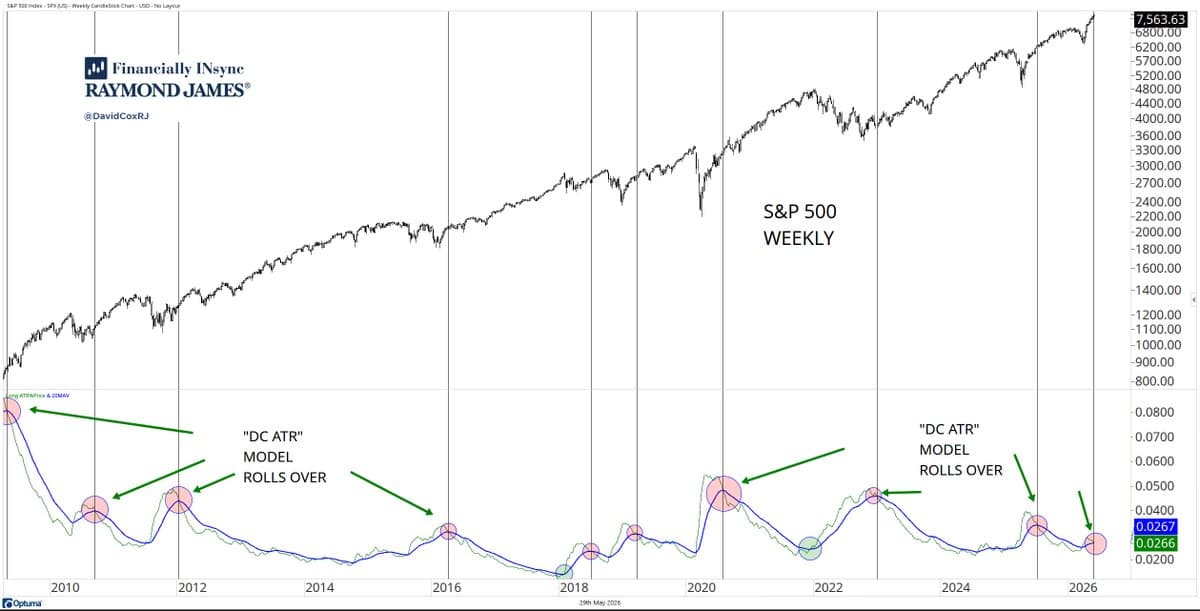
Model Rollover Hints at Upcoming S&P 500 Uptrend
my #DCATR S&P 500 $SPX model is rolling over this week so i've added another vertical line... this typically happens in front of bigger-picture new uptrends that are beginning... https://t.co/0CEEHRtkPj

Buy Precious Metals Above 4366, Target 4700
Precious metals recover, respecting 4400 Elliott level. Key: 4400 support / 4366 invalidation. Risk: near-term ABC retrace. Insight: initiate long above 4366, target 4700, stop below 4366. 📈 — Viktor Kopylov, PhD, CFA. More insights: t.me/si14Kopylov
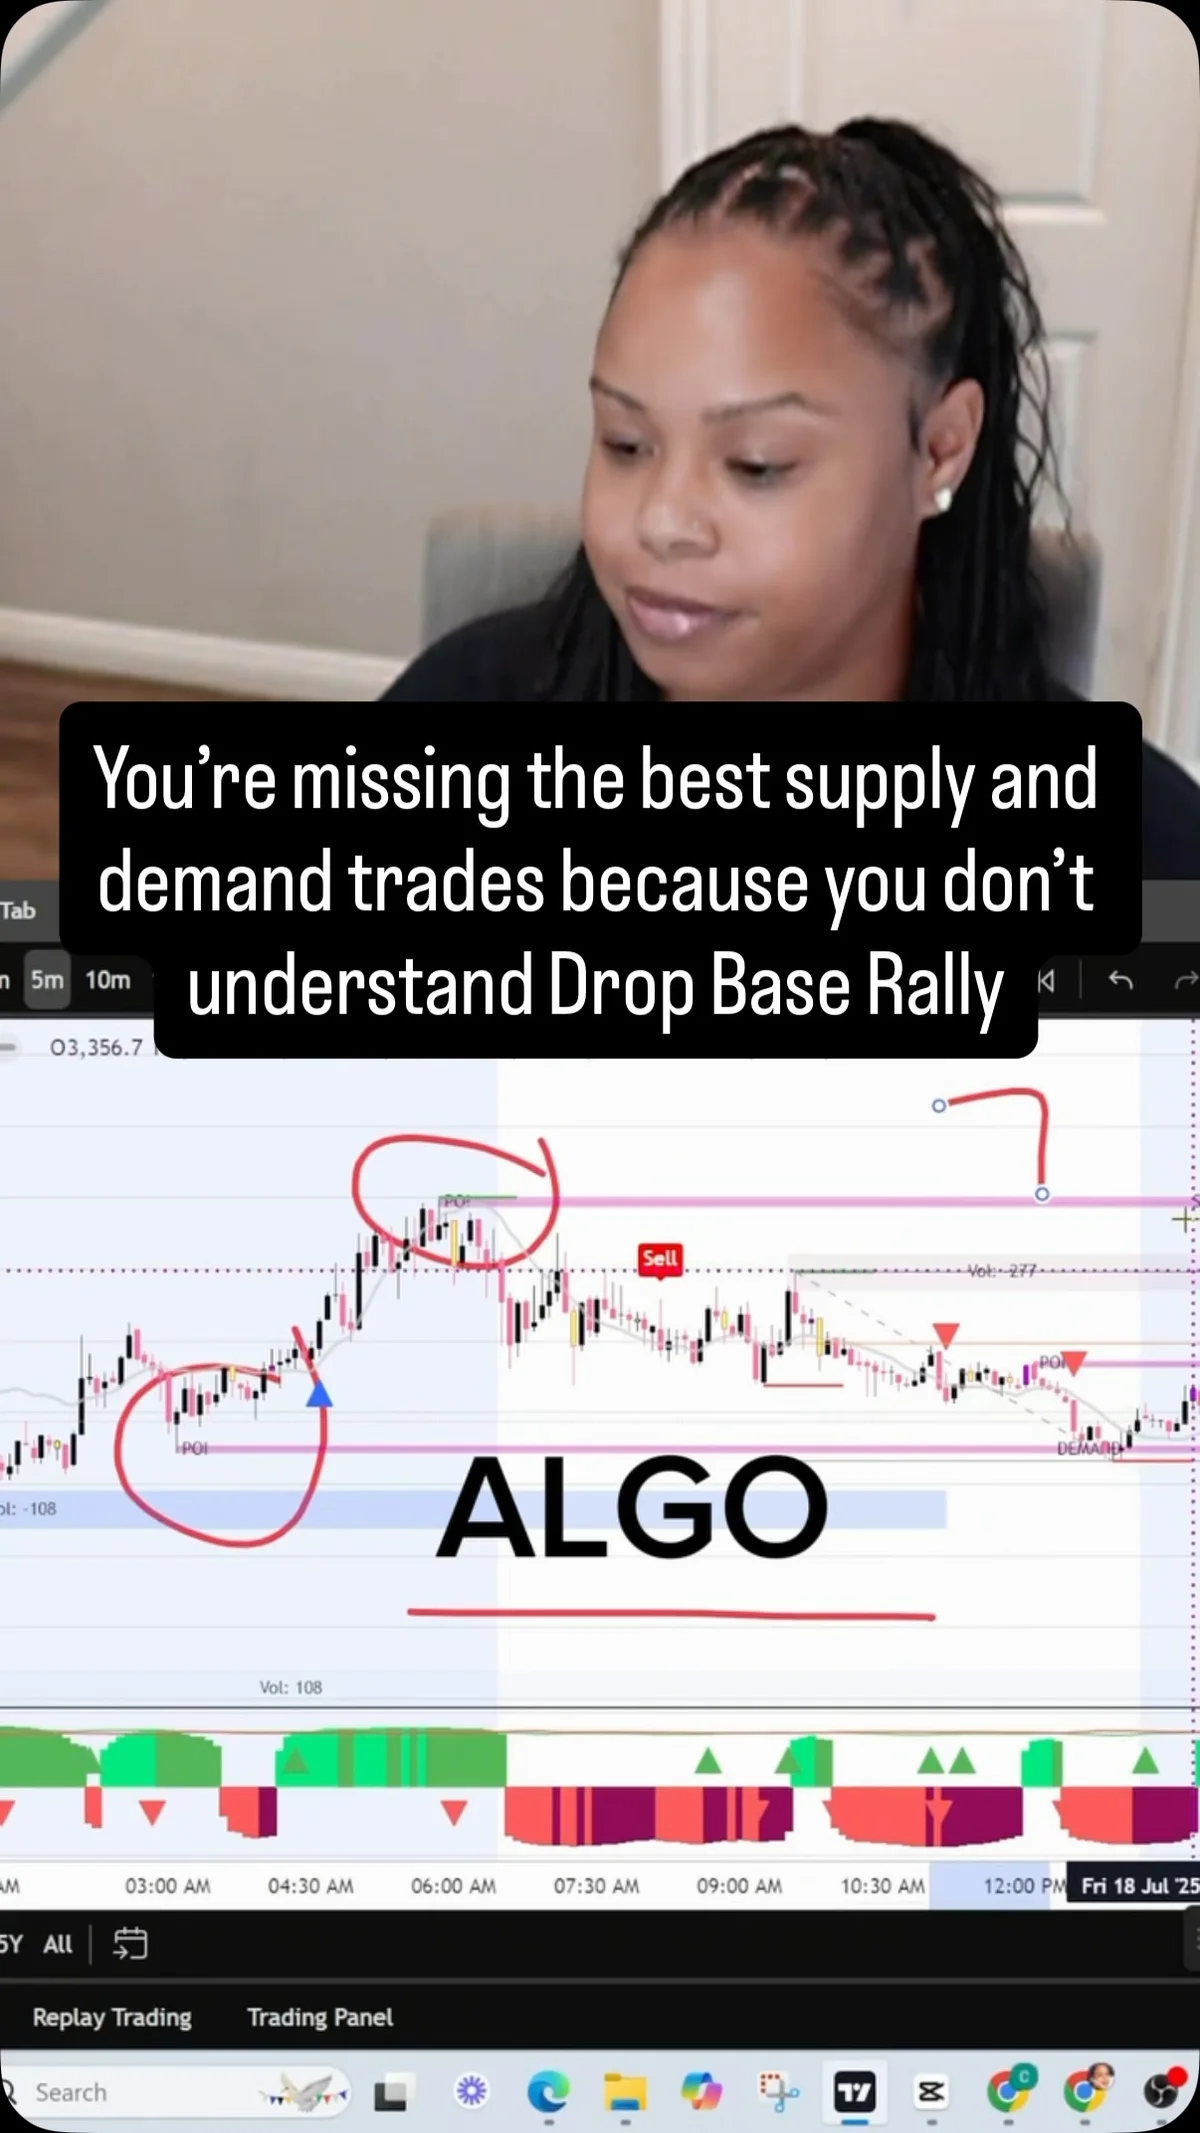
Wait for Drop‑Base Rally to Return for Higher‑Probability Trades
Drop Base Rally is one of the strongest demand zone patterns in trading. Price drops, forms a base, then rallies aggressively showing buyers stepped into the market. Most traders chase the move after it leaves the zone. The higher probability trade...
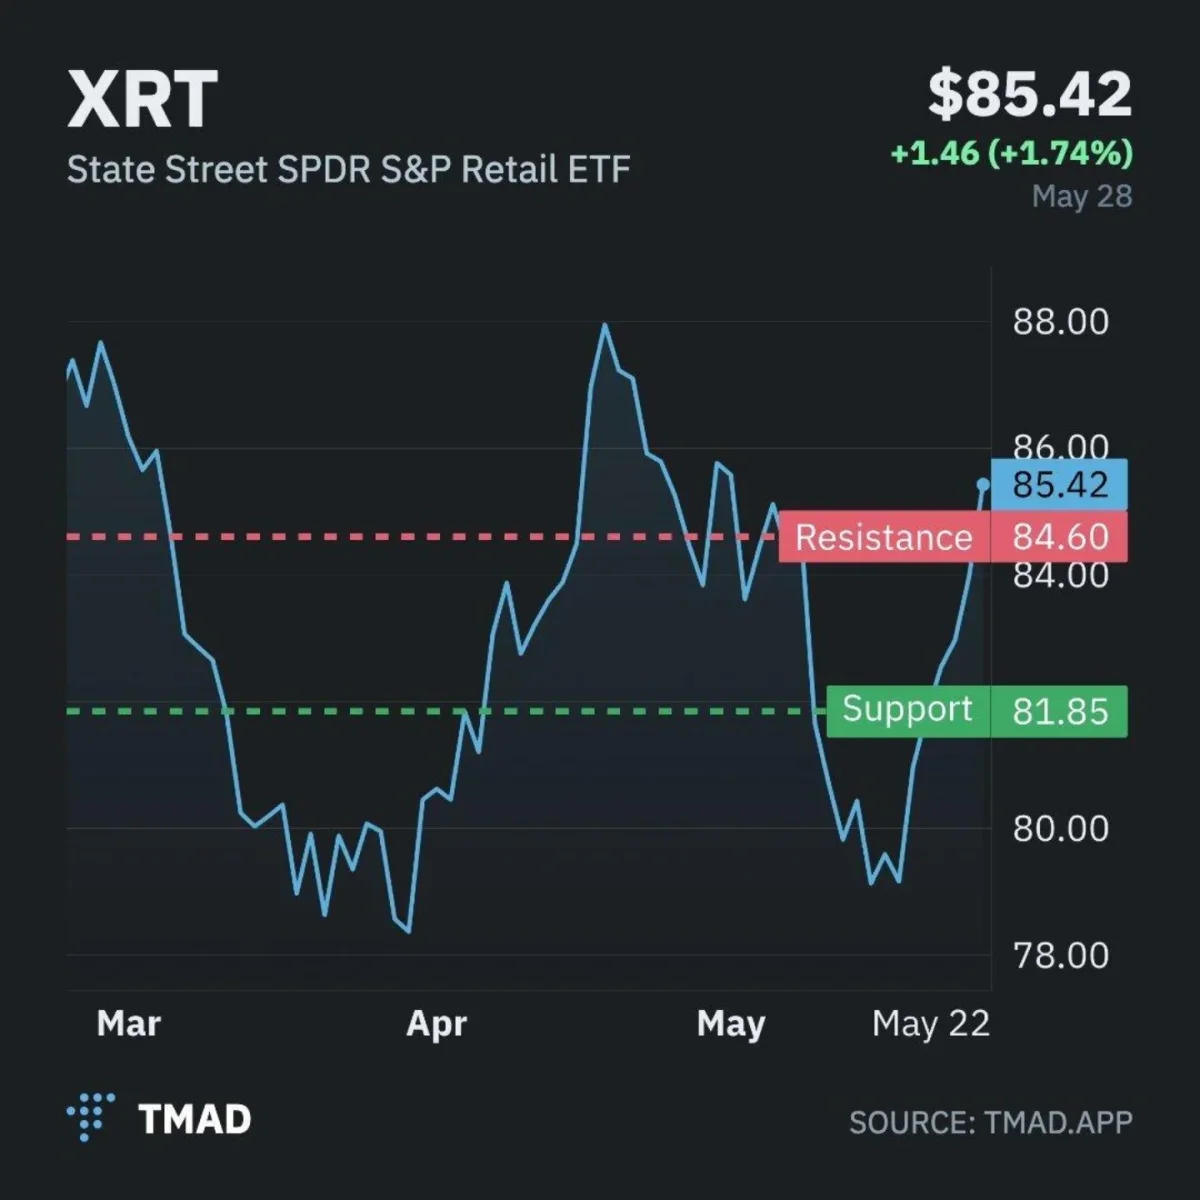
Retail Momentum Ignites as XRT Breaks $85, Bitcoin Stagnant
Retail is waking up. $XRT just cleared $85 resistance and the tape is starting to light up. Multiple names in the sector are flashing CALL SURGE + heavy RVOL on our app. Smart money is positioning early. This is where momentum starts. Quietly....