Skip the First 15 Minutes, Trade With Confirmation
STOP trading the first 15 minutes 🚫 That’s where most traders get chopped up and lose. Wait for structure. Wait for confirmation. That’s where the edge is 📊 👇 Comment “SETUP” and I’ll send you the guide #TradingTips #VWAP #TraderLife
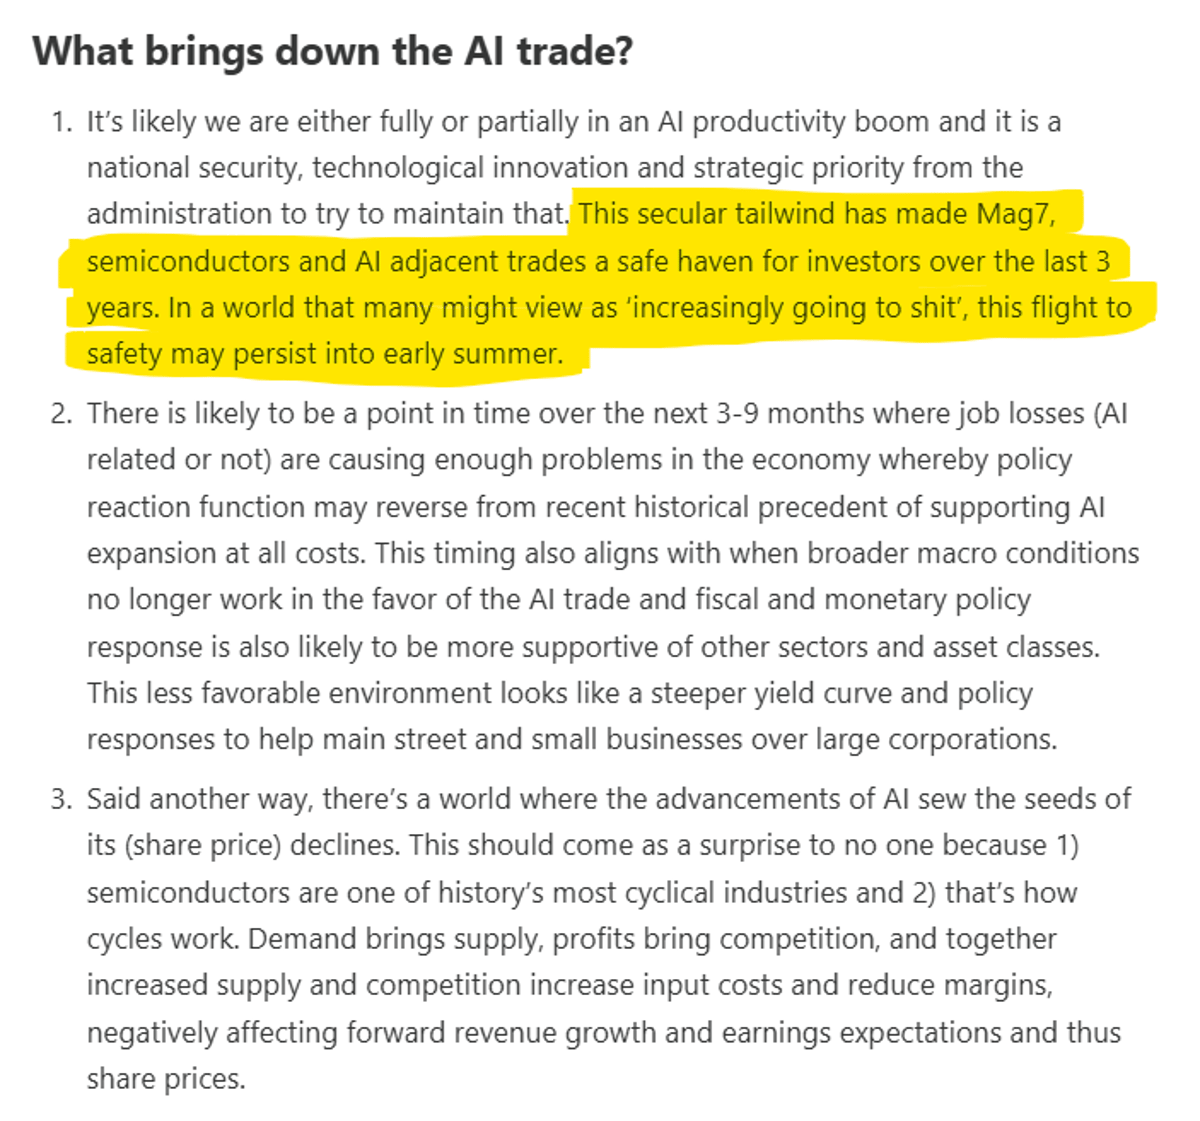
Expect Early Summer Mean Reversion in Mag7 Semis
While we were using Mag7 and semiconductors as funding shorts earlier in the year, a few weeks ago we wrote about a possible mean reversion trade into early summer. https://t.co/7fSZ0NNFXM
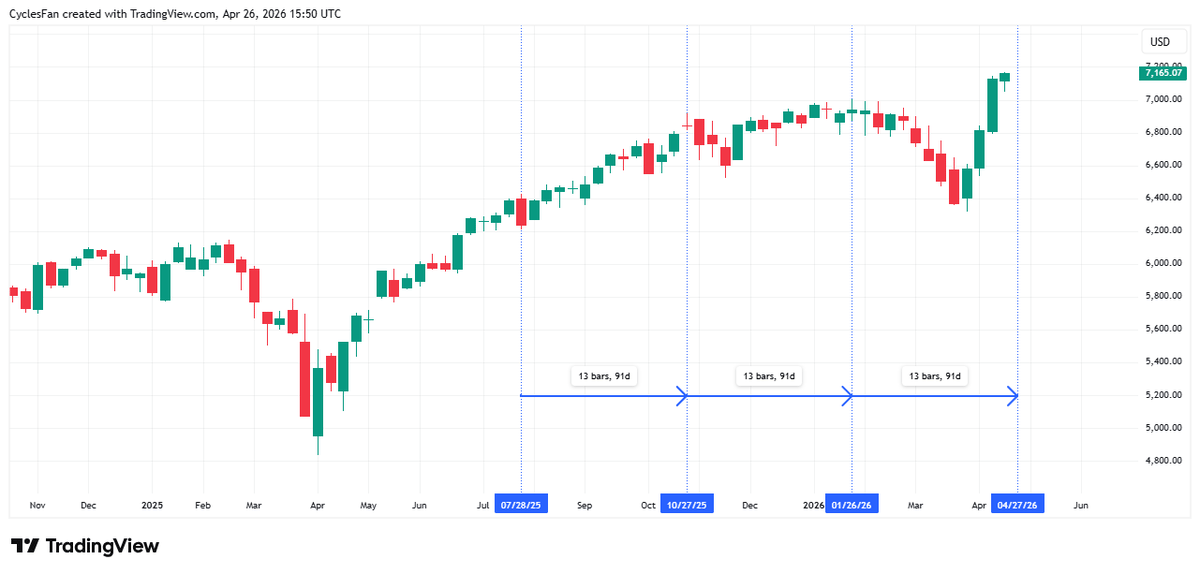
SPX Hits 13‑week Cycle, Expect Sector Rotation, Down Week
$SPX has made some sort of top every 13 weeks since July, whether it's a short term top like in July, or a multi week top like in January. We may see another one next week. I expect rotation, semi...
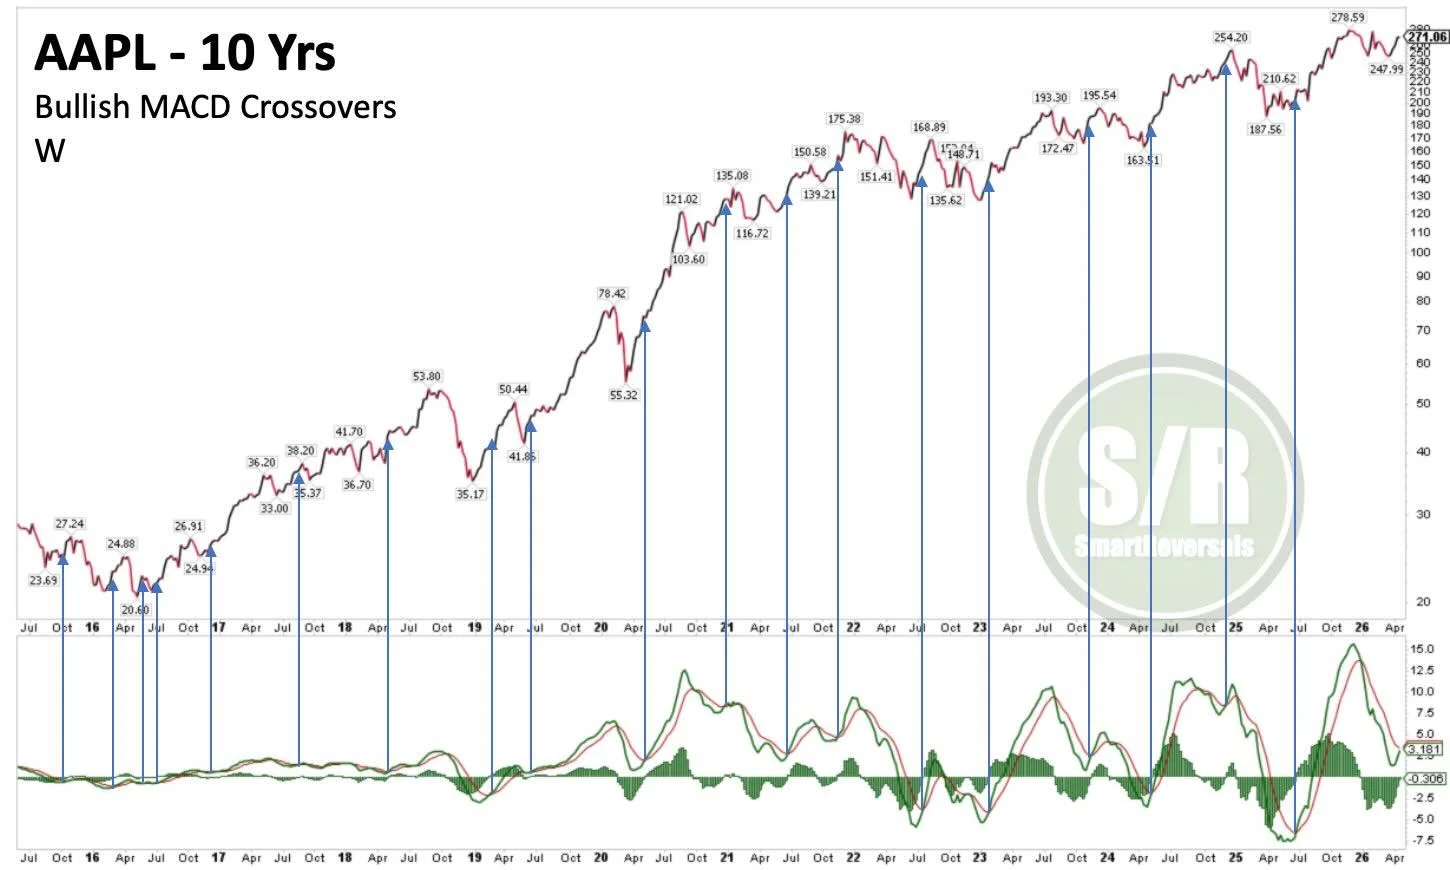
Apple MACD Bullish Crossover Signals Potential 5% Rise
AAPL: Weekly bullish MACD crossovers usually precede average moves of +5% within three weeks. With earnings scheduled for this Thursday, the week is key to confirm the signal, currently brewing.
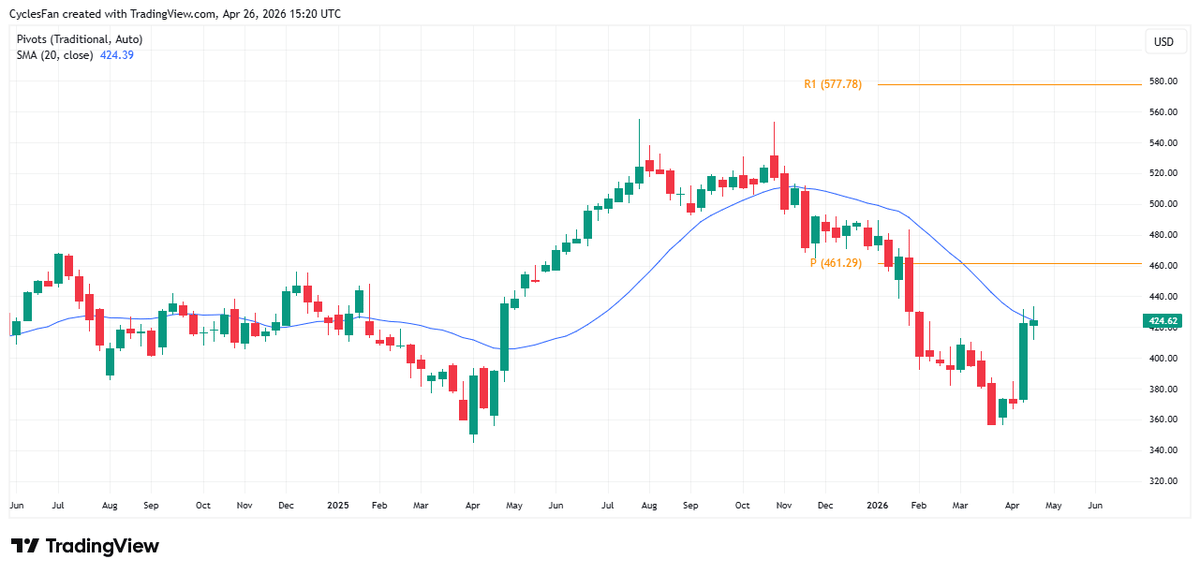
MSFT Expected to Break 20‑Week MA, Target 461
$MSFT - Despite the 4 week rally it has not confirmed an intermediate term low yet since it has to regain the 20 week MA to do that, but I expect it to be confirmed next week and the rally...
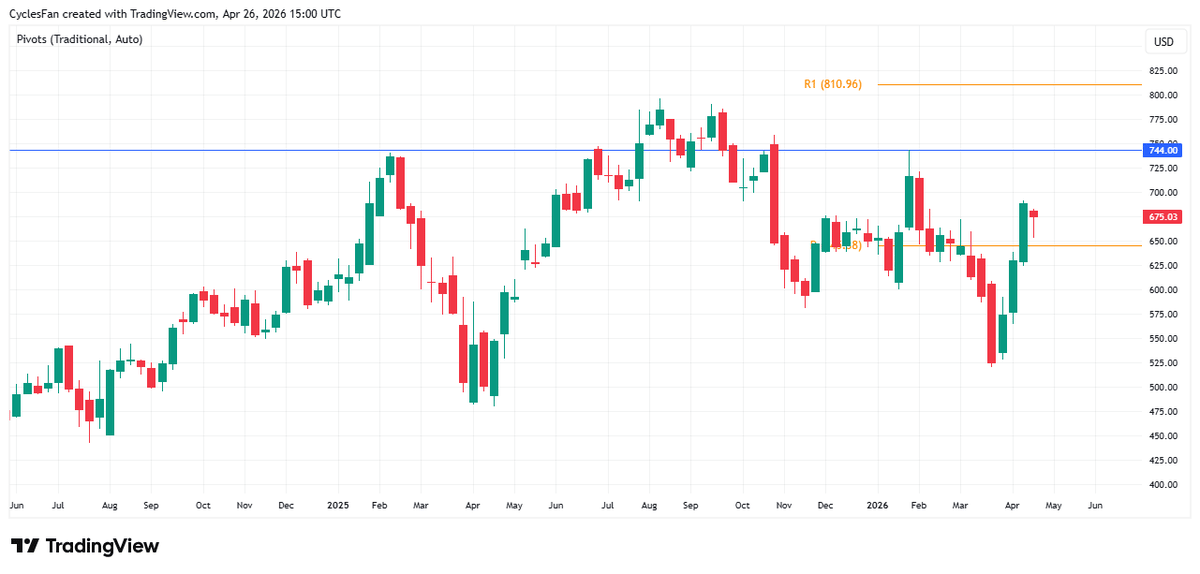
Meta's Earnings Decide Rally to 744 or Drop Below 645
$META - Unlike most tech stocks it closed the week down. Earnings on Wednesday will determine its next move: continue the rally to the next resistance at 744, or give back some of the gains it made in the last...
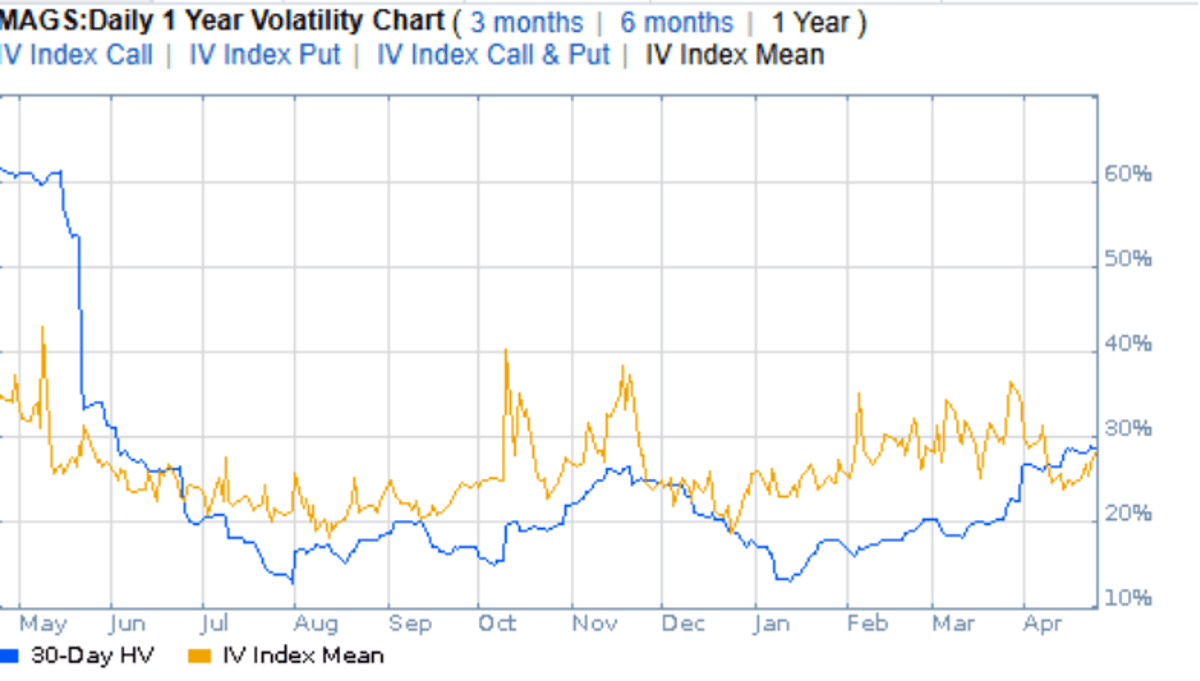
MAGS Implied Volatility Drops Below Historical Levels Ahead of Earnings
Coming into a big week of Mag 7 earnings, $MAGS implied volatility is low at 28%.. finally back below its historical/realized volatility @seekingalpha https://t.co/Sn2hdW5zUN https://t.co/vHayAb3ZUZ
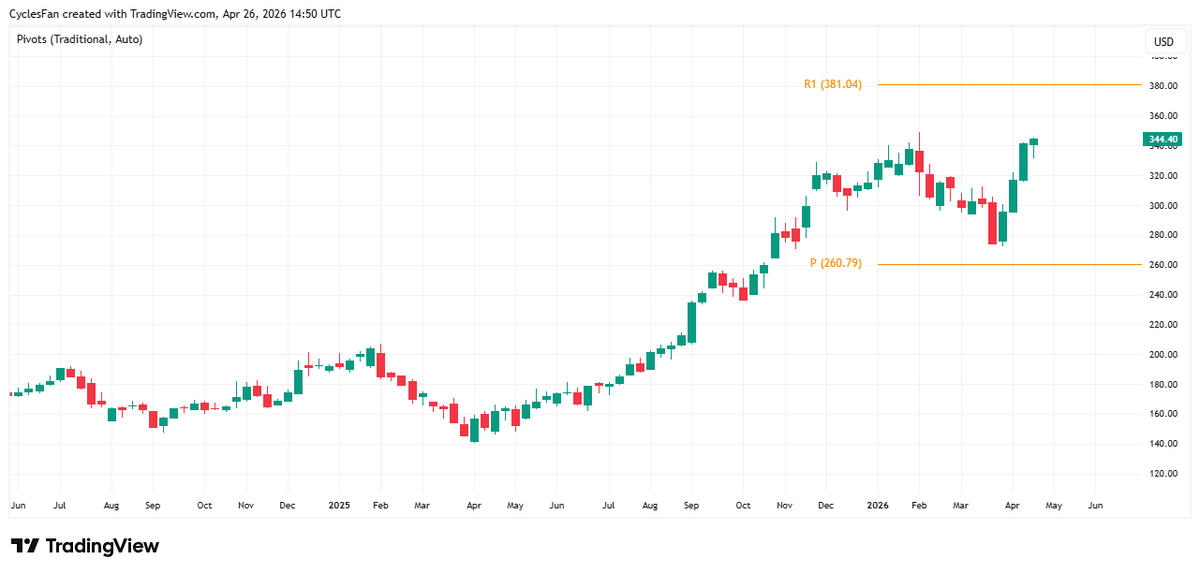
Google Near ATH; Earnings Decide Breakout or Pullback
$GOOGL - Up 4 weeks in a row and almost back to the ATH at 349. Earnings on Wednesday will determine if it breaks out and heads to the 1st yearly resistance at 381, or gives back some of the...
Patience Beats Early Entries: Discipline Drives Winning Trades
Discipline defines everything in trading. If you enter early → you lose. If you wait → you win. CHOCH + Inducement + OB = Precision entry. Follow for real setups. #ForexTradingLife #SMCConcepts #ICTReels #TradingDiscipline #reels
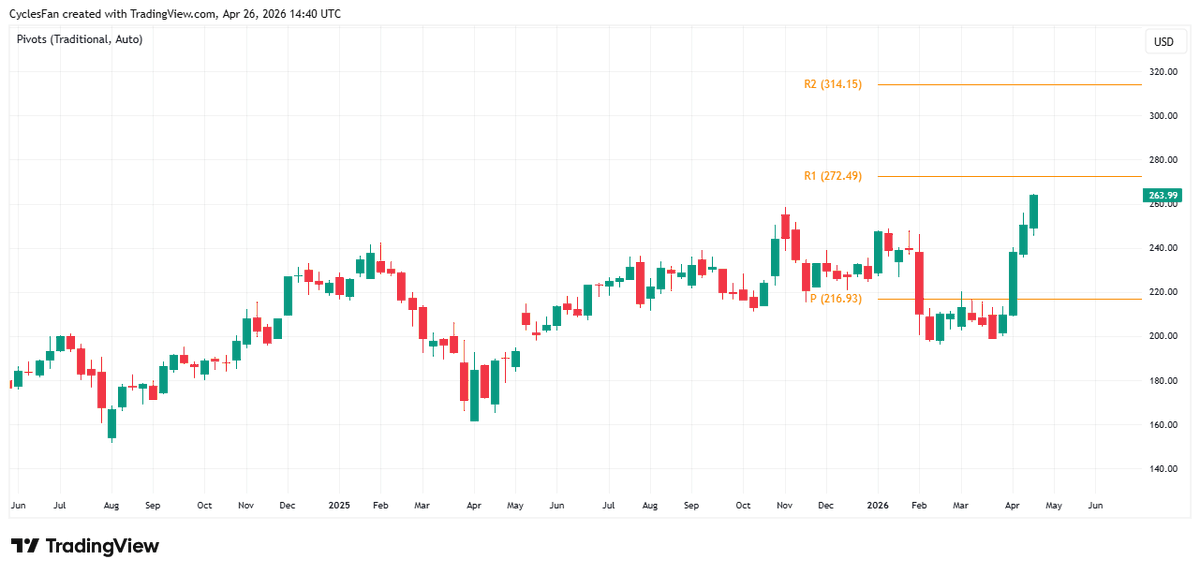
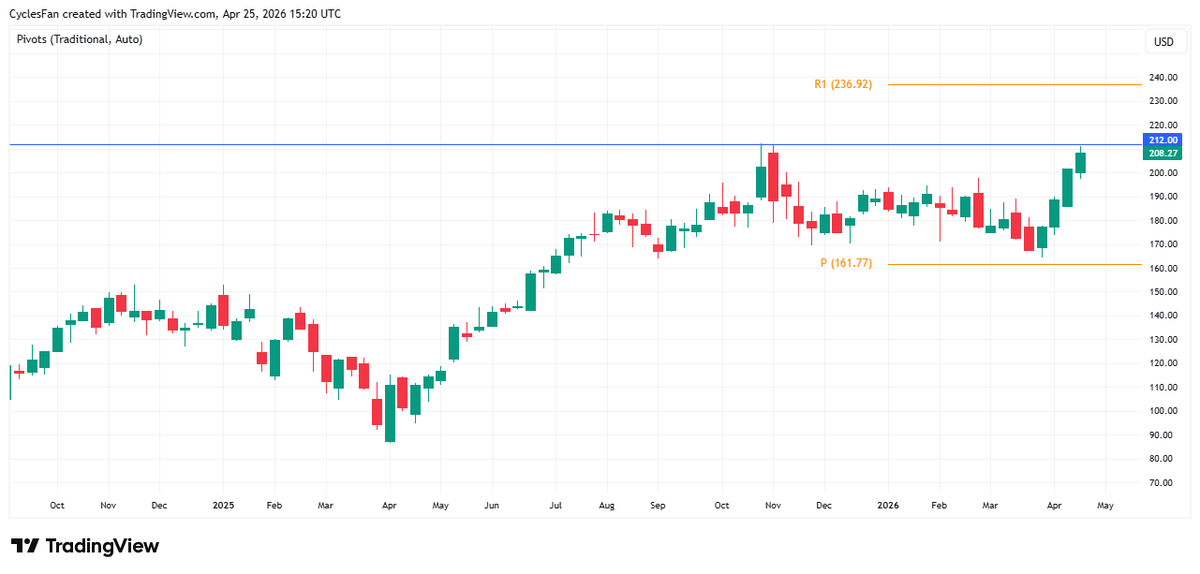
Amazon Hits New ATH; Watch 272 Pullback
$AMZN - The 1st MAG 7 stock to make a new ATH this week. The next upside target is the 1st yearly resistance at 272. A weekly close above 272 will lead to the 2nd yearly resistance at 314, but...

Nifty Histogram Signals Wave 2 Pullback; USDINR Weakens
Nifty Histogram signal - A wave 2 pullback - USDINR is the weak link - I... https://t.co/V8f9CQAFPA via @YouTube
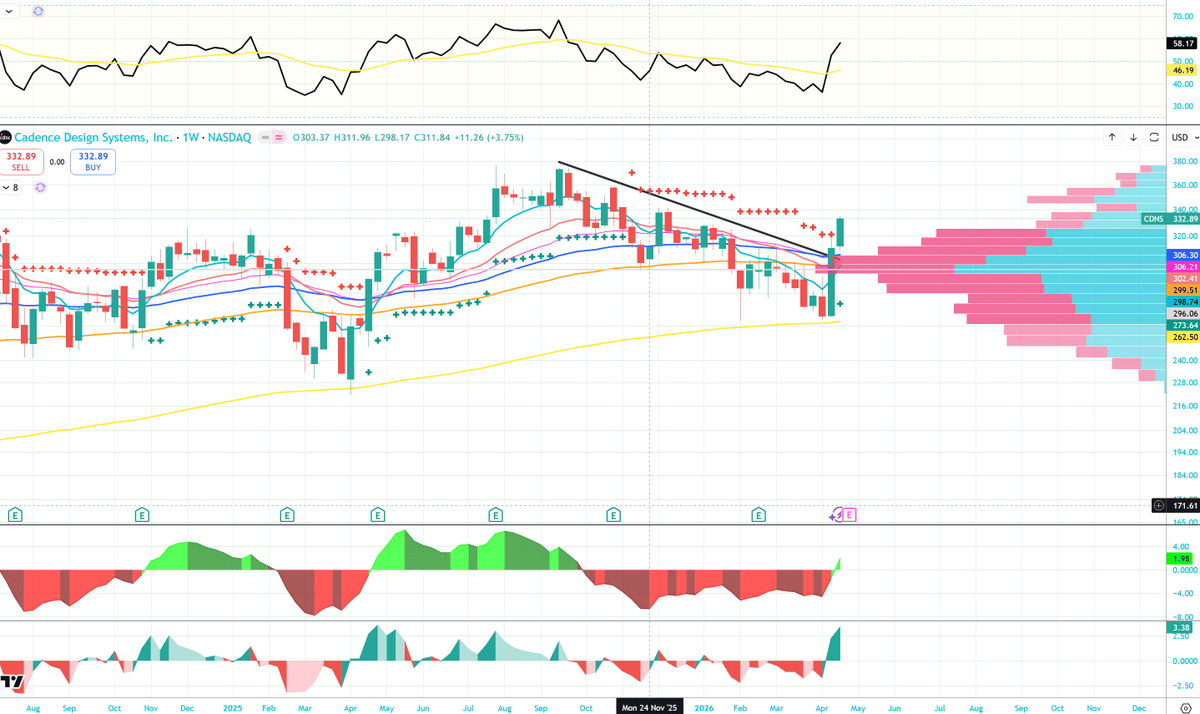
CDNS Shows Bullish Trend Ahead of Earnings
$CDNS reporting Monday night, trend-inflection triggered the week before last, MACD went bull, 6K Aug. 400 calls bought 4/21, size June $290 and $300 calls bought in OI, member write-up on 3/10 https://t.co/msFif2WBqo

New Put/Call Histogram Enhances Timing Precision
This weeks session adds an additional timing indicator for perfection - the Put/Call Histogram on StrikeMoney
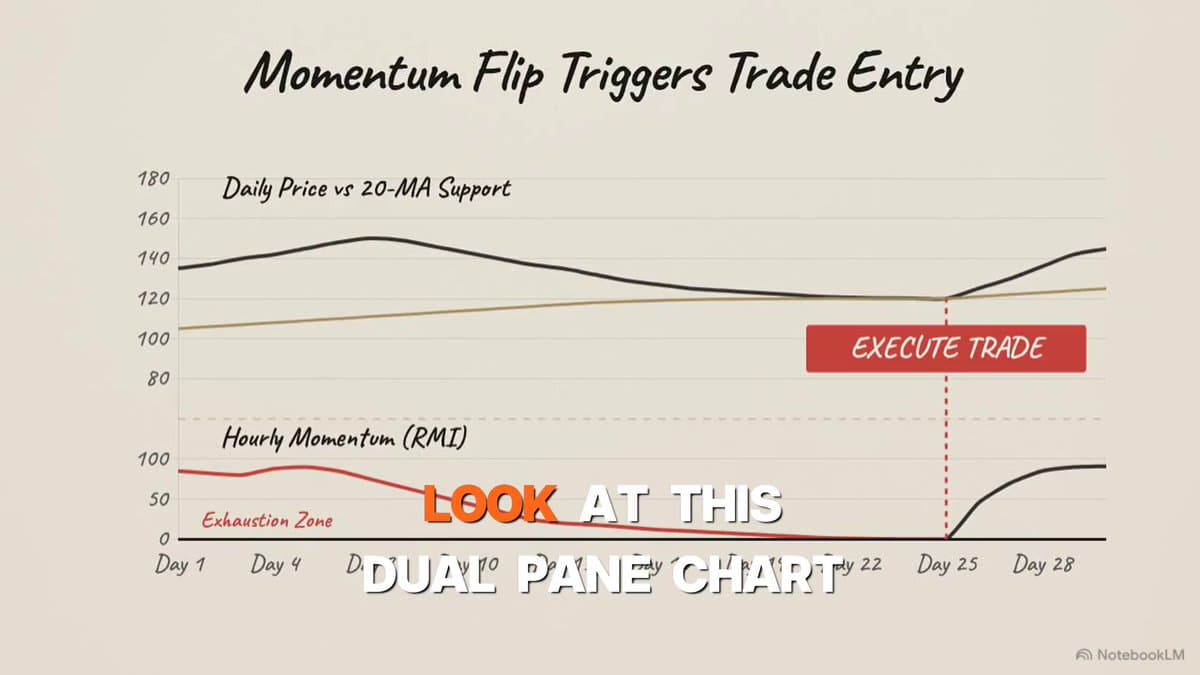
RMI: The Ultimate Repeatable Momentum Indicator
The RMI is the best measure for momentum trading we have developed, based on our multi-time-frame execution process, which is repeatable across time frames and securities. Once you understand and master this, there is no looking back. Get the RMI...

Learn to Trade by Doing, Not Just Watching
Real trading is learned by actually trading. - Educational videos won't make you profitable. - Psychology books will make you confident. Take $100. Then trade risking $1 per position on the 1 minute chart. Learn to journal, learn to read price action, learn to follow...
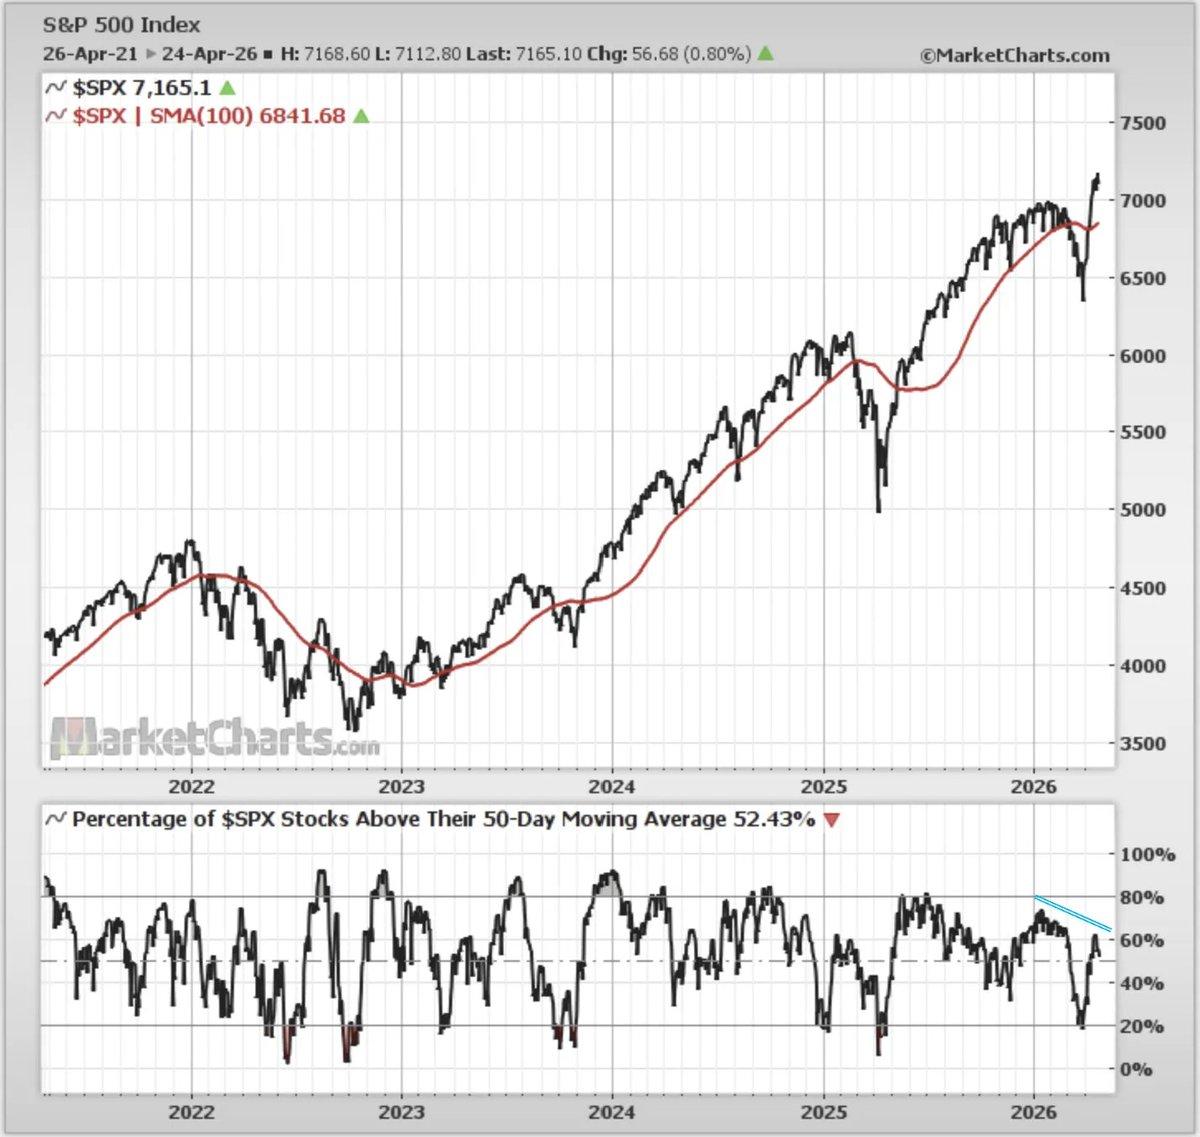
Weekly S&P 500 Overview: Tech, Cyclicals, Global Growth
Weekly S&P500 ChartStorm https://t.co/E8W2wyPwfe This week: technical check, seasonality snippets, fund flows, semiconductors, market froth at the top, cyclicals, global growth, emerging market equities... https://t.co/VkeqMQTomr
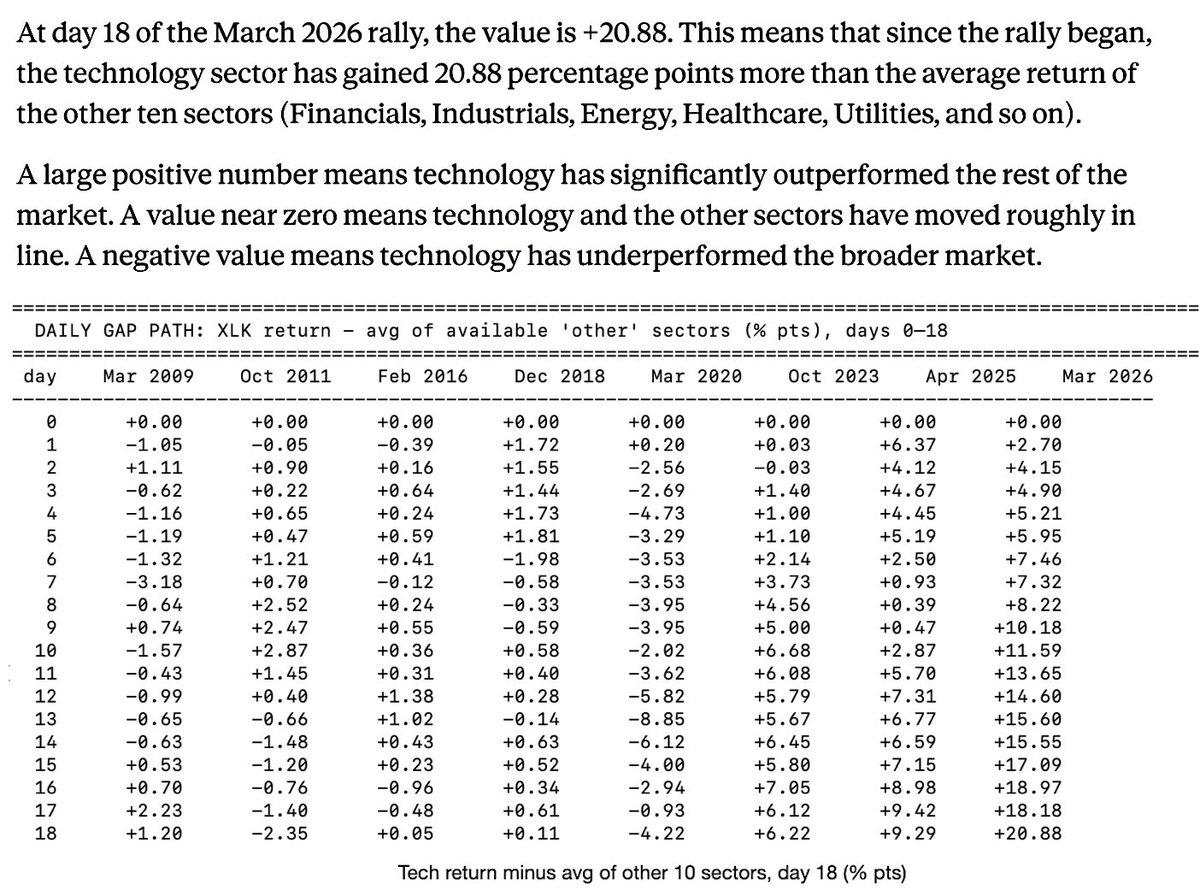
Tech Surges: Day 18 Outperforms Since 2009
Here's the magnitude of the tech outperformance on day 18 relative to past lows including '09 $ES_F $XLK https://t.co/H2qomw2O5h
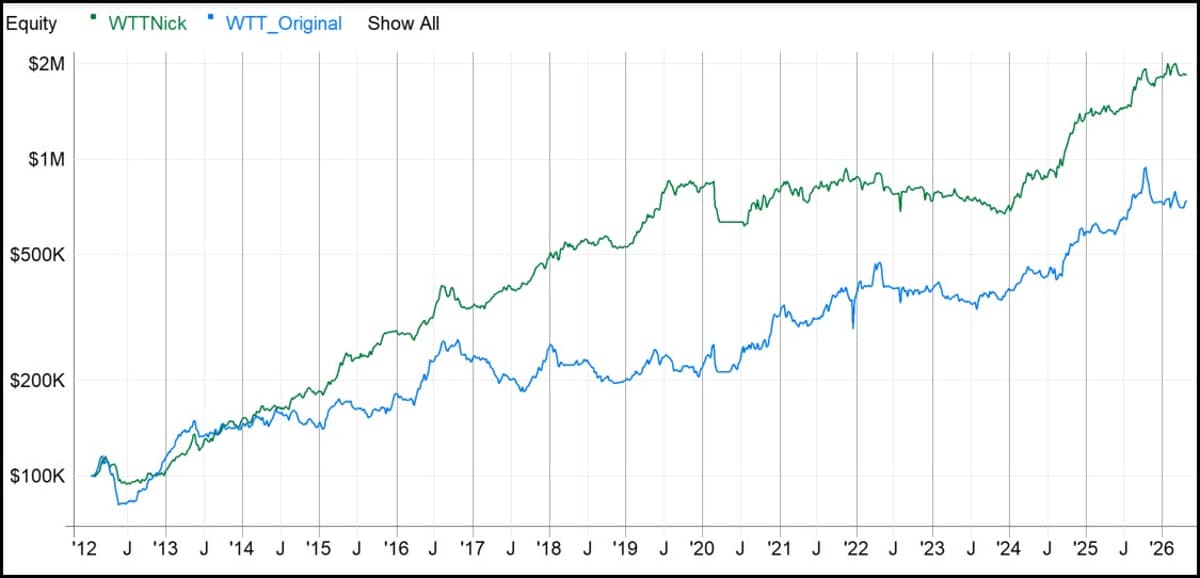
Customize and Retune Strategies to Stay Ahead
Two important factors when trading systematically, and I'll use my Weekend Trend Trader strategy as an example. (1) It is important to personalise a strategy and make it your own. Any strategy in the public domain tends to have its edge...
Weekly Market Signals: Key Asset Outlook
Weekly Market Signals for subscribers. Link in reply below. 👇 $SPY $TLT $GLD $VEU $DBC $UUP https://t.co/AOaU9635MH
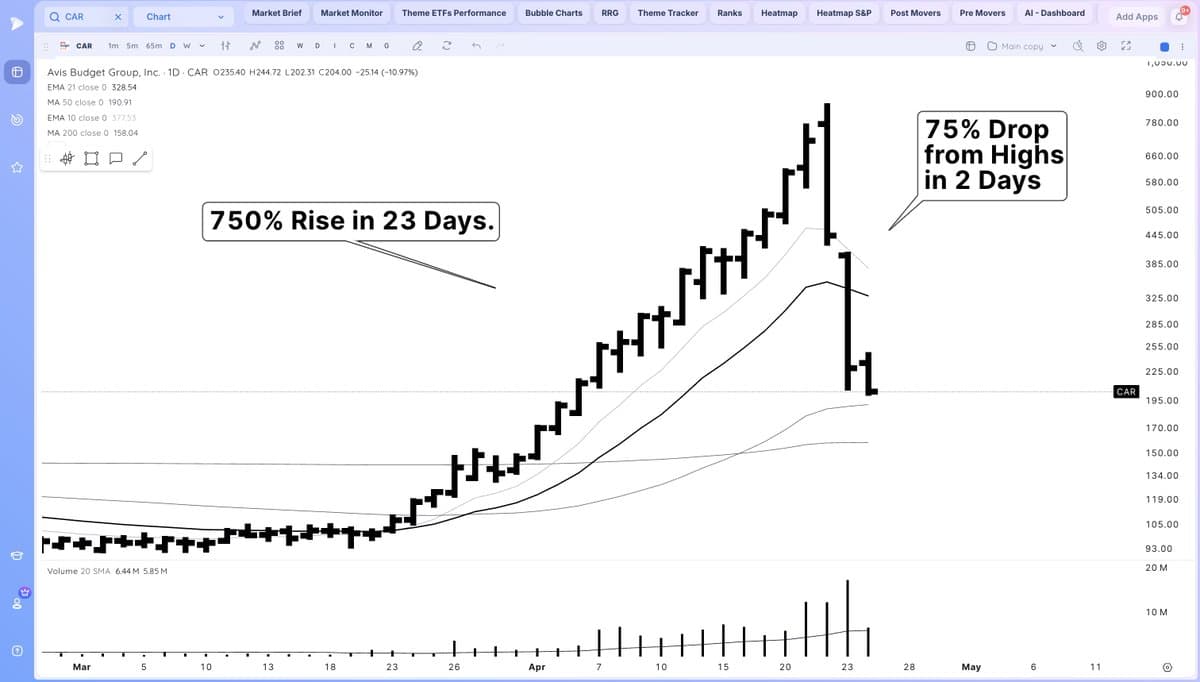
Free Guide: Parabolic Short Setup Using $CAR Case Study
I'm currently writing the next Trade Lab Edge Article This week's edition is focused on the parabolic short setup looking at the $CAR Case Study. To receive it (It's 100% Free) Sign up here: https://t.co/PZYhGFnxII https://t.co/i8e9Ans72u
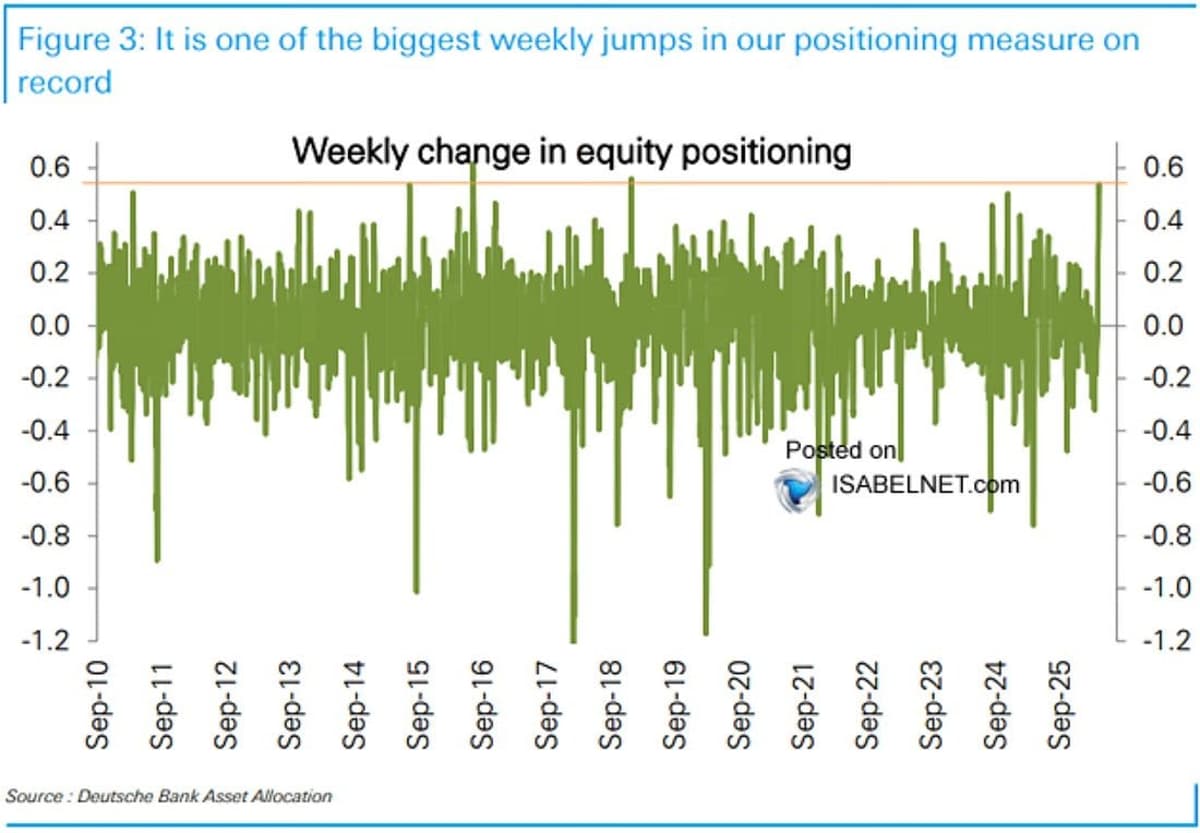
Record Money‑Market Outflows Spur Historic Equity Surge
Back in the pool? Record money market outflows and historic single-week jump in equity positioning. Also, AAII bulls largest weekly jump since Jan '25. Thanks @EricSoda for sharing these in your note today. https://t.co/WL1QFkNGnx
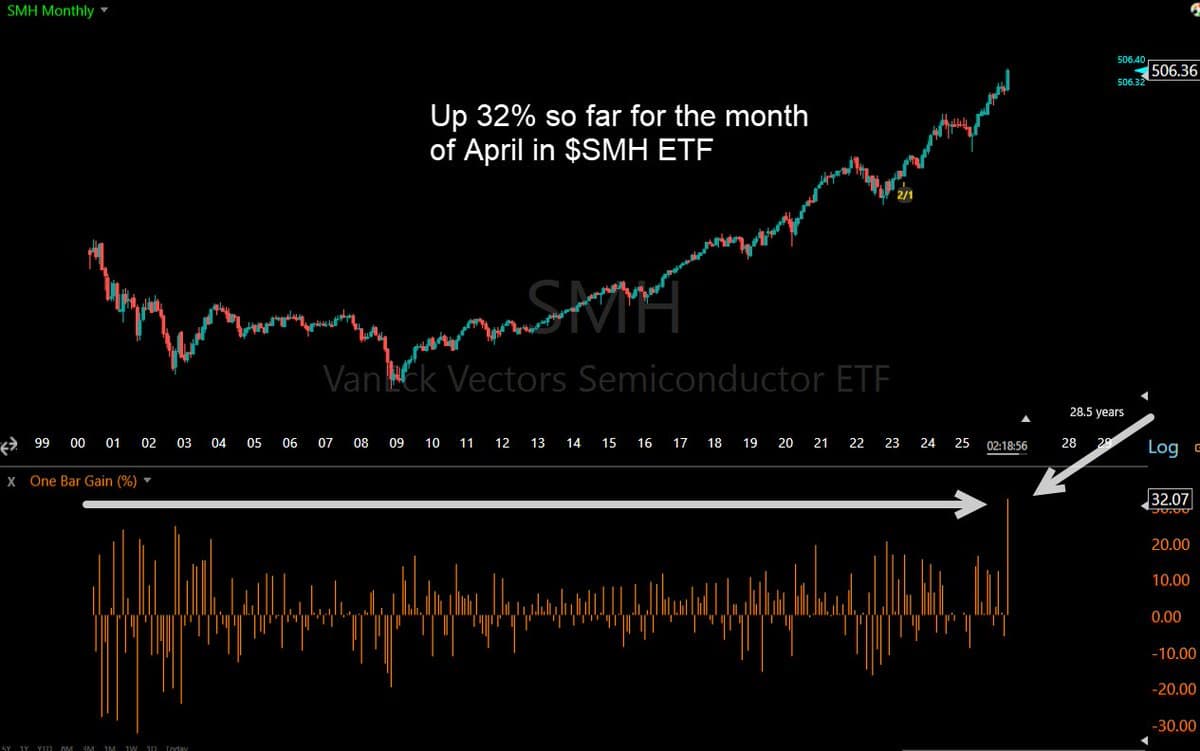
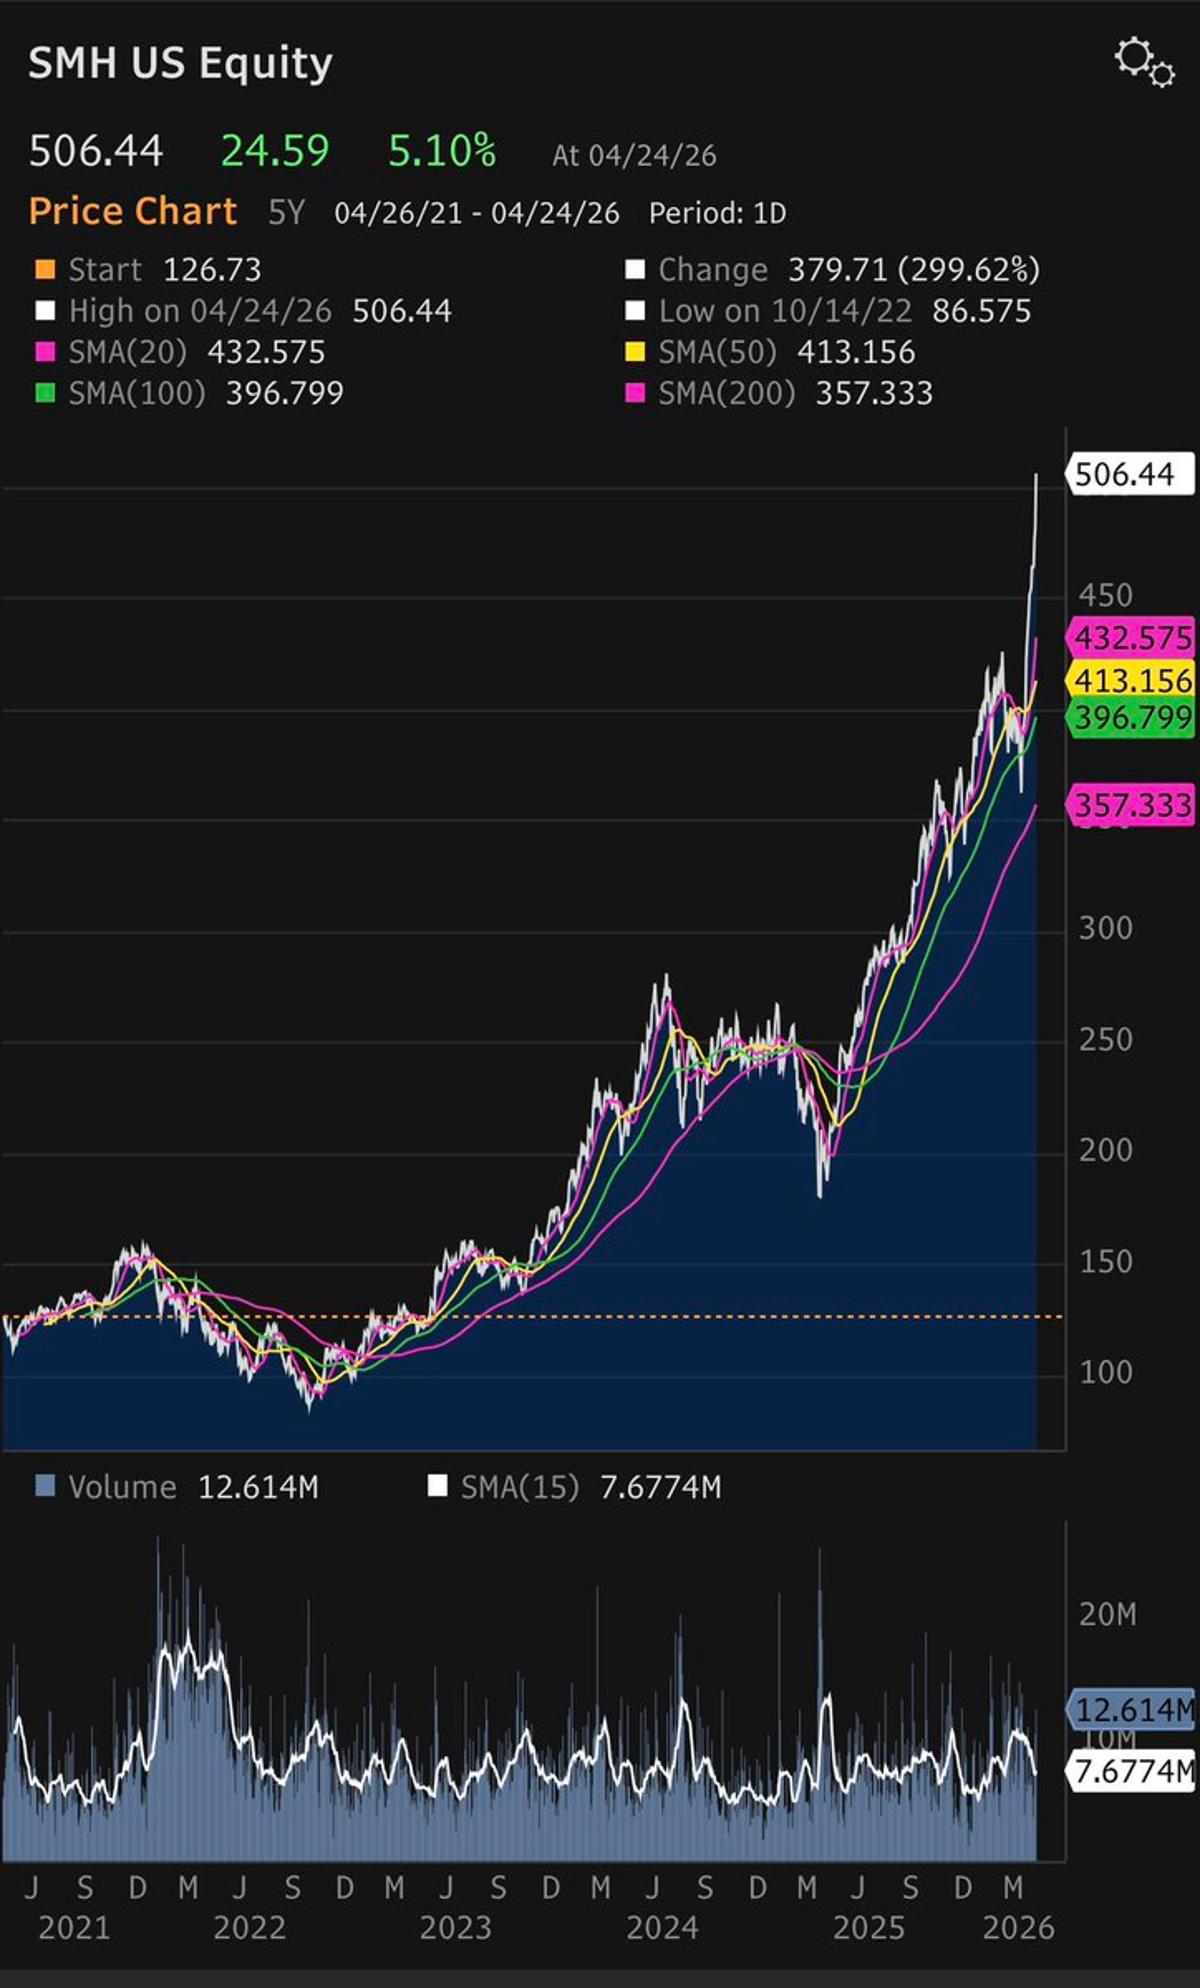
Semiconductor ETF Poised for Best Month Since 2000
Bit of a chart crime looking at this before the month close, but semiconductor $SMH ETF is on pace for its best month ever going back to 2000. That kind of concentrated leadership explains why this rally feels so bifurcated, with...
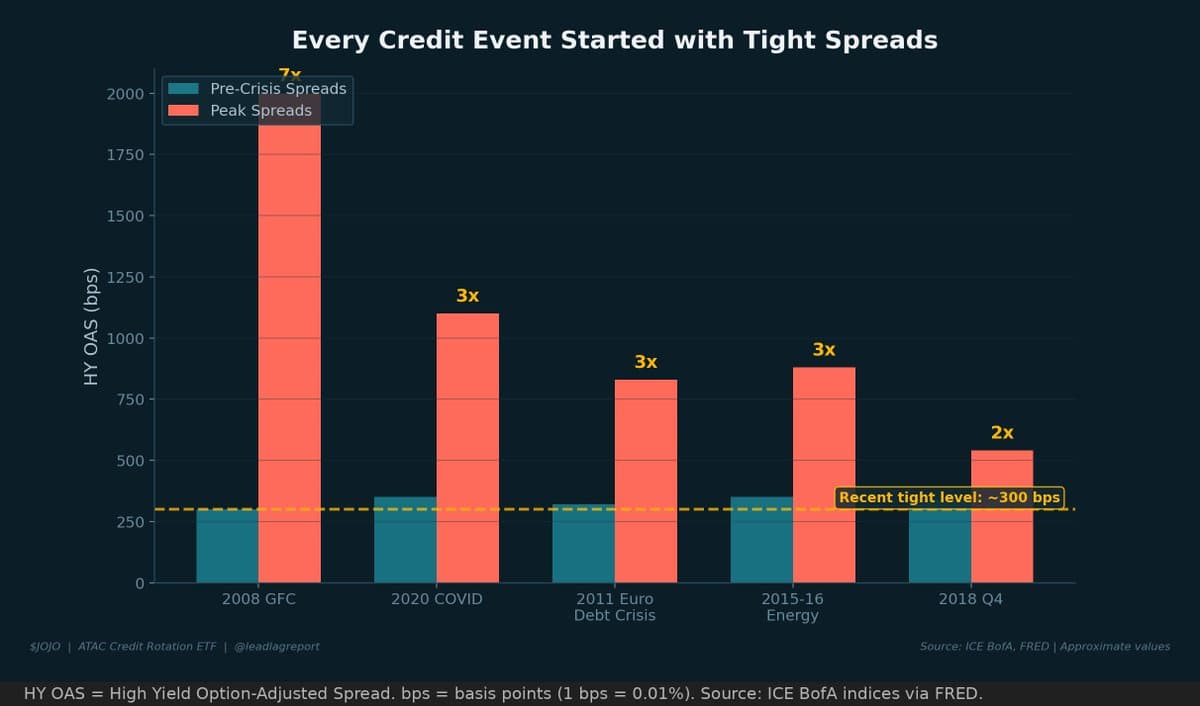
Tight Spreads Signal Impending Volatility,
Every time spreads have been this tight, they widened violently. 2007. 2019. No one rang a bell then either. $JOJO is the bell. https://t.co/ae6yeTLVdx
Bearish Outlook
Me taking one look at Hyper-liquid SPX down 50bp. I'm max bearish but trading down on Hyperliquid based on some weekend Iran news is BULLISH. https://t.co/xj8d3X3HVV

Align Your Chart's Timeframe with Your Trading Process
No one is going to care more about your process than you. Align your chart with the time frame you're trading. That's step one.
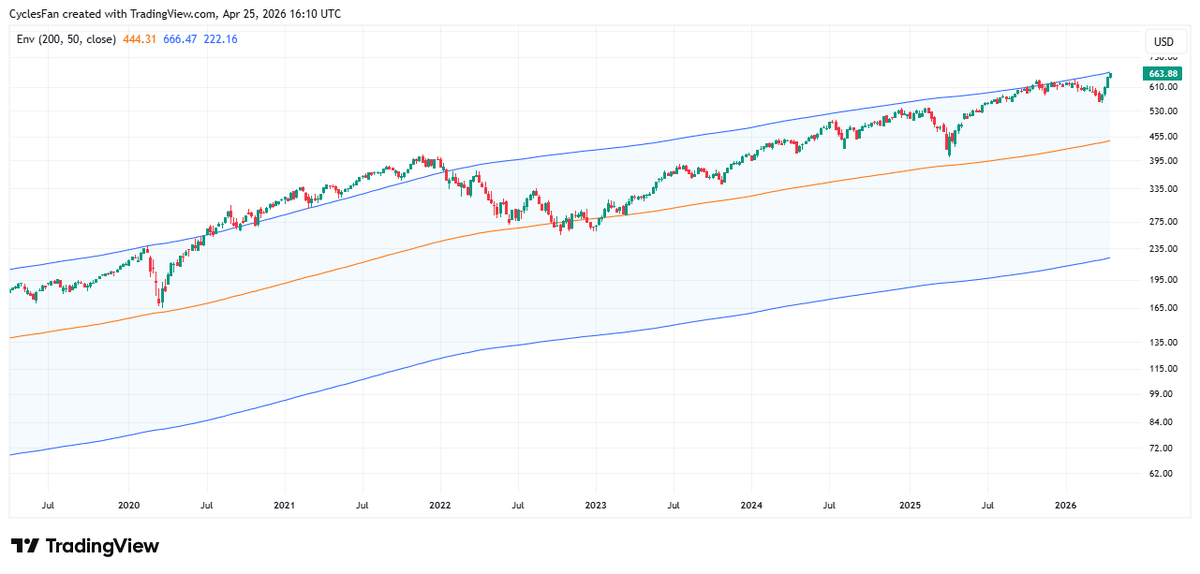
QQQ Near 50% Above 200‑Week MA—Rare Historical Signal
$QQQ is almost 50% above its 200 week MA. The last time that happened was in October and the weekly candle was above the threshold at the October top. Since 2009 the only prolonged period that it traded above the...
NVDA Climbs Fourth Week, yet New ATH Still Elusive
$NVDA - 4th up week in a row but it hasn't made a new ATH yet, while all other top 10 SMH components(except for ASML) have already made new highs. Its gigantic market cap continues to be a psychological deterrent....
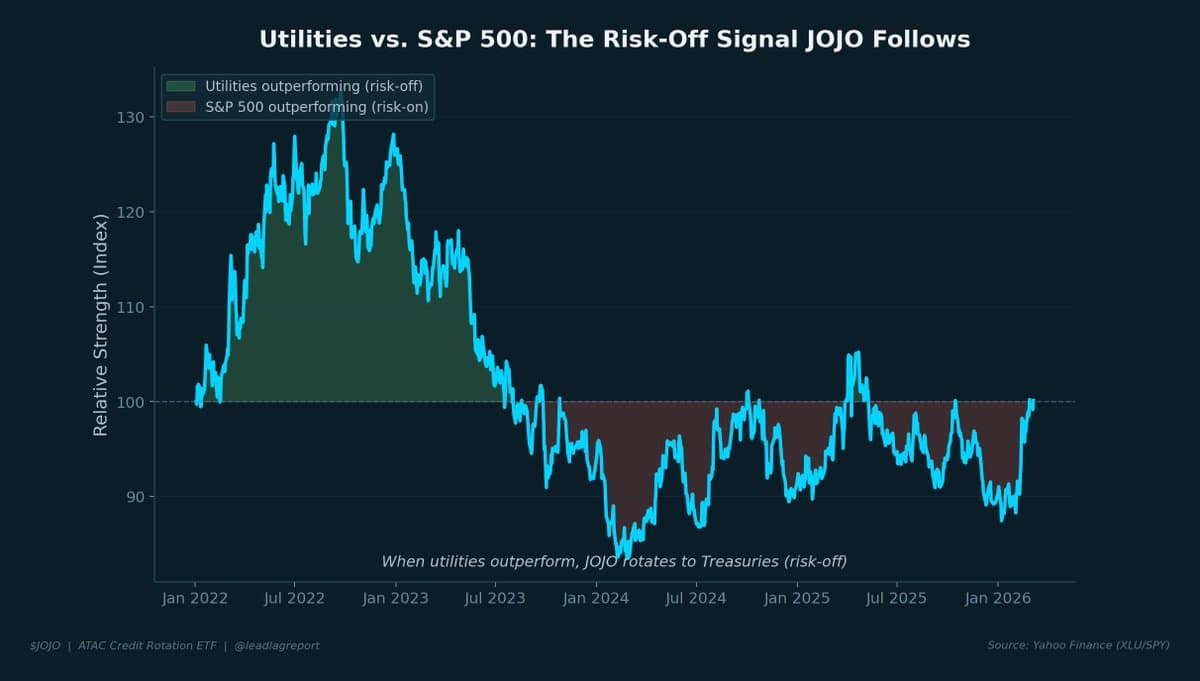
Utility‑Market Correlation Signals Risk Appetite, Guides $JOJO
Inter-market signals matter. The relationship between utilities and the broad market tells you something about risk appetite. $JOJO listens to that signal. @leadlagreport https://t.co/zaRxS4ePjI
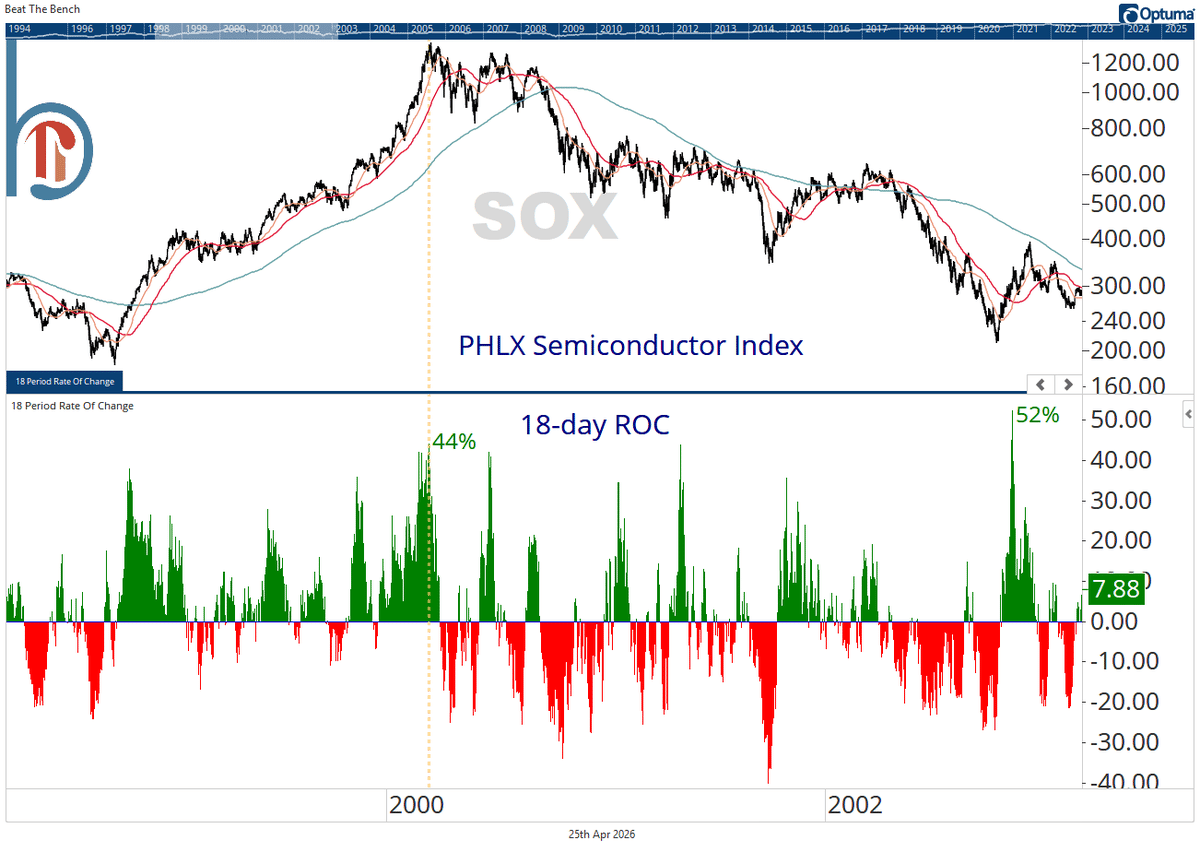
SOXX's 18-Day Surge Beats Dot‑Com Bubble High
The SOXX ETF (iShares Semiconductor ETF) is up 18 days in a row and +49% in that time. The best comparable reading the PHLX Semiconductor Index saw in the dot-com bubble was +44%, and it marked the March 2000 top https://t.co/28y0Z6DFLq
Moving Averages Lesson Hits 125K Views—Catch Up
125,100 views and counting on this moving averages lesson. If you missed names like $AAPL $MU $SNDK this week, start your learnings: https://t.co/ASxwSr70HB
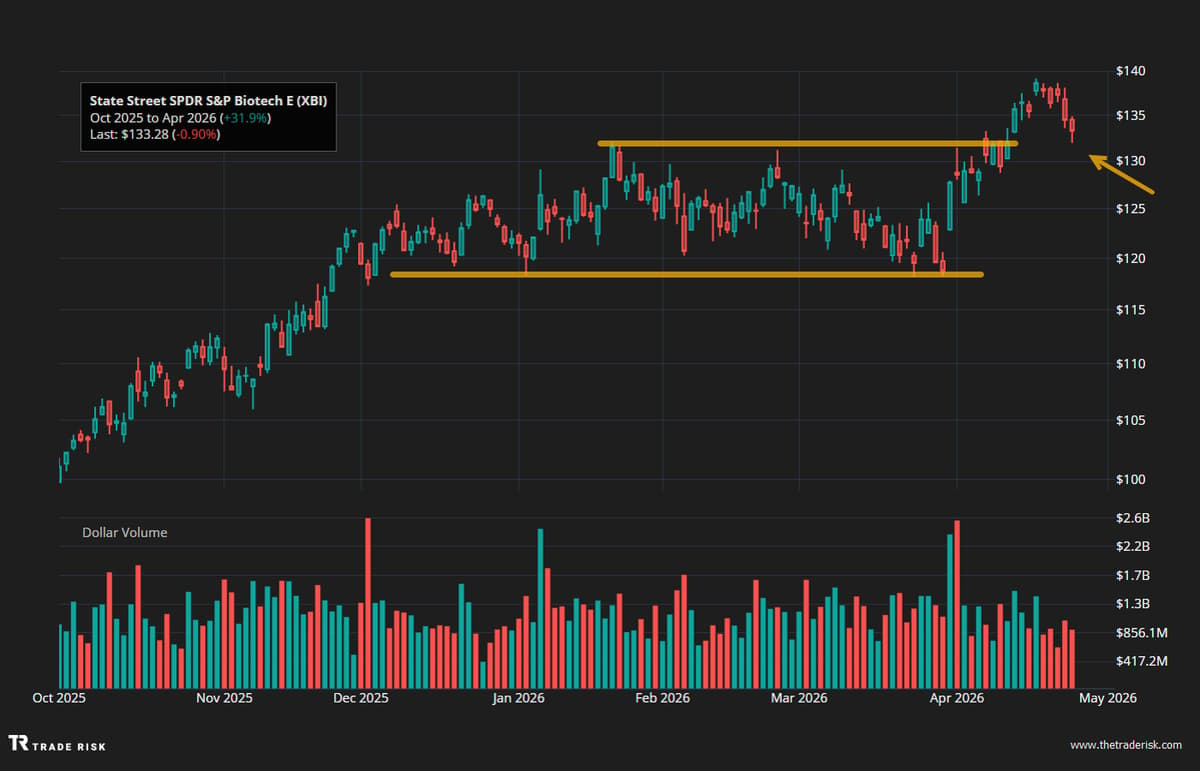
Biotech Breakout Highlights Gaps Amid Four‑week Index Rally
Four straight weeks higher for the major indices, but not everything is extended. Biotech is a good example. $XBI broke out of a 4-month range and just printed an inside week. We discuss where to find opportunity now: Watch:...

Brief Chart Glances Prevent Emotional Trading Decisions
You'll do your best looking at charts briefly If there's nothing obvious then the longer you stare you'll just start making emotional decisions Have you ever done this?
Questioning Friday Put Purchases on SMH Amid Burry Debate
The dunking on @michaeljburry is funny and all but if your going to buy puts on $SMH isn't Friday a decent time vs any other time in history? Depending on the comments may have to join him https://t.co/0ul7RbjQo8
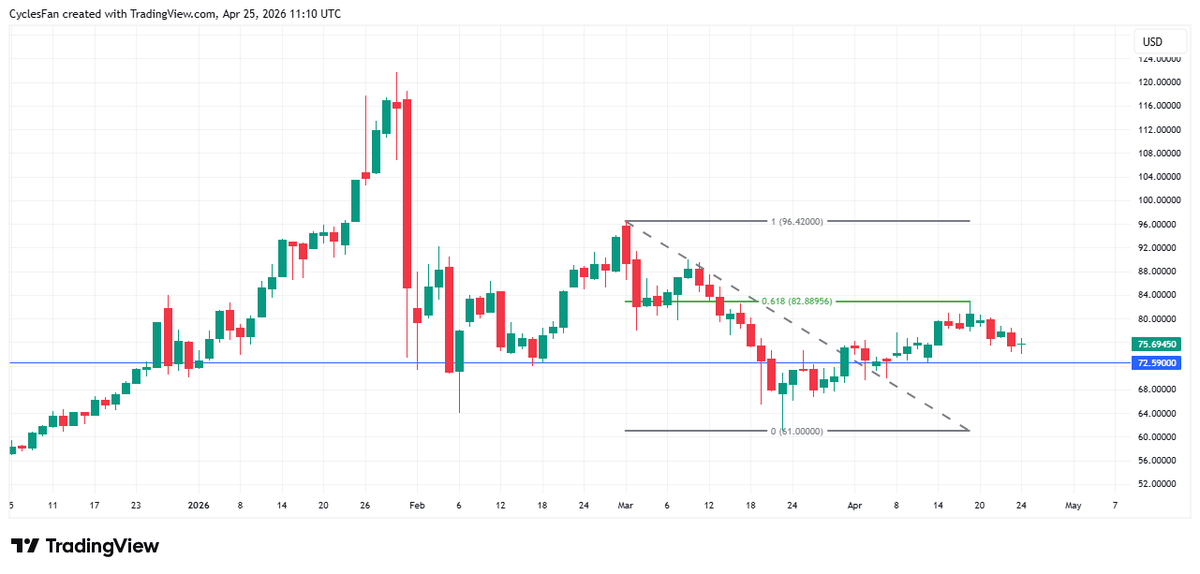
Silver Near Sell Signal; Break Below 72.59 Triggers Drop
$Silver - It looks like the bounce out of the March low ended at the 0.618 retracement of the March 3-23 downtrend and we're getting close to another sell signal. A close below 72.59 will likely lead to another decline...
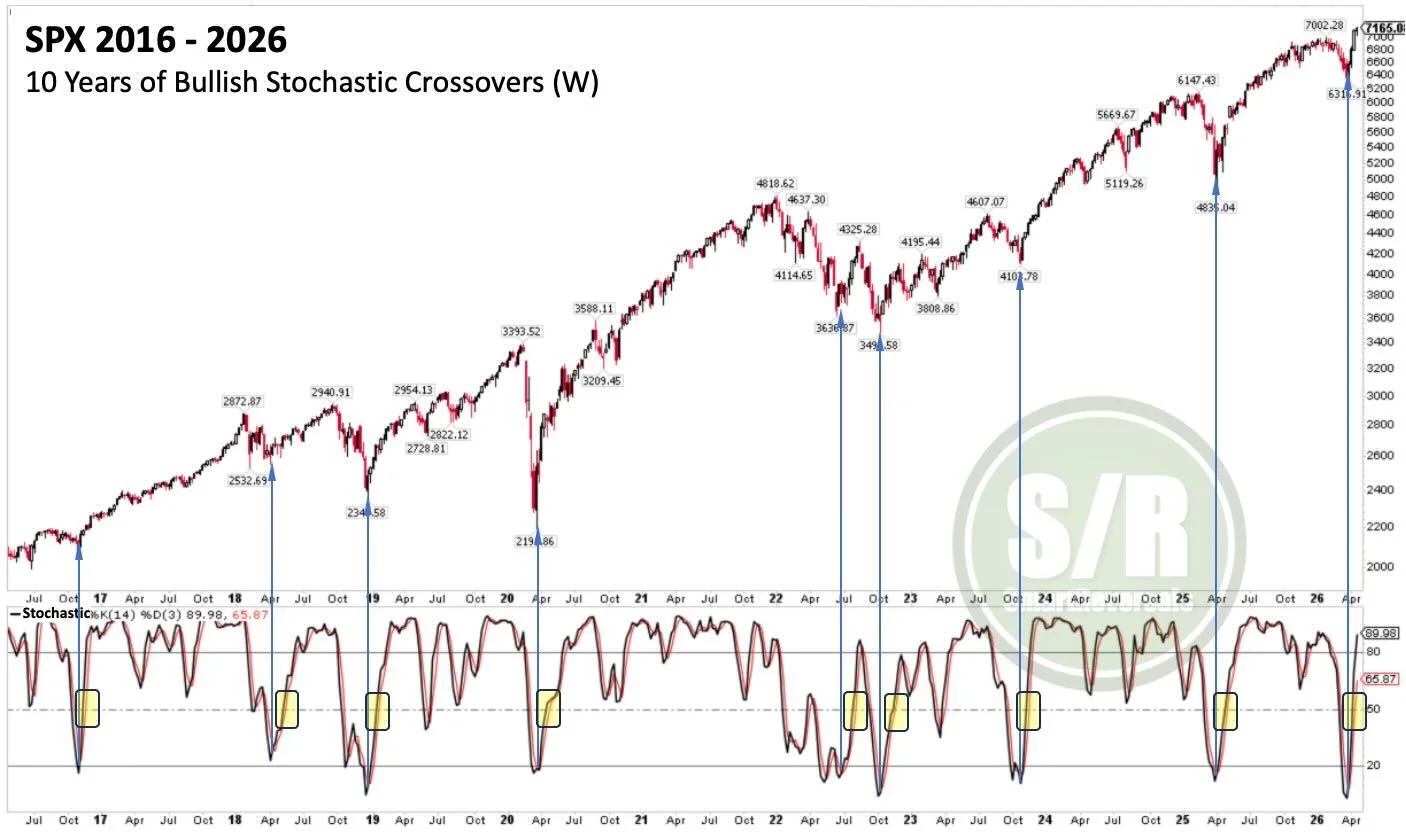
SPX Stochastic Signals Ongoing Bullish Momentum
SPX: During the last 10 years, every time the Stochastic bounced from oversold area and made it above 50, the index maintained bullish continuation and consolidated when the oscillator was overbought (+80) with both lines. There is room for further...
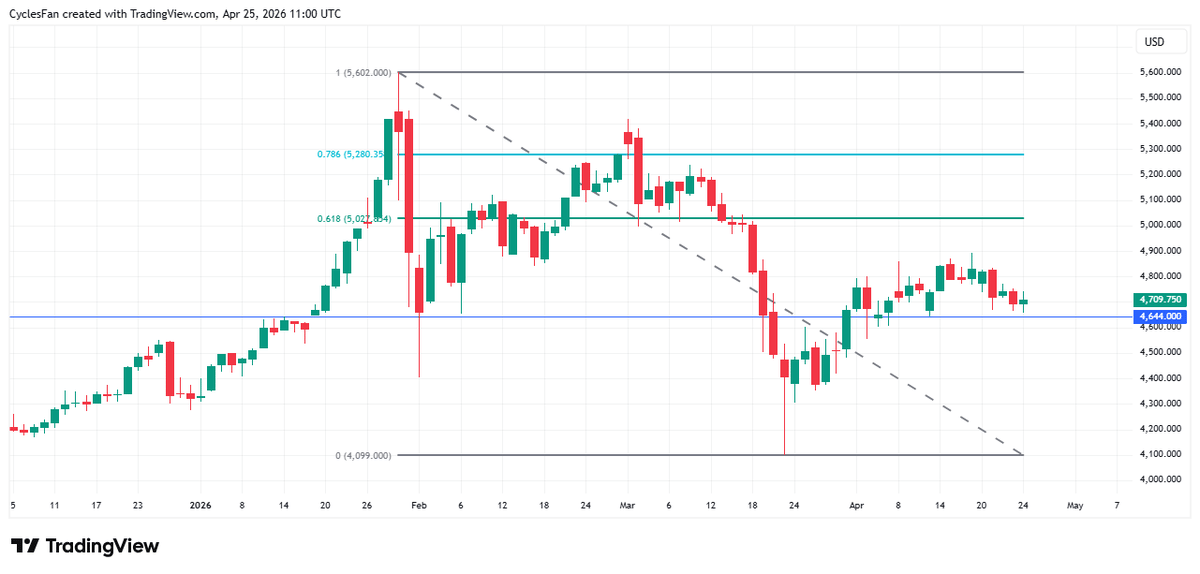
Gold Misses Bounce, Faces Potential Drop Below 4644
$Gold - I was expecting the bounce out of the March low to continue towards the 0.618 retracement at 5027. Instead, this week was a down week and price is getting close to another sell signal. A close below 4644...
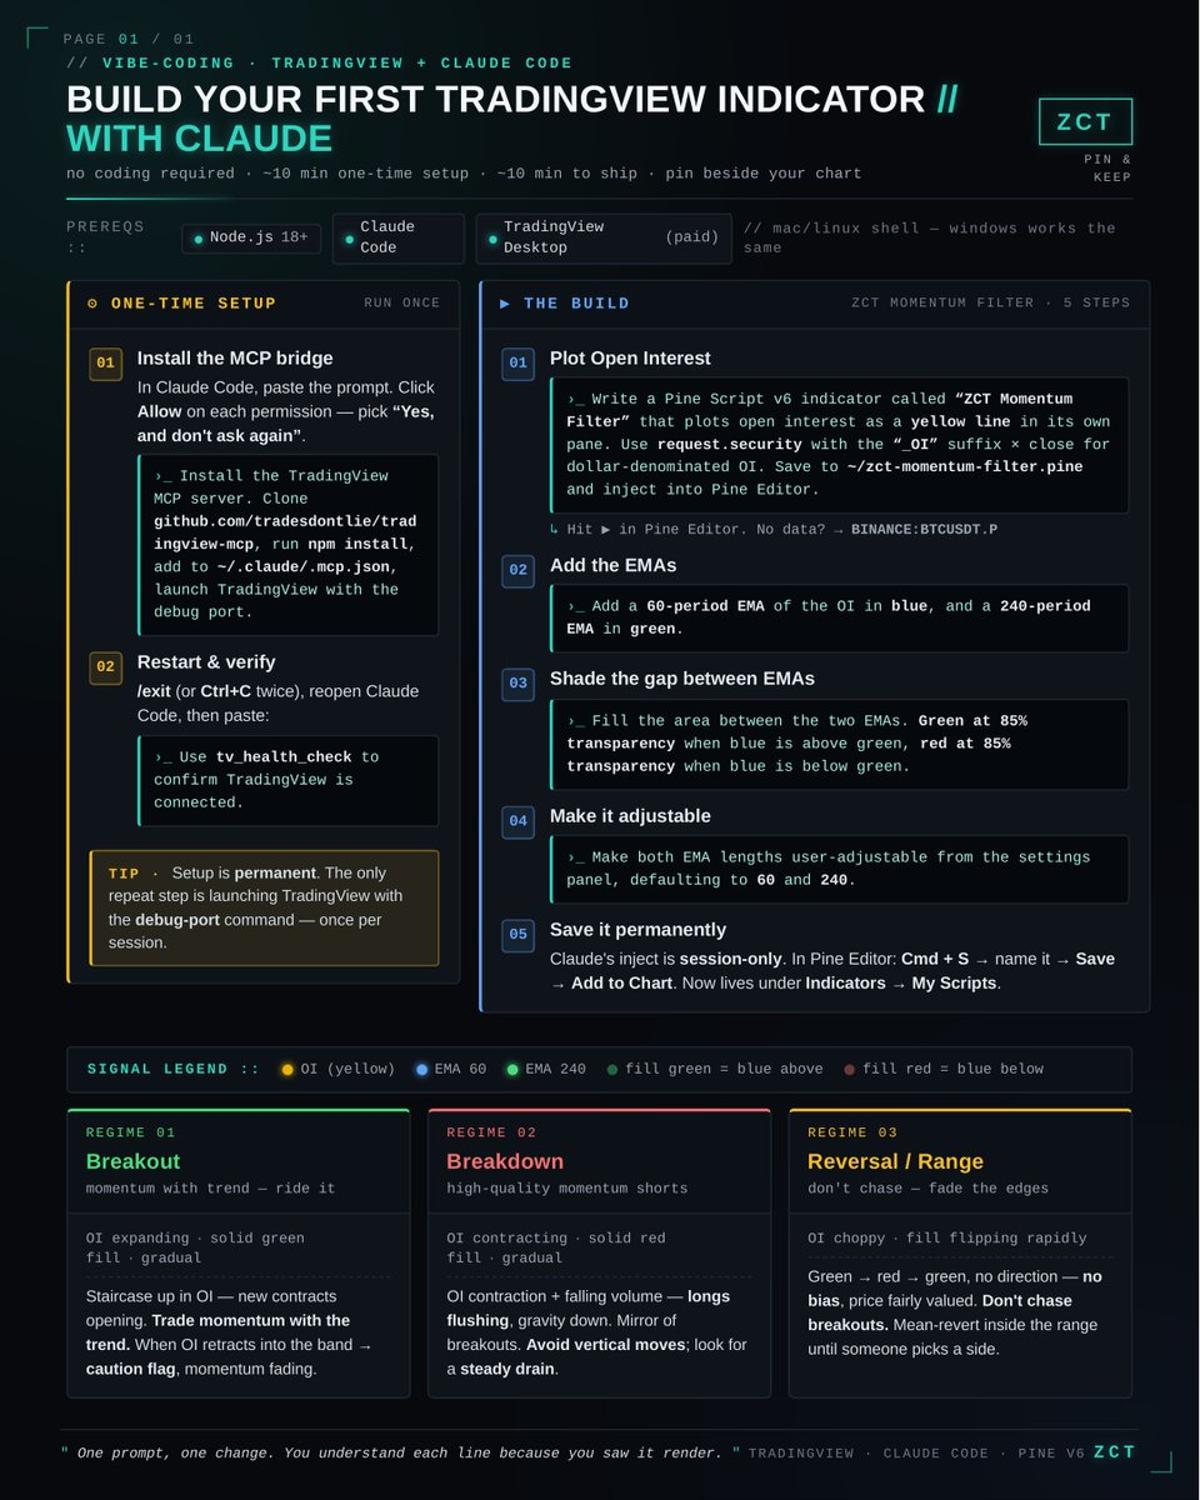
Use Claude to Build Any Trading Indicator Instantly
Every Trader needs to use Claude. In this guide you'll get: - The skill to build any trading indicator - My custom Breakout indicator - Real trade examples (not just theory) I've included a cheatsheet too Enjoy. https://t.co/dQAVJ213gF https://t.co/Y6qVMzxUFG

Assessing Semiconductor Bubble Risk and Top Confirmation Signals
Hey @grok What’s the probability that Semiconductor stocks are in a bubble right now—and what specific indicators would confirm the top is in?
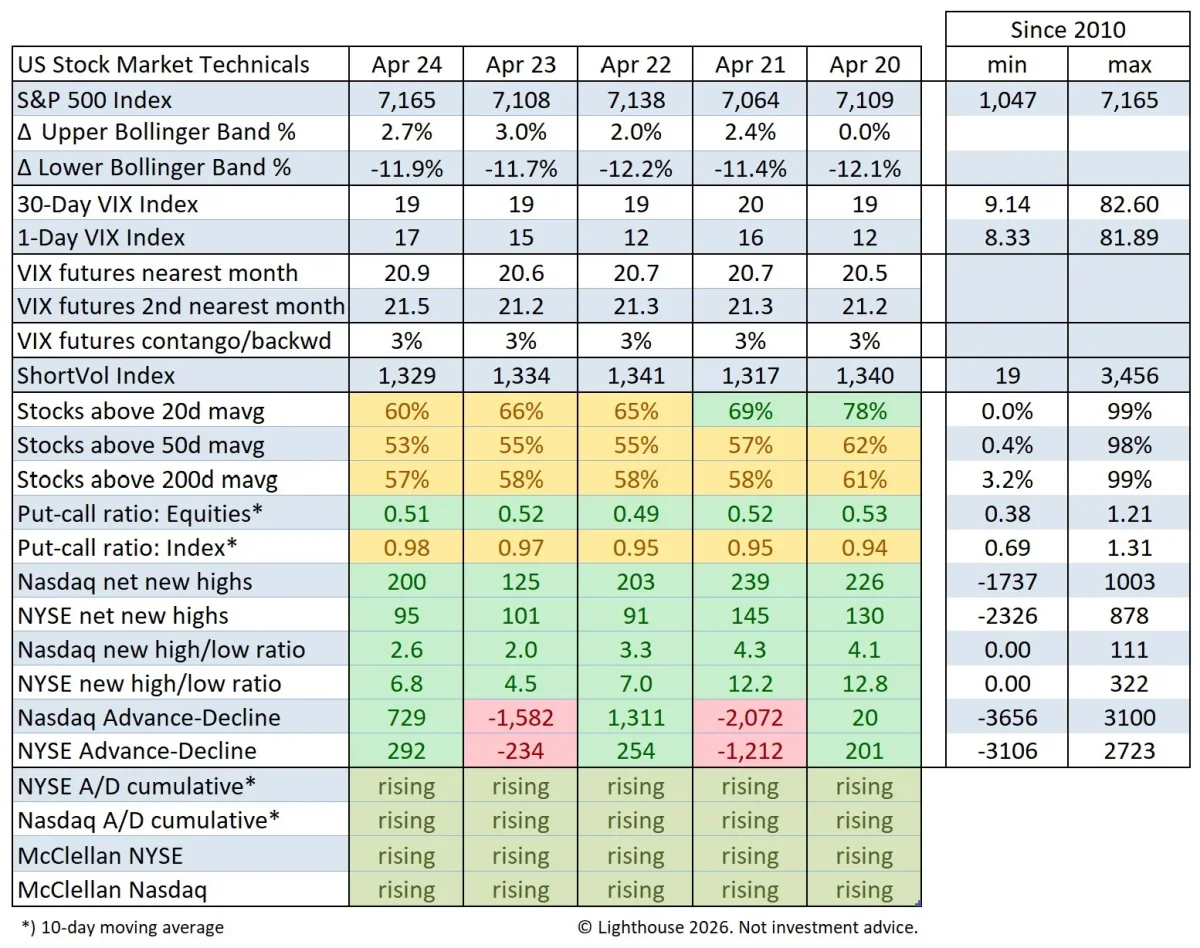
Markets Hit New Highs, Momentum Fades Slightly
#RSP -0.2% #SPX +0.8 ATH #Nasdaq +1.6% ATH #VIX contained. Momentum still good, but slowing down.
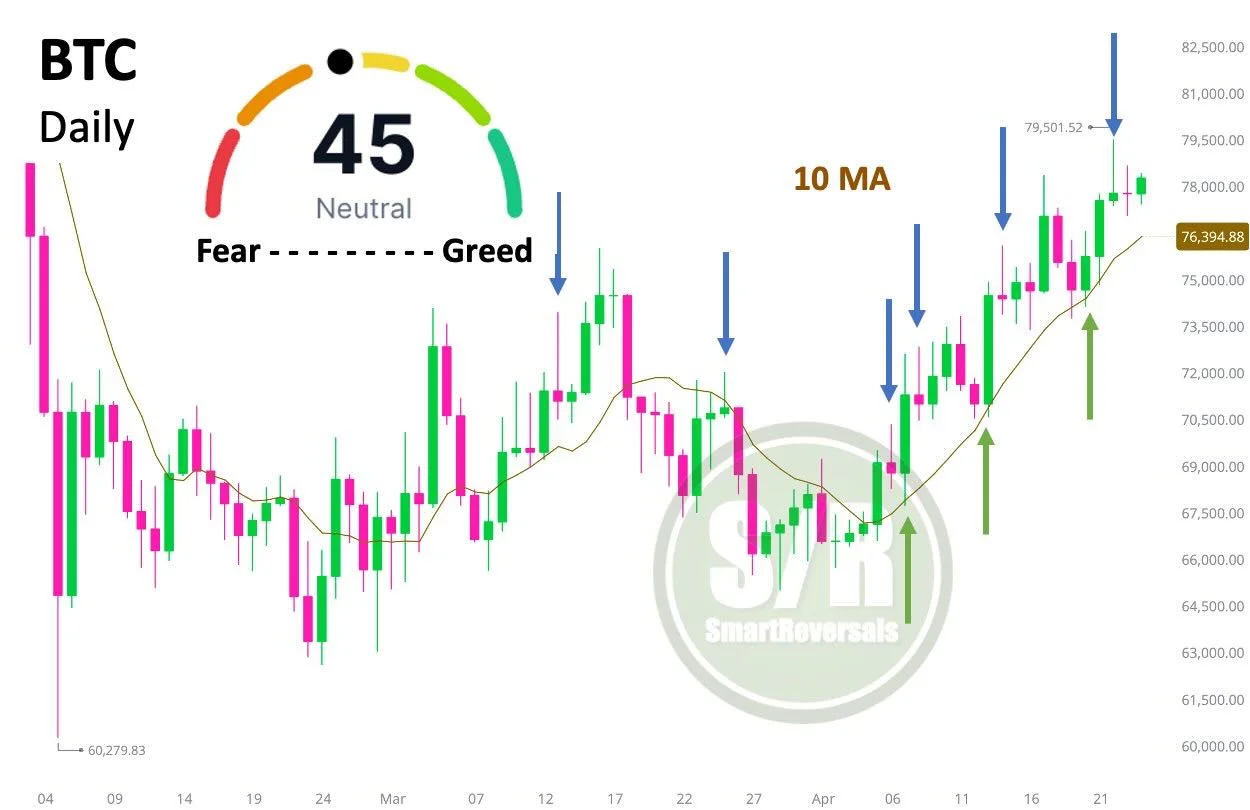
Bitcoin Bull Run May Hit $80.6K Soon
BTC: Bitcoin is in a bull trend consistently invalidating daily shooting stars as momentum continues. The 10-day moving average is carrying this move and the price is far from greed. Don’t rule out a test of $80.6K within the next...
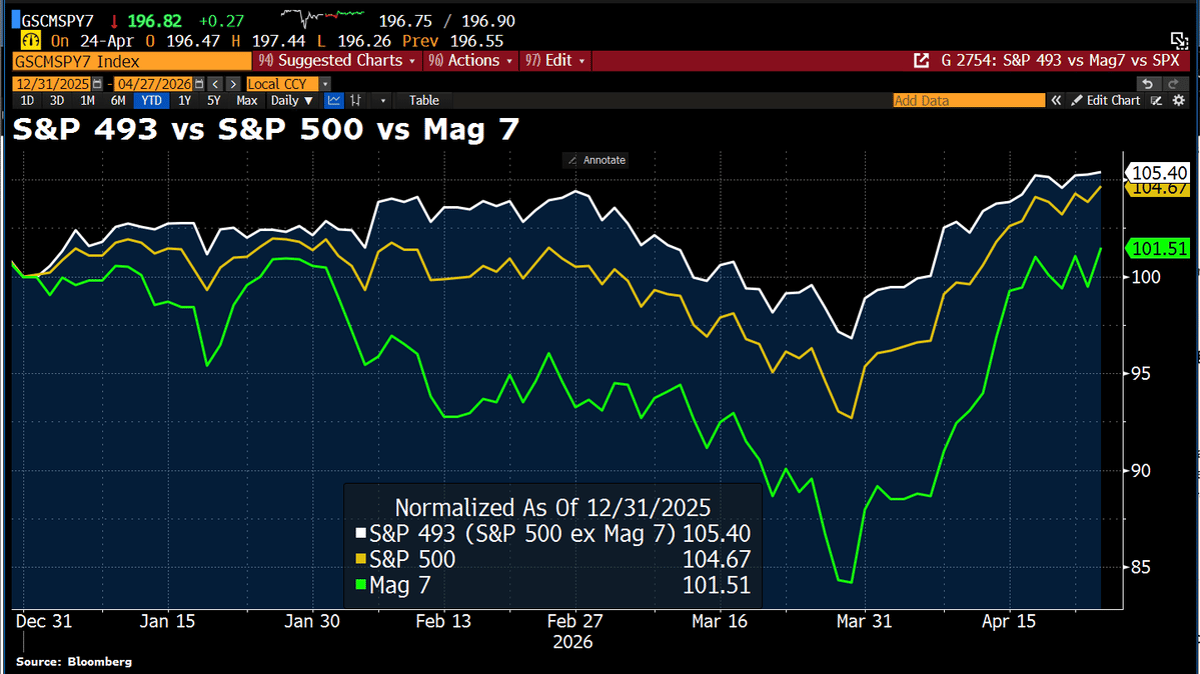
Mag7 Near Record Highs, Yet Up Only 2% YTD
#Mag7 are trading near record highs again, but the group is barely up 2% YTD. A powerful rebound w/surprisingly little to show for it. https://t.co/CMbEVQZEpC
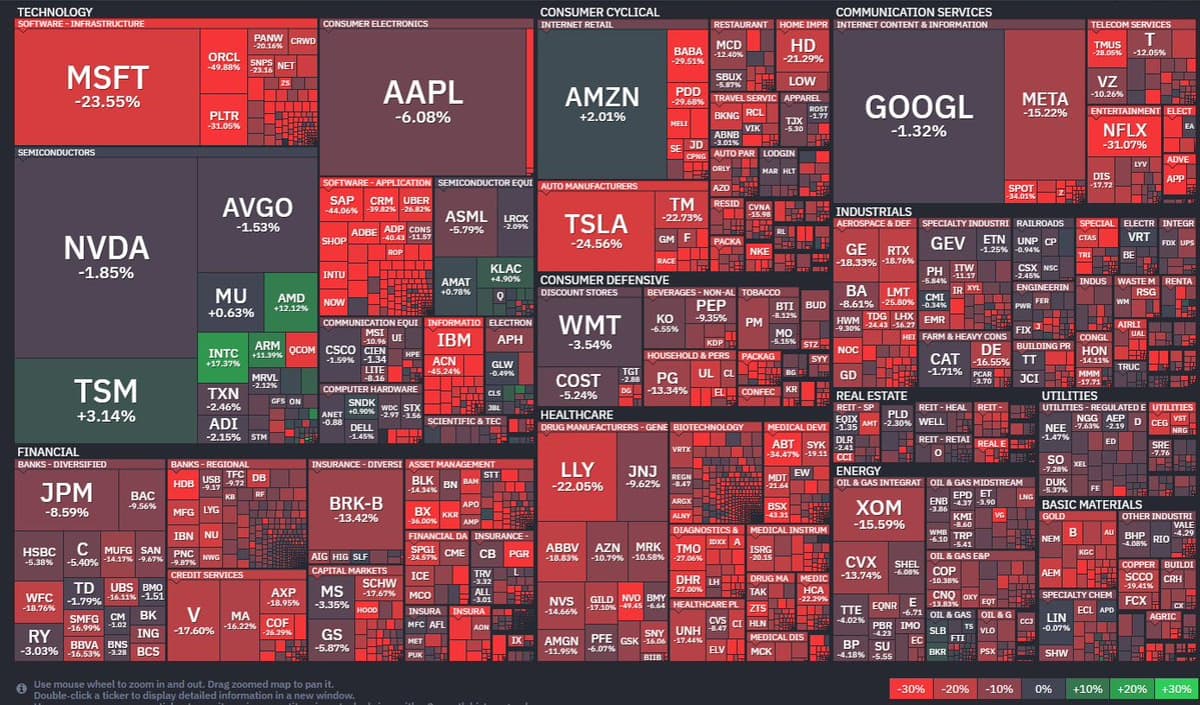
Tech Titans Hit 52‑Week Highs, Heat Map Shifts
Drawdown heat map looks a bit different now $NVDA $GOOGL $AMZN $TSM $AVGO all ~at 52wk highs https://t.co/1DXB8SylAf

Charts Lack Memory, Context, and True Predictive Power
They call themselves 'Chart Guys.' The chart has no memory, no Quad context, no Vol Signal. It's a picture of the past dressed up as a view of the future https://t.co/FT6EBlqeAm
10 Days, No Shorts Squeeze,
Over a 10 day period where my former-self would have been royally squeezed on the Shorts... https://t.co/MqFwbBtR8l
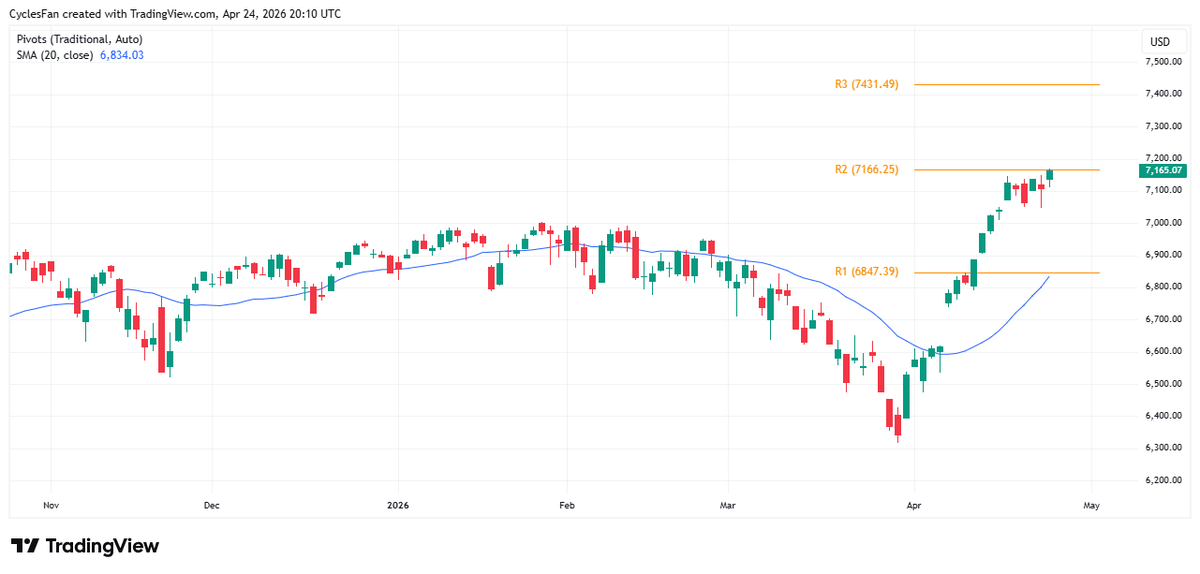
SPX Likely to Pull Back to 20‑day MA
$SPX - Made a new high today but it has reached the 2nd monthly resistance at 7166. The 3rd one is at 7431 and will not be reached in April. I expect a pullback to start next week and target...
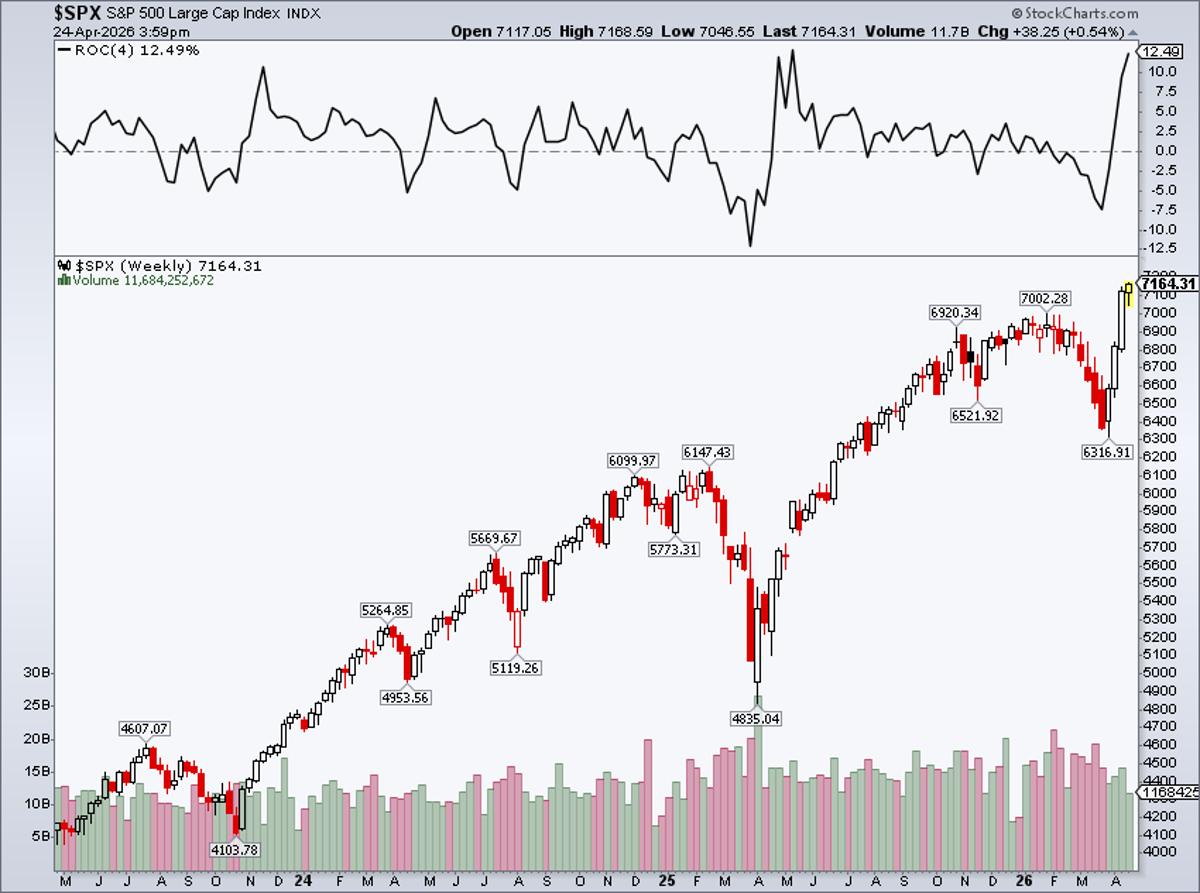
S&P 500 Hits Record, Gains 12.5% Over Four Weeks
S&P 500 record high.. up 4 weeks in a row.. +12.5% in that stretch @stockcharts https://t.co/LwE87EC6mR
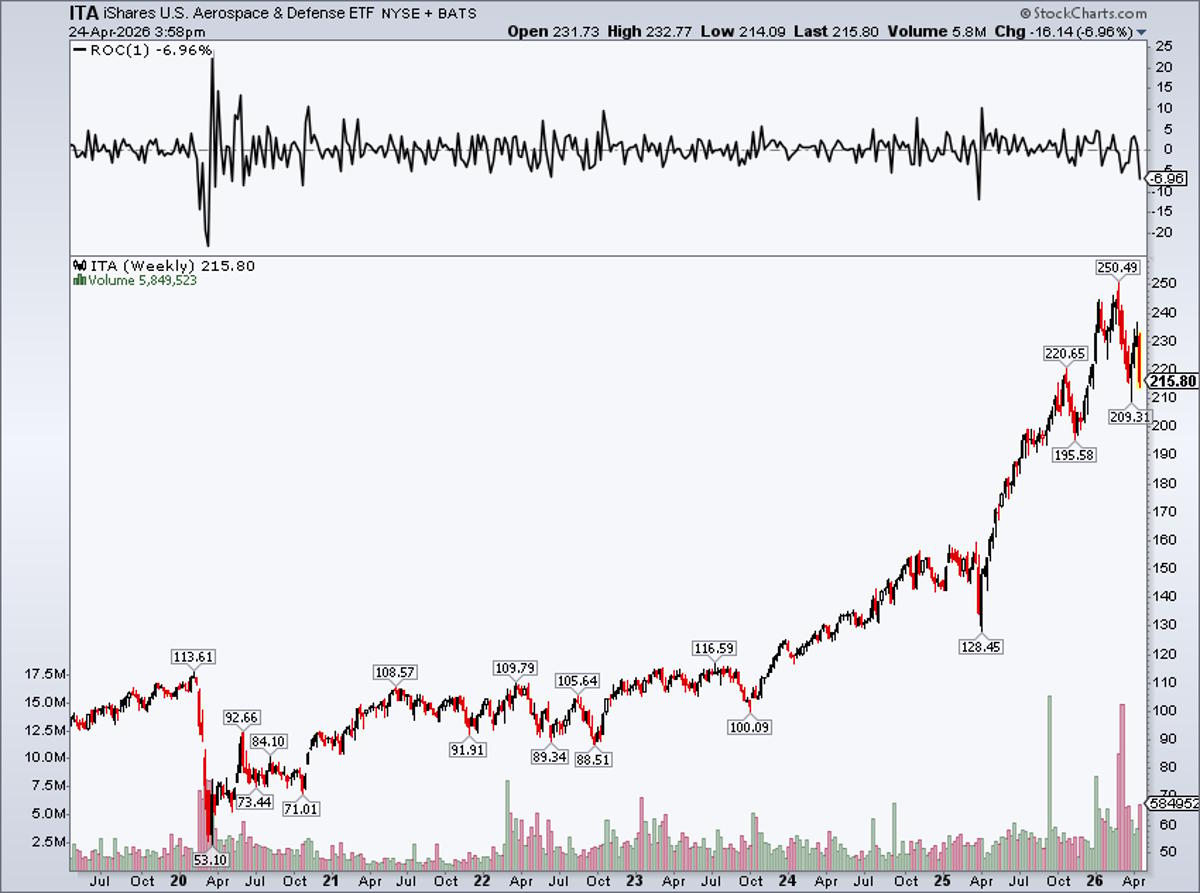
ITA Aerospace & Defense Suffers Second-W
$ITA Aerospace & Defense 2nd-worst week since late 2020... odd with oil up and the war ongoing -7% https://t.co/xWZSAtzZld
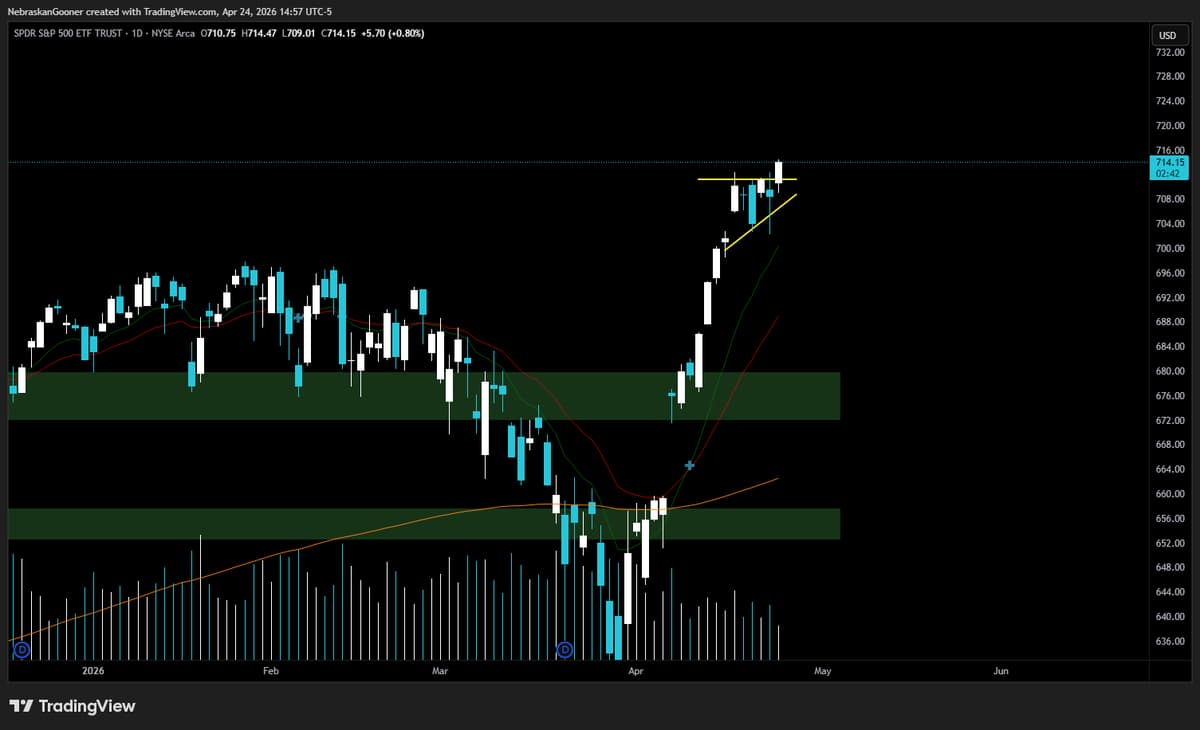
SPY Poised for Continued Upside After Strong Close
$SPY Working on a strong weekly close above this local consolidation... Barring any weekend shenanigans looks set to keep running https://t.co/GsESoXQPha
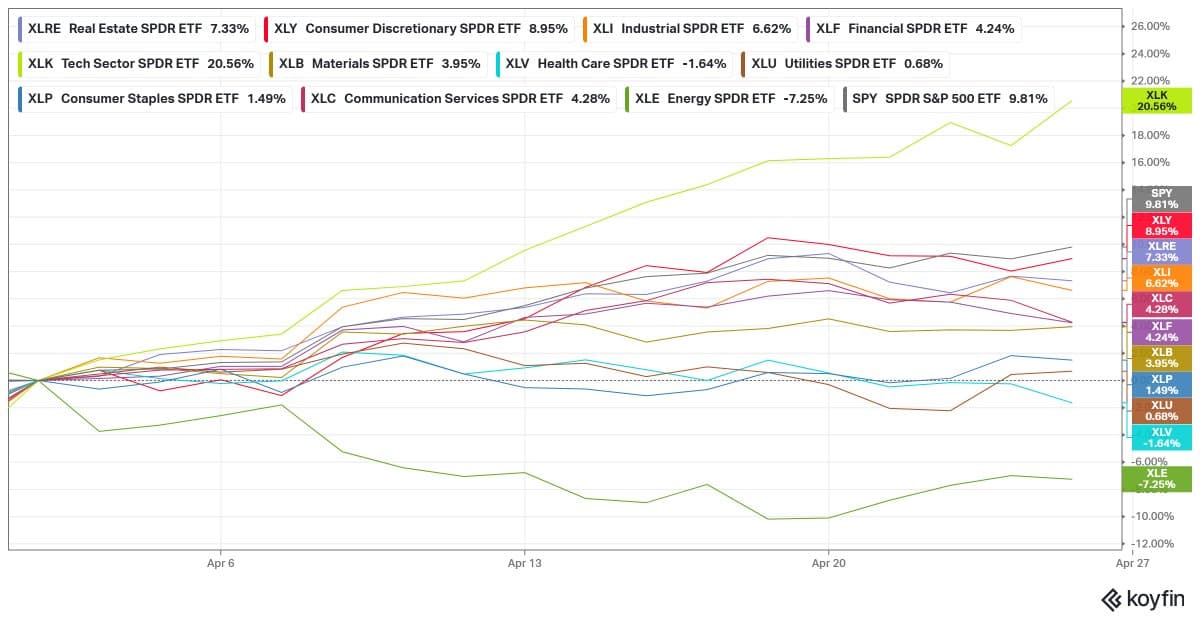
Tech ETF XLK Surges 21%, Outperforms S&P 500
There's 1 sector ETF beating the S&P 500 this month.. $XLK tech.. up 21% https://t.co/QfPQ8uGRJh
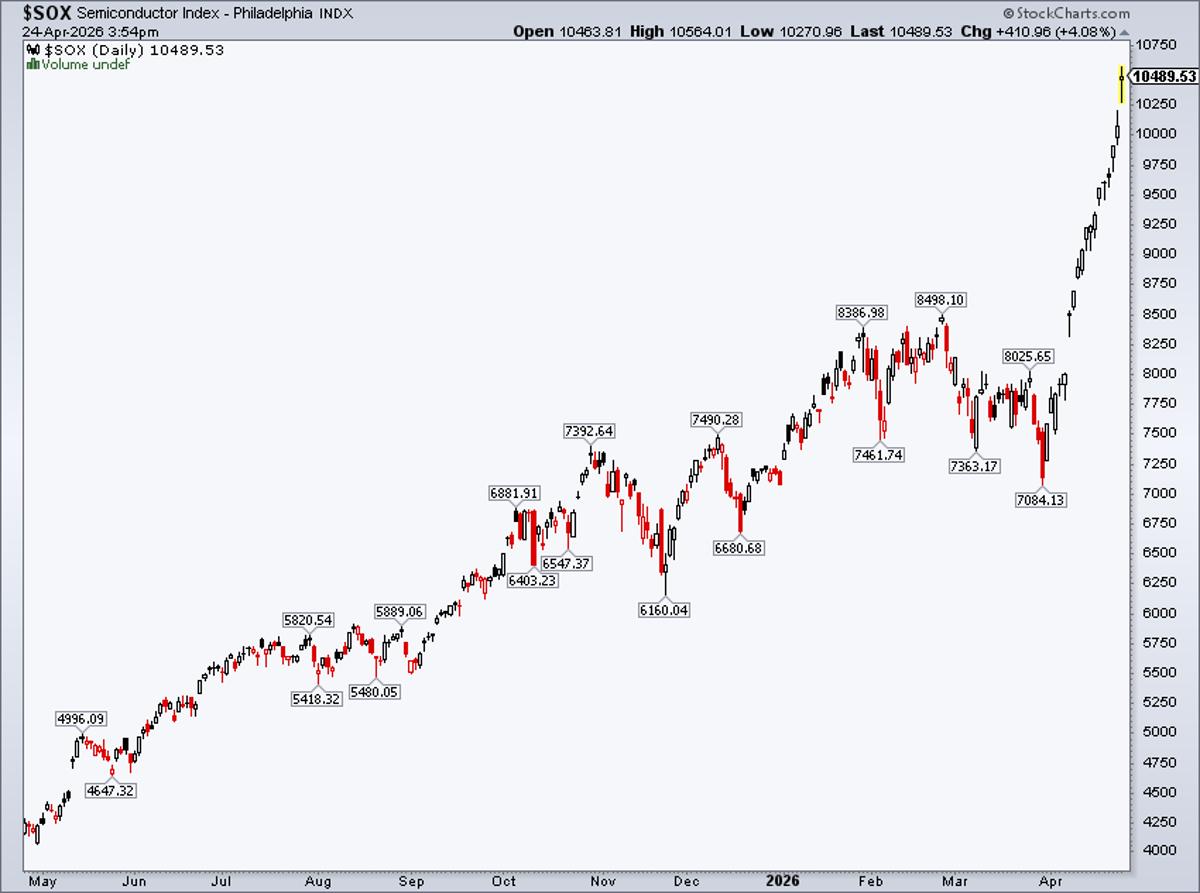
SOX Rides 18‑day Winning Streak, Gains 4% Today
$SOX perfect April continues... up 18 in a row +4% a banger today too https://t.co/eR5Iha571n