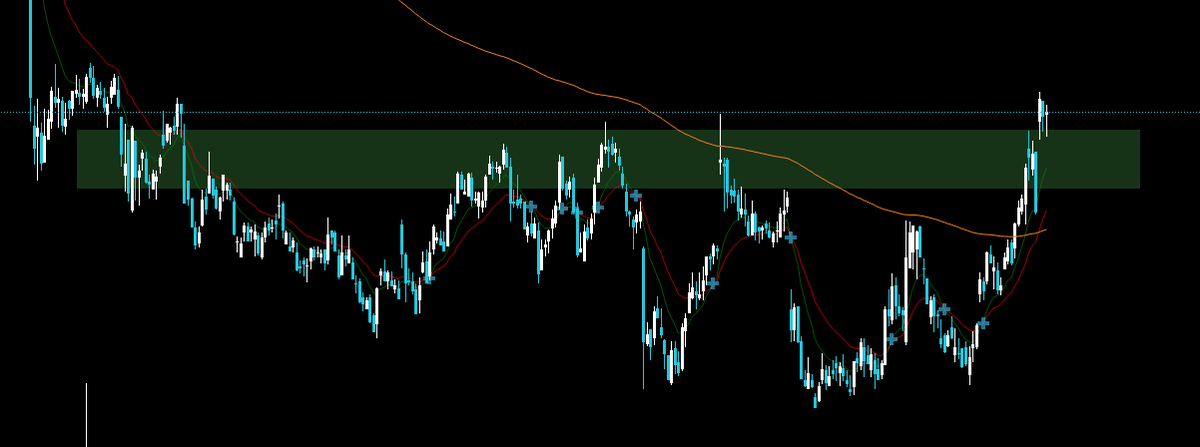
High Time-Frame Bottom Signals Potential Upswing
Newest stock chart posted for subscribers today... Looks like a high time frame bottom has formed. https://t.co/tpCUu12jaH
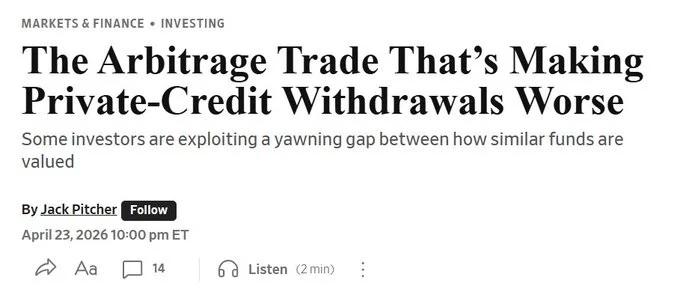
Redeem NAV, Buy Discounted Public BDC: Simple Arbitrage
Redeeming a nontraded BDC at NAV and buying the corresponding public one at a discount. Funny WSJ is calling this an "arbitrage."

Will Market Makers Allow QQQ 0DTE Expirations?
Are market makers going to let 0DTE and weekly call options in $QQQ expire at these price levels on a Friday?
Discipline Required; Impatient Traders Lose to Smart Money
No discipline = no profits. This setup shows how smart money traps impatient traders using inducement and liquidity. If you don’t wait… you lose. Learn the game. Master the edge. #ForexReels #TradingSetup #SmartMoneyForex #ICTModel #reels

No Training Prepares You for the Market’s Final Third
“There is no training, classroom or otherwise, that can prepare for trading the last third of a move, whether it’s the end of a bull market or the end of a bear market.” — Paul Tudor Jones

Activist Push Targets Genco; Aim for $26
Macro: activist pressure on Genco; Key: Diana 14.8%, offer $23.50 vs $23.42, FV $26; Risks: poison pill, board resistance; Trade: long Genco toward $26. 📈 — Viktor Kopylov, PhD, CFA. More insights: t.me/si14Kopylov
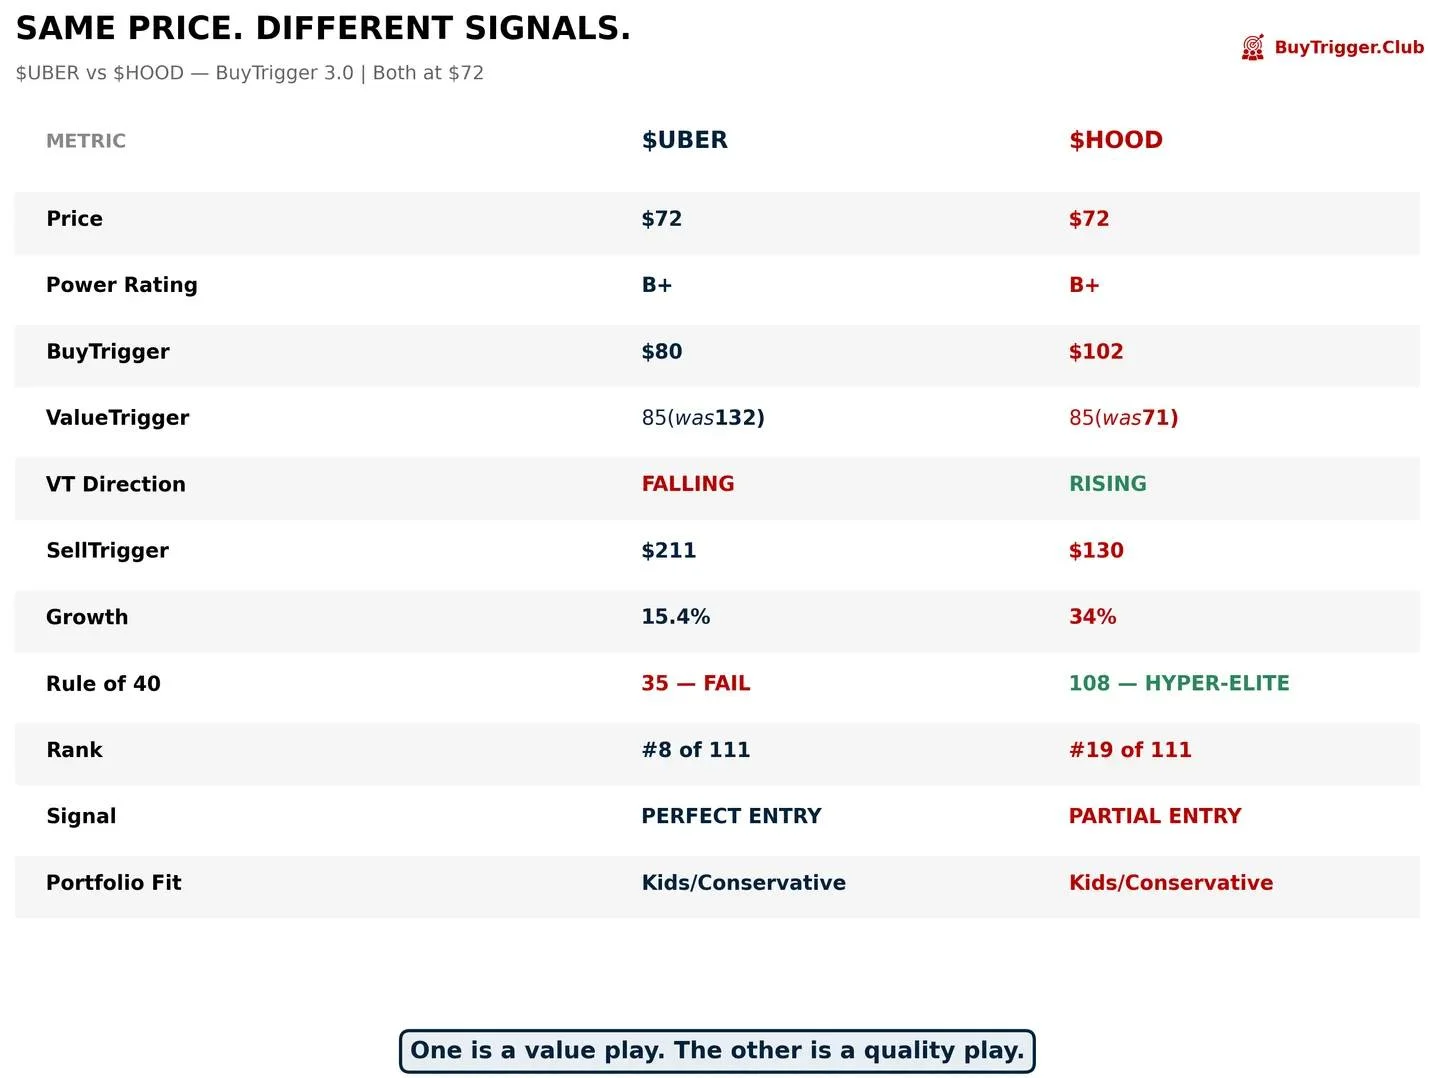
Uber and Robinhood Show Opposite Signals at Same Valuation
Same price. Same ValueTrigger. Opposite signals. $UBER: PERFECT ENTRY. R40 fails at 35. Sleeping giant. $HOOD: PARTIAL ENTRY. R40 at 108 — Hyper-Elite. I sold $UBER at $80. Now my system says buy. I could be wrong about the AV timeline. But the...
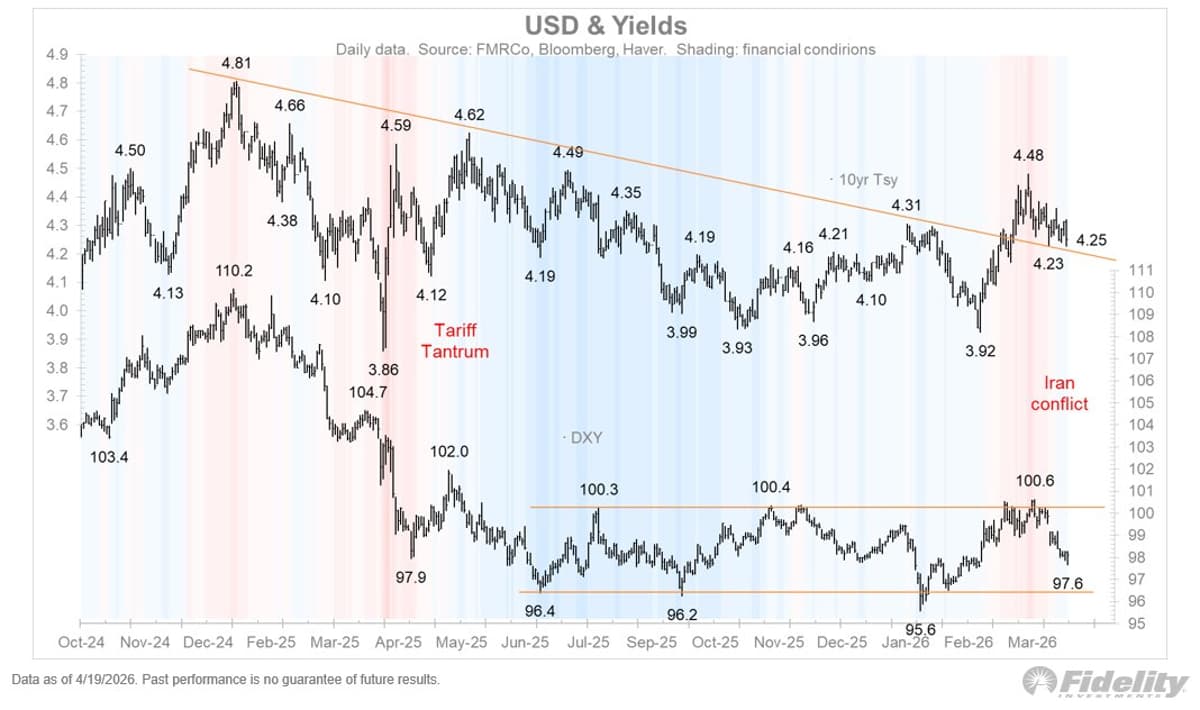
Cease‑fire Stalls Dollar, Hints at Upcoming Decline
Last week’s (week of 4/13) cease fire in the Middle East helped keep the bond market calm and the dollar from surpassing resistance at 100-10. The fact that the dollar’s gains were less than impressive suggests that the next major...
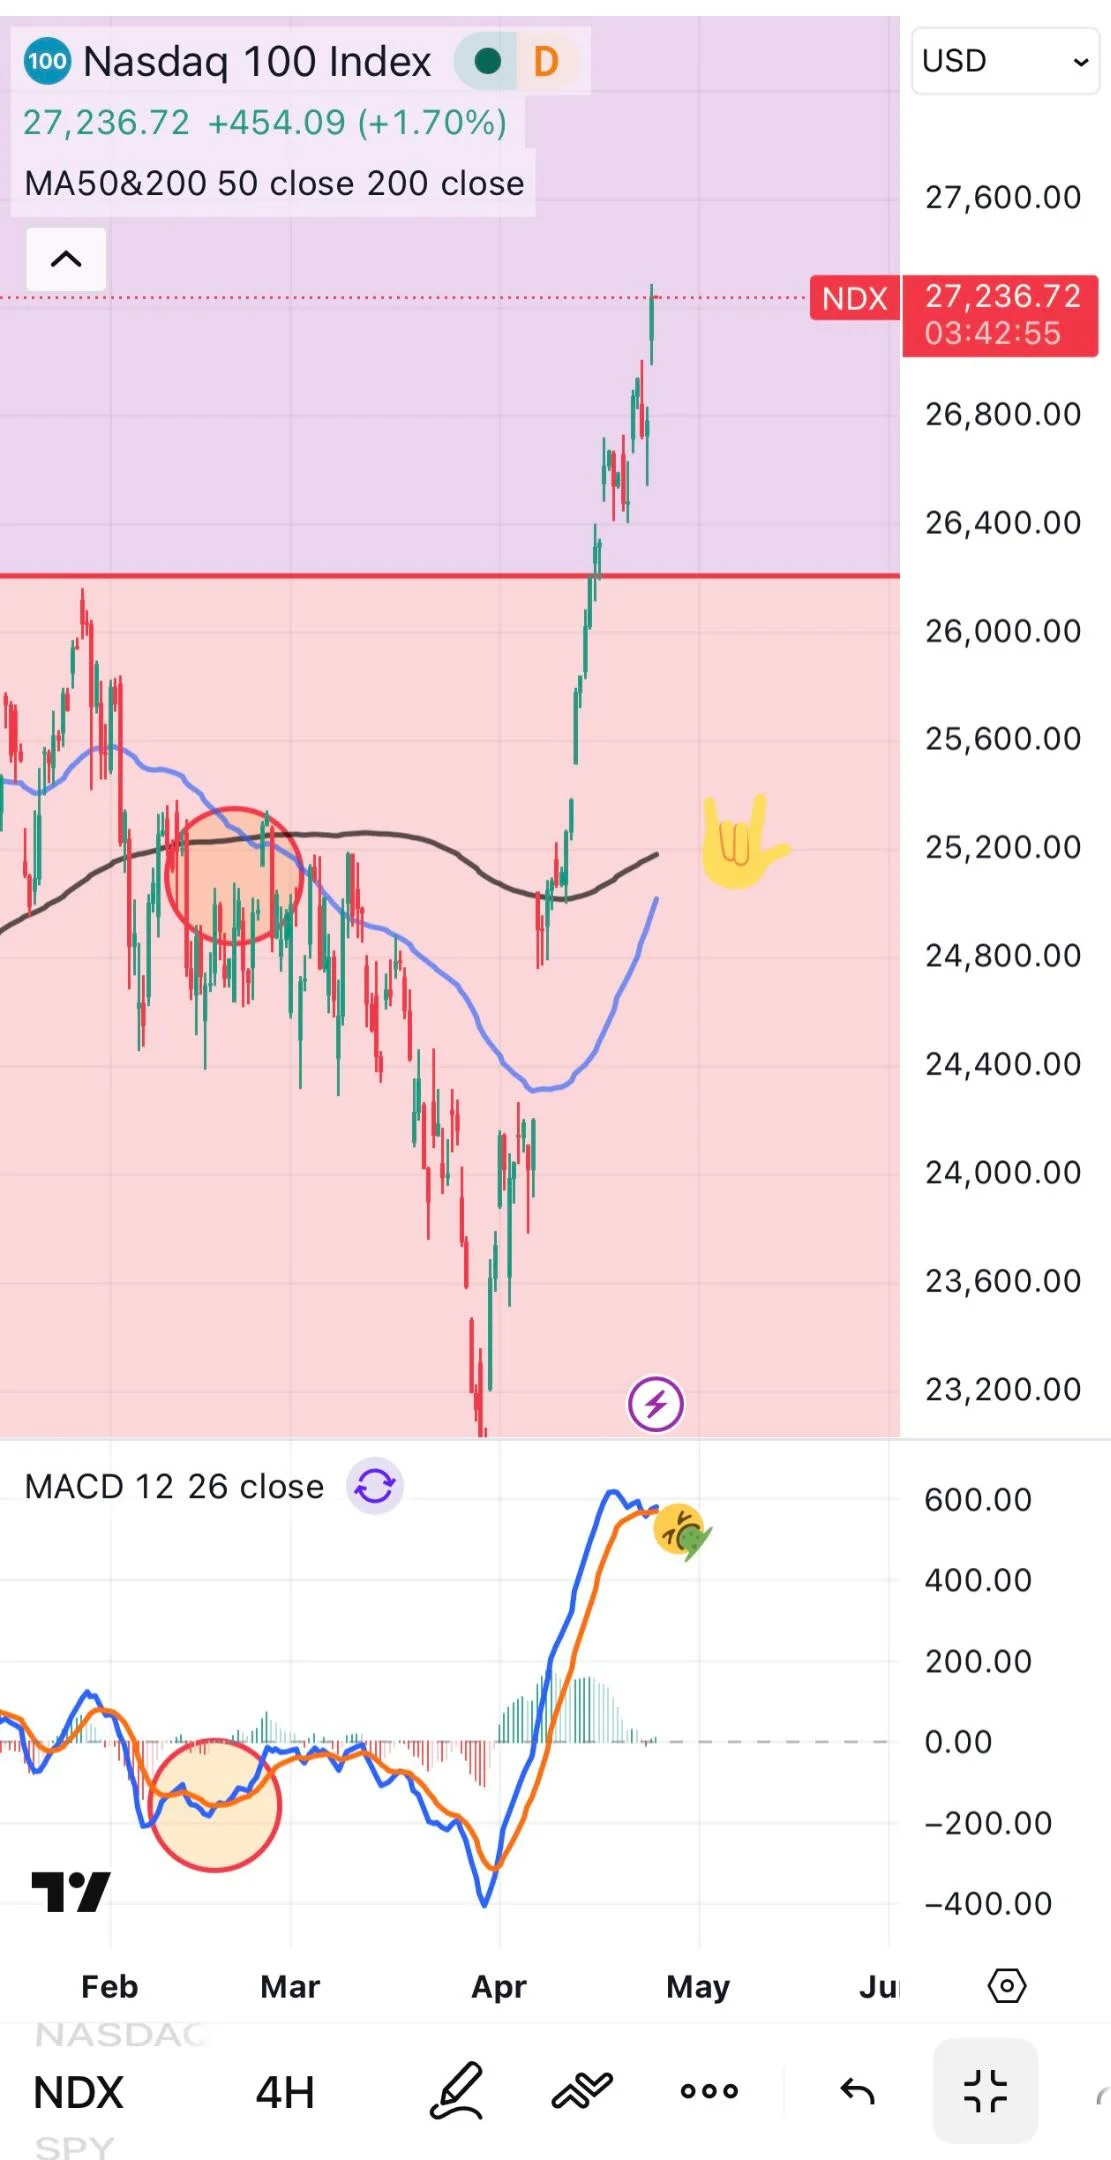
NDX Shows Golden Cross Long-Term, MACD Death Cross Short-Term—Cautious Optimism
The last time I said $NDX deathcross, the market pulled back almost 9%. Today I see a build up golden cross. (Long term) Also a deathX on MACD (short term) This is the biggest dielema crossroad for a while. Enjoy the ride but stay...
Mean Reversion Drives New Positions in IBM, SNPS
Agreed. There is always a mean reversion but for a reason. Added to $IBM $SNPS

Dealers Guard SPX Floor Amid Summer Downside Hedge
What are Vegas odds for gap down Monday? (Likely gets bought in a week, but still.) Dealers are defending $SPX $7100 floor past six days, where $SMH has risen 42% in 19 days - all the while institutions are hedging for...
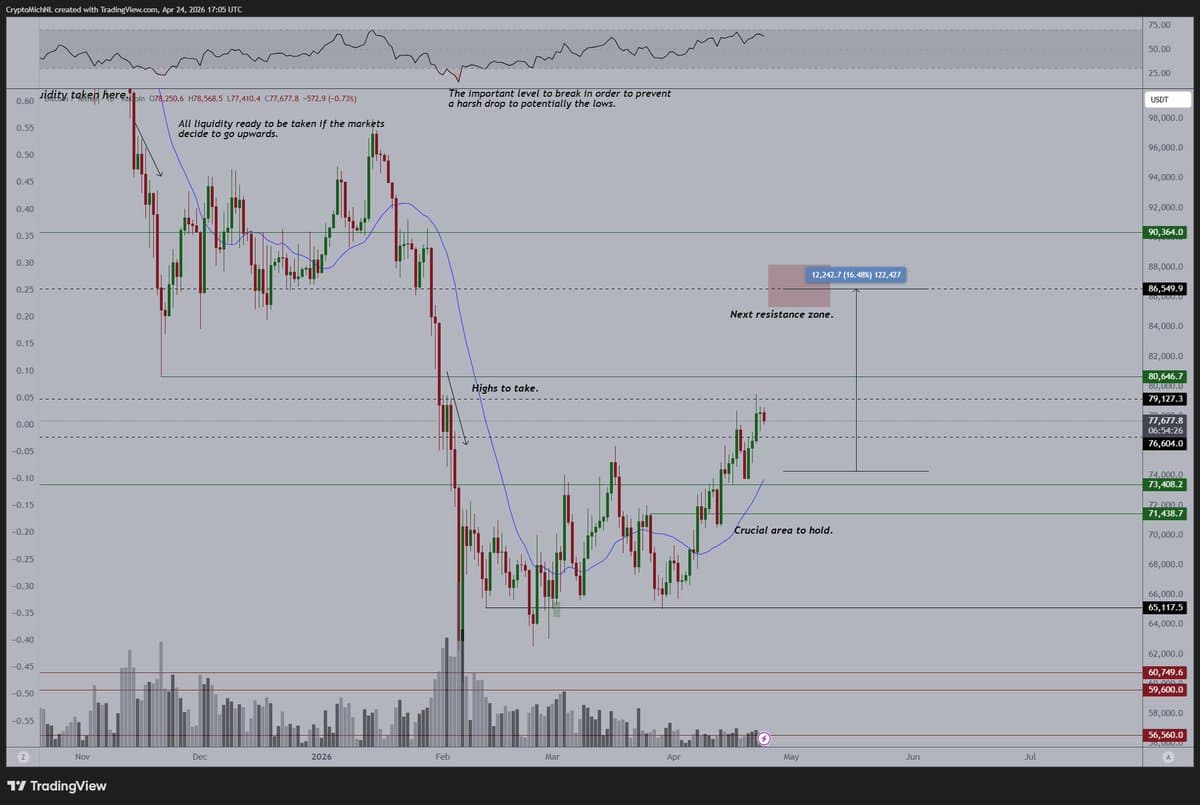
Bitcoin Poised to Break $86K as Markets Rally
The markets are looking for more upside coming weeks. The Nasdaq keeps printing more momentum and #Bitcoin is simply lagging behind. There's no reason to not expect this upside, and I think that if we clearly break $86K in the coming months,...

Leveraged ETF Rebalancing Drives $14B Inelastic Close Buying
Another stall day. At current prices 14BN of inelastic buying must occur on the close. This is heavily front run through the balance of the day. That flow is heavily tilted to NDX and Semis. It...

Six Stocks Hit Lifetime Highs on Strong Momentum
𝗔𝗟𝗟-𝗧𝗜𝗠𝗘 𝗛𝗜𝗚𝗛 𝗕𝗥𝗘𝗔𝗞𝗢𝗨𝗧 𝗔𝗟𝗘𝗥𝗧 🚨 𝗧𝗼𝗱𝗮𝘆, 𝘁𝗵𝗲𝘀𝗲 𝟲 𝘀𝘁𝗼𝗰𝗸𝘀 𝗰𝗹𝗼𝘀𝗲𝗱 𝗮𝗯𝗼𝘃𝗲 𝘁𝗵𝗲𝗶𝗿 𝗹𝗶𝗳𝗲𝘁𝗶𝗺𝗲 𝗵𝗶𝗴𝗵𝘀, 𝘀𝗶𝗴𝗻𝗮𝗹𝗶𝗻𝗴 𝘀𝘁𝗿𝗼𝗻𝗴 𝗺𝗼𝗺𝗲𝗻𝘁𝘂𝗺 𝗮𝗻𝗱 𝘀𝘂𝘀𝘁𝗮𝗶𝗻𝗲𝗱 𝗯𝘂𝘆𝗶𝗻𝗴 𝗶𝗻𝘁𝗲𝗿𝗲𝘀𝘁: 💥 𝗛𝗶𝘁𝗮𝗰𝗵𝗶 𝗘𝗻𝗲𝗿𝗴𝘆 💥 𝗦𝗰𝗵𝗻𝗲𝗶𝗱𝗲𝗿 𝗘𝗹𝗲𝗰𝘁𝗿𝗶𝗰 💥 𝗔𝘁𝗹𝗮𝗻𝘁𝗮 𝗘𝗹𝗲𝗰𝘁𝗿𝗶𝗰𝗮𝗹𝘀 💥 𝗧𝗗 𝗣𝗼𝘄𝗲𝗿 𝗦𝘆𝘀𝘁𝗲𝗺𝘀 💥 𝗔𝗨 𝗦𝗺𝗮𝗹𝗹 𝗙𝗶𝗻𝗮𝗻𝗰𝗲 𝗕𝗮𝗻𝗸
Intel’s Surge Hits 26‑Year High, Yet Overpriced
Intel (INTC) just broke its dot-com peak for the first time in 26 years. $81.86, +22.58% today, +100% YTD, +224% in a year. The Street is writing "we were wrong" notes this morning. Here's the honest read on what happened last...
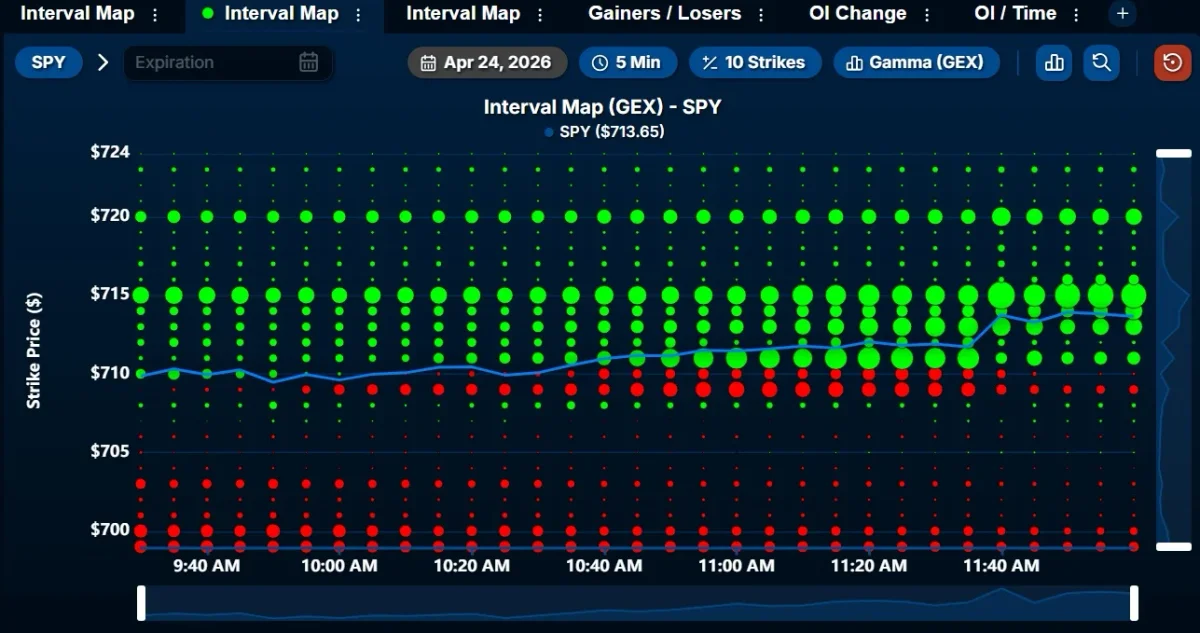
SPY Gamma Exposure Peaks at 715, Watch for Rejection
Gamma exposure update for $SPY: $715 has been lit up with positive exposure all week. We're now approaching that strike, be cautious of chop/rejections as we near it. I've got support at $711, positive exposure above and below spot.

Market Divided: Utilities Up, Treasuries Split, S&P Near
Utilities outperforming. Treasuries diverging. S&P sitting just below its 200-day moving average. The intermarket signals split 2-2 for first time since February. What does a market divided mean for your portfolio? https://t.co/bTNJ1cQFiS
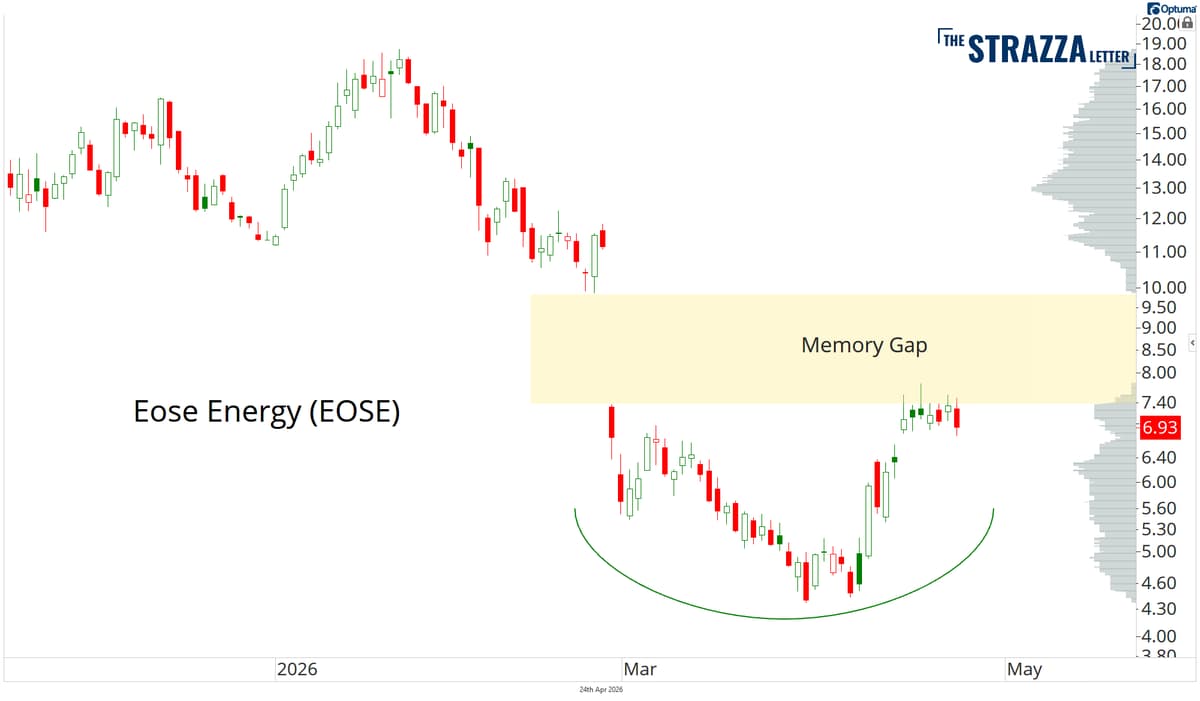
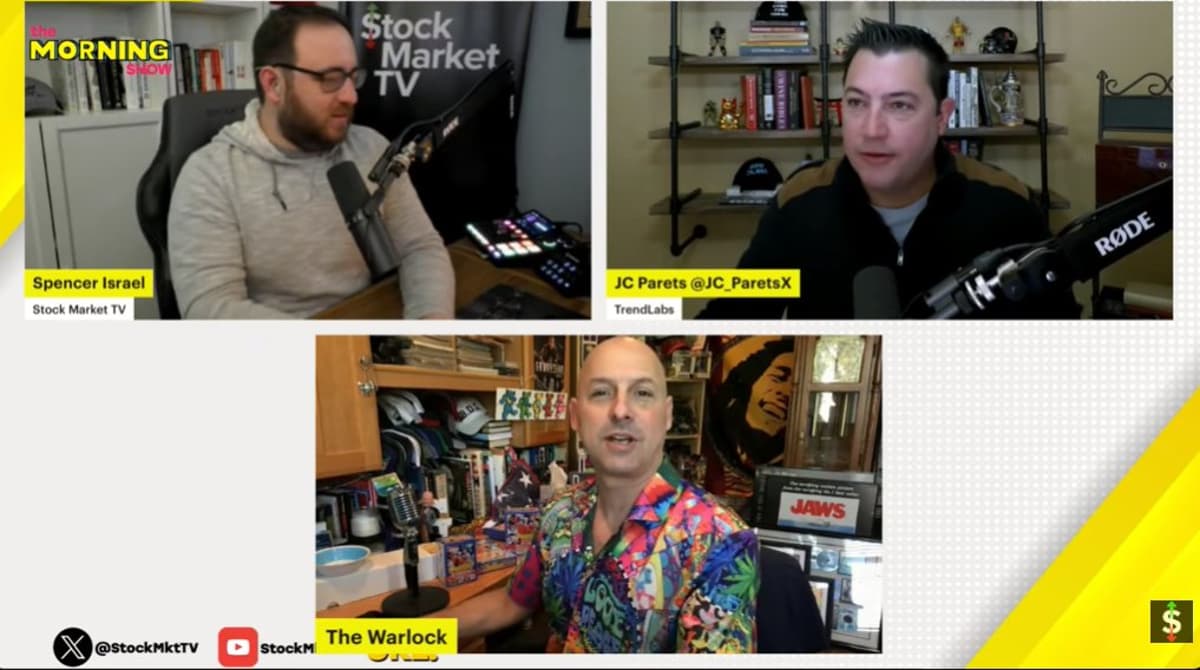
EOSE Jumps 15% Amid Market Squeeze
Talked about this one today on The Morning Show The squeeze is on! $EOSE +15% https://t.co/yB1fuXjbke
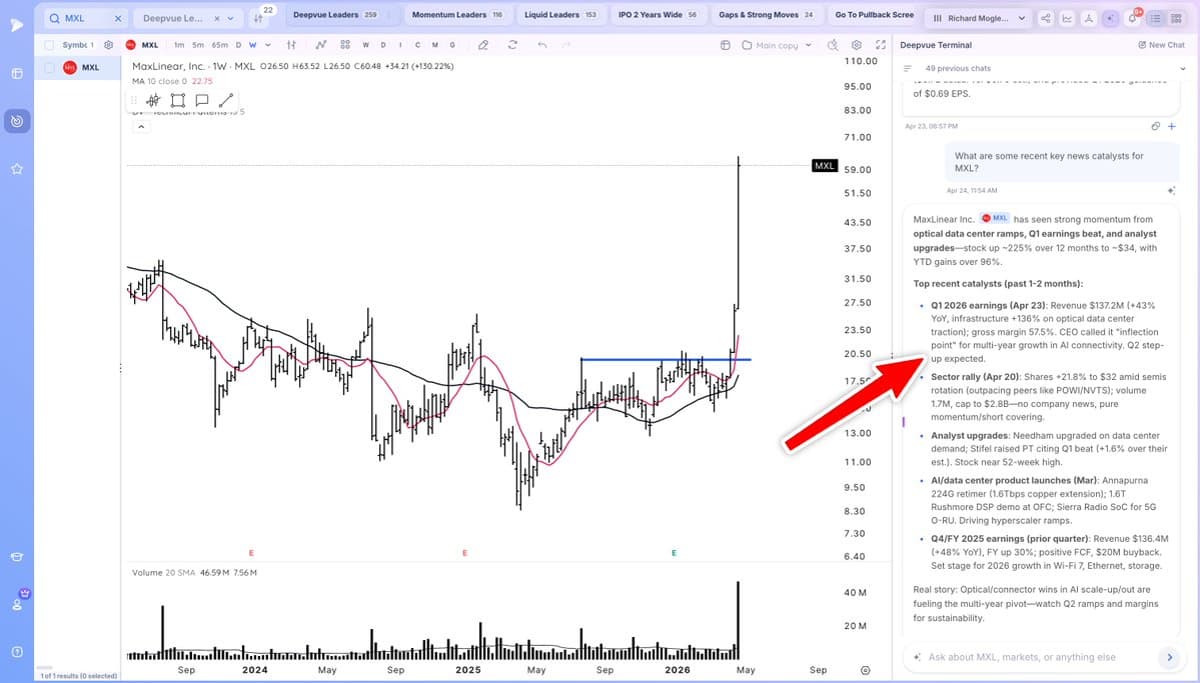
MXL's Weekly Chart Explodes After Years of Neglect
The weekly chart for $MXL is insane Years of neglect and now look at the volume. And @Deepvue AI shows recent catalysts https://t.co/q9l9wjTGv7

Lilly Slides as FDA Plans Psychedelic Voucher Program
Lilly tumbles on Foundayo’s shaky week; FDA to issue vouchers for psychedelics https://t.co/kWvYtFeif0 $LLY - 4% $NVO + 6% $REGN $AMGN $BBOT #biotech
Watch the Breakout Trading Webinar Replay Now
I just posted the replay of my webinar from yseterday on finding and trading breakouts Check it out here https://t.co/oPeOKzZpAr
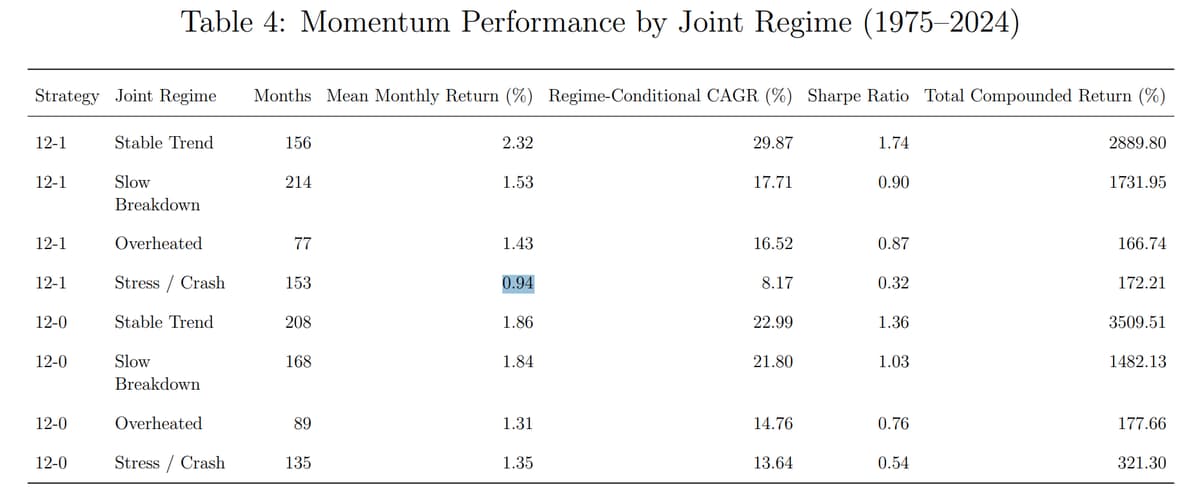
New Study Shows Momentum Rule May Be Misleading
New research challenges a long-standing rule in momentum investing—and reveals surprising insights about when to use it. For decades, investors using momentum strategies have followed a simple rule: ignore last month's returns... by @larryswedroe https://t.co/jDqbpjntVy https://t.co/hM0hl6R431
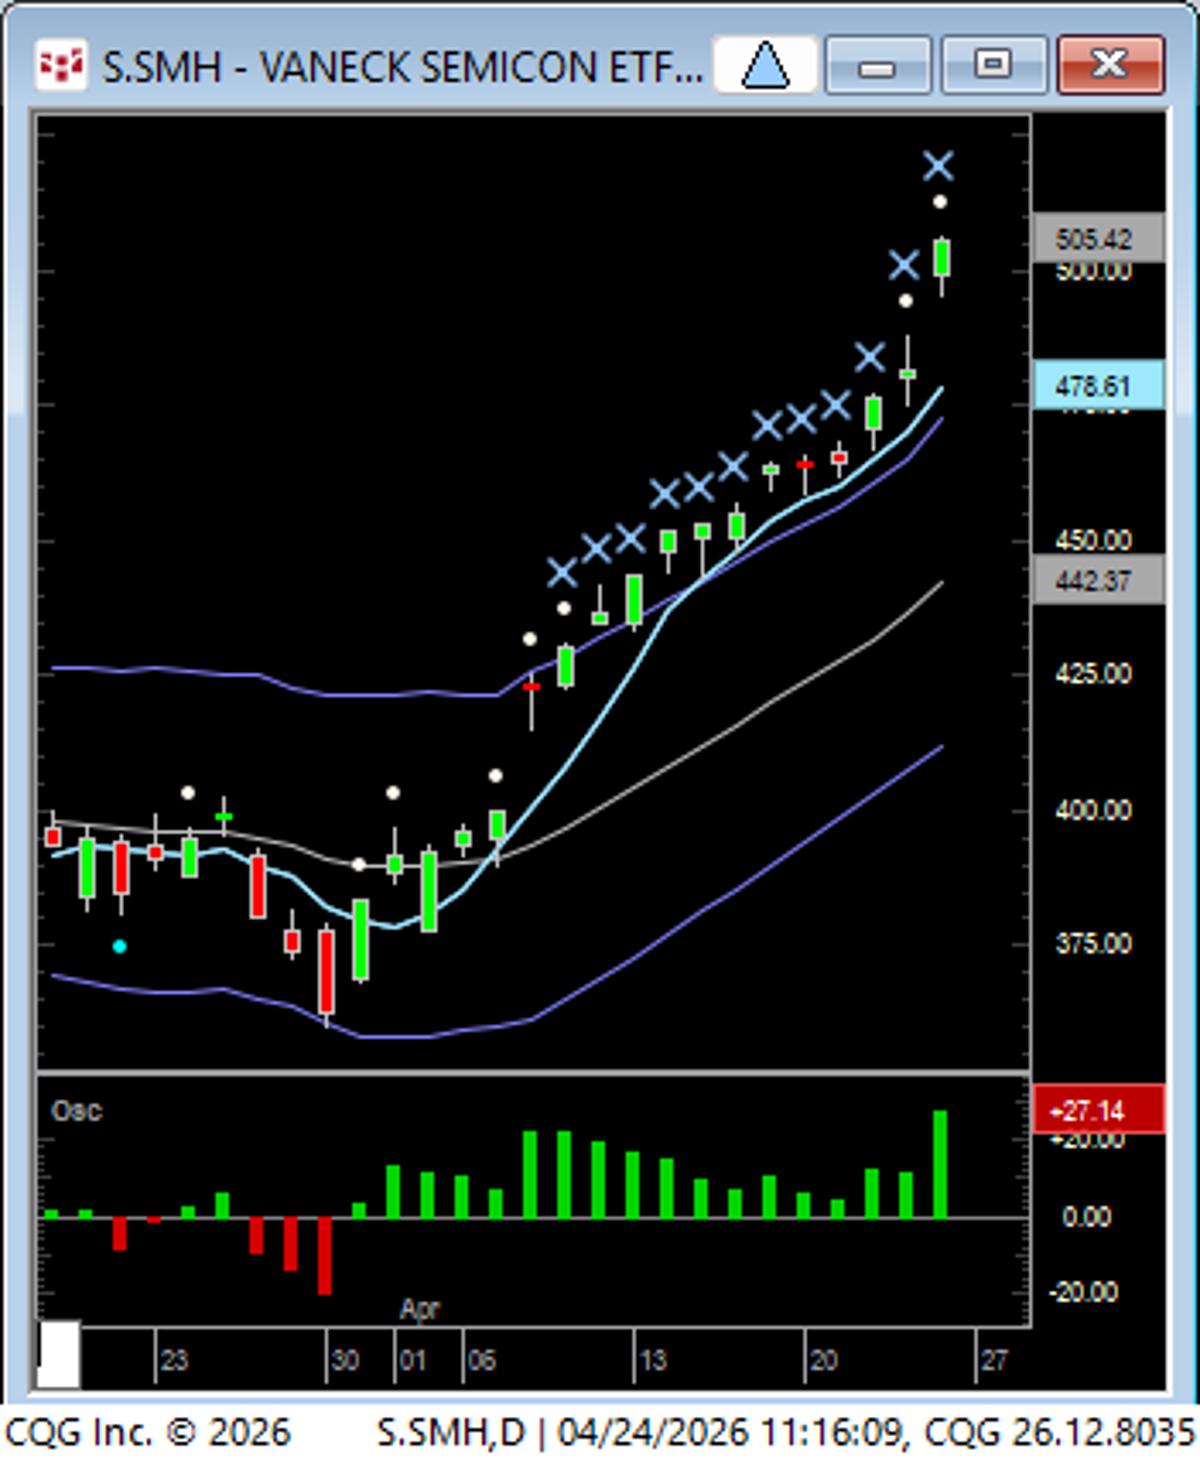
5‑SMA System Thrives on Unbalanced Higher‑High Runs
SMH: lessons in relative strength. This is an example of a market that has NOT come into balance yet, but instead has been making consecutive higher highs, aka, "one time framing". These are the runs that the 5...
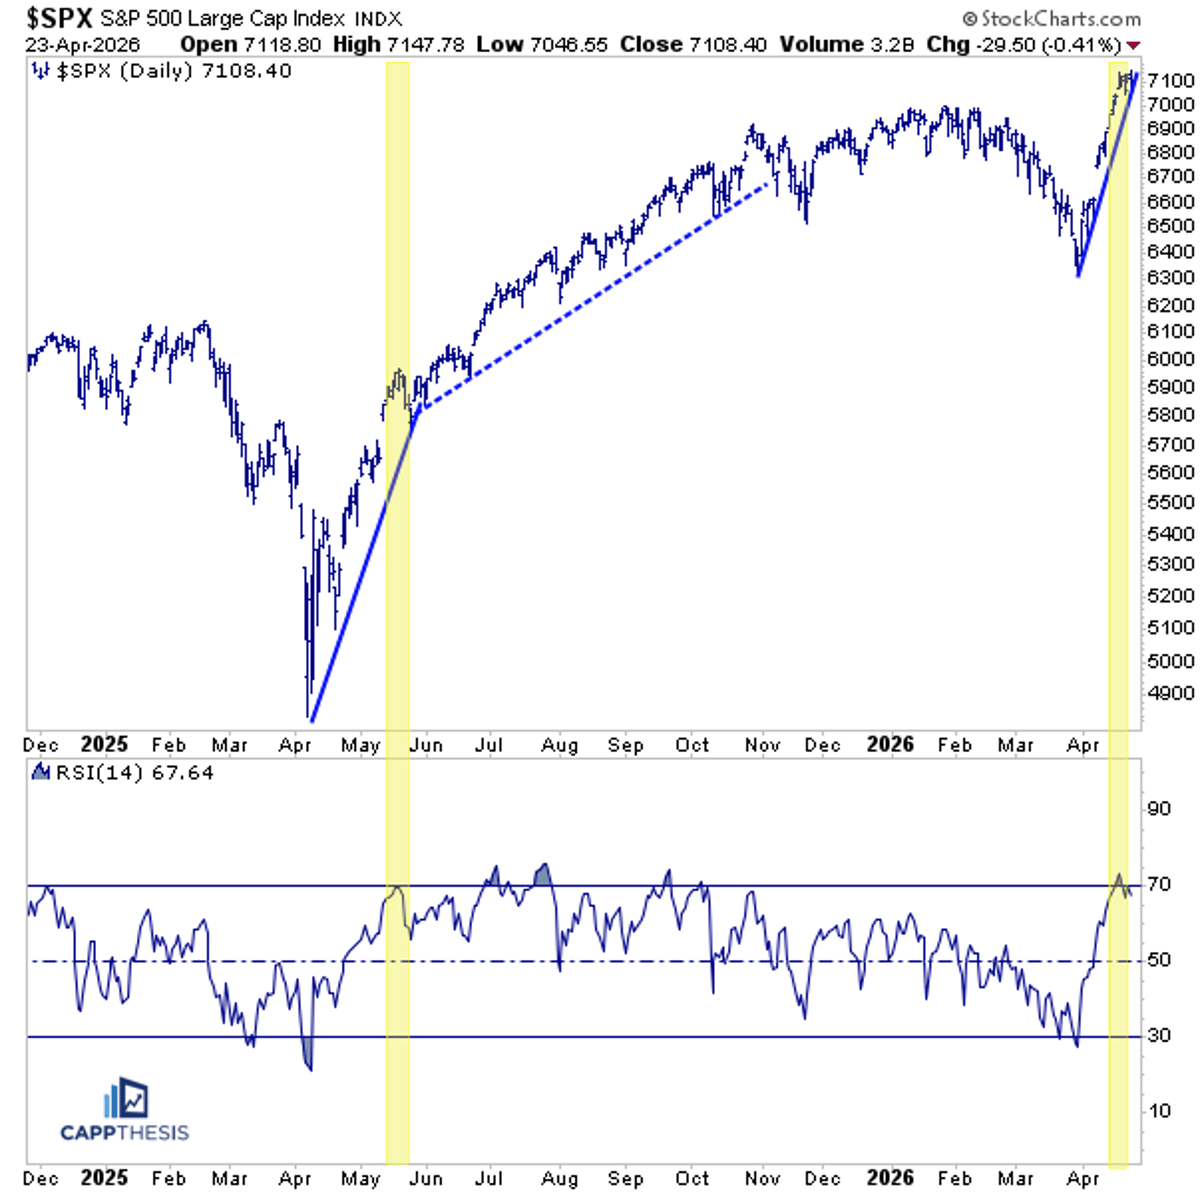
SPX Overbought, Trend Likely to Flatten Soon
$SPX just hit overbought for the first time since September and remains in a steep uptrend. This mirrors last spring: after first tagging the RSI’s 70 threshold, momentum cooled, but the trend held and simply flattened. The next phase now...
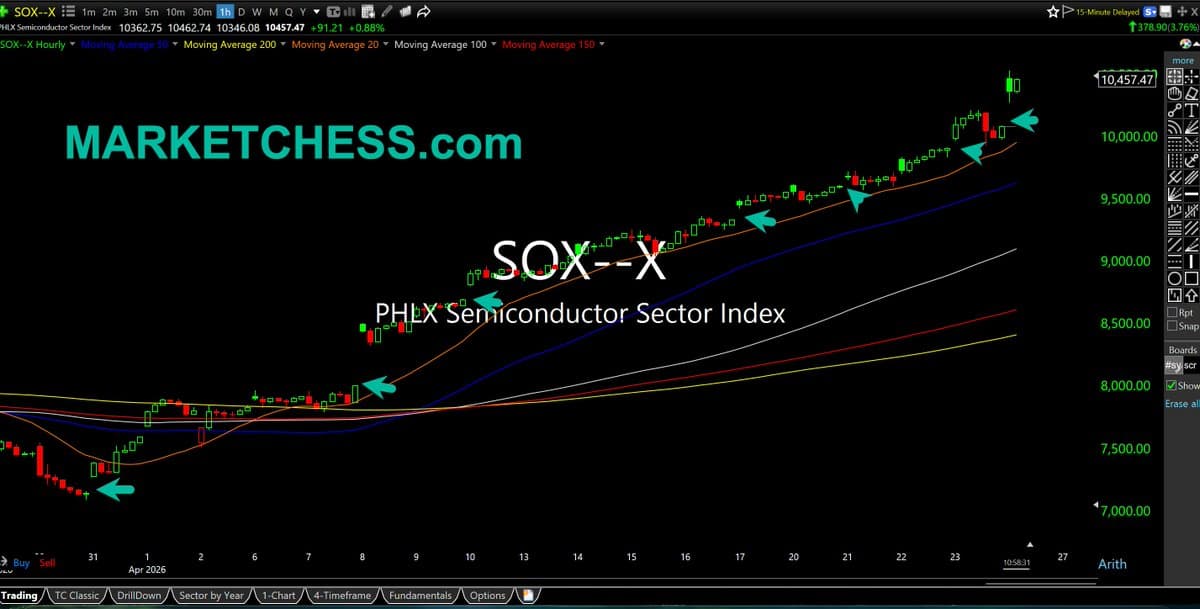
Unfilled Gaps Signal Potential Parabolic Blow‑Off Top
$SOX Hourly. Philadelphia Semiconductor Index. Easy to lose track of how many gaps (most unfilled) since just the end of March. This is outlier action, and rhymes with historical parabolic blow-off tops. https://t.co/IdzUeem8Ga
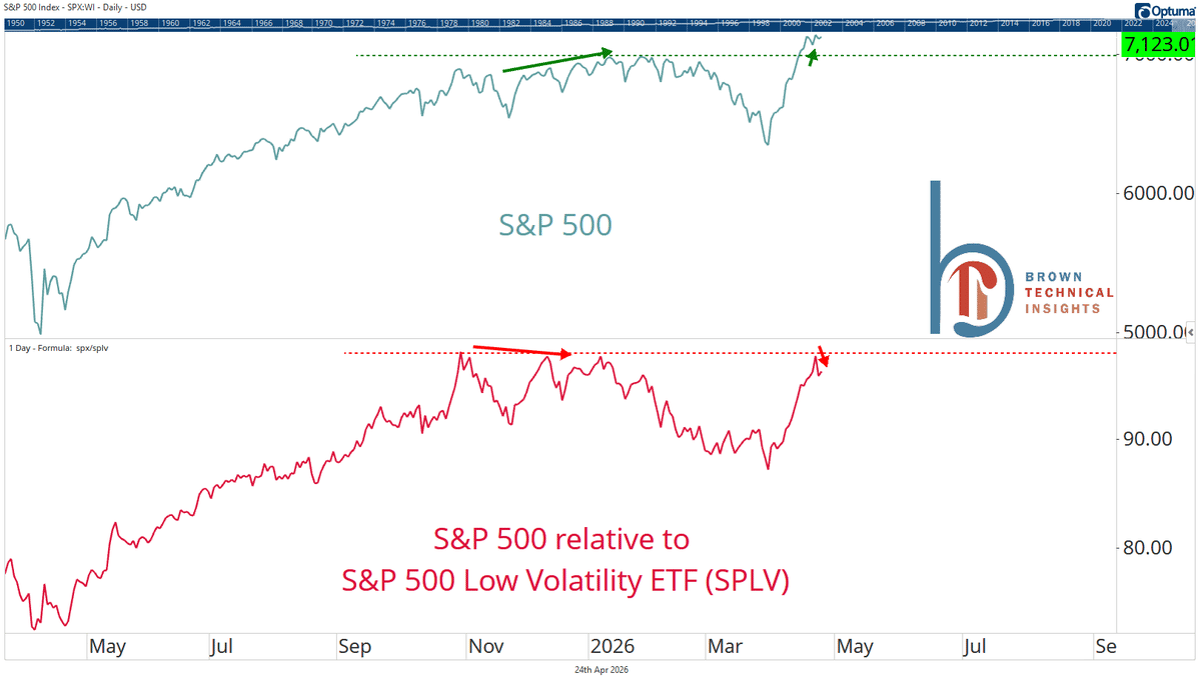
SPX Diverges From SPLV, Fails New Highs
Not fatal, but a divergence to watch near-term is SPX vs. SPLV. Failed to make new highs with the index last week (just like the fall) and turning lower at resistance this week https://t.co/Jvl11woJOk
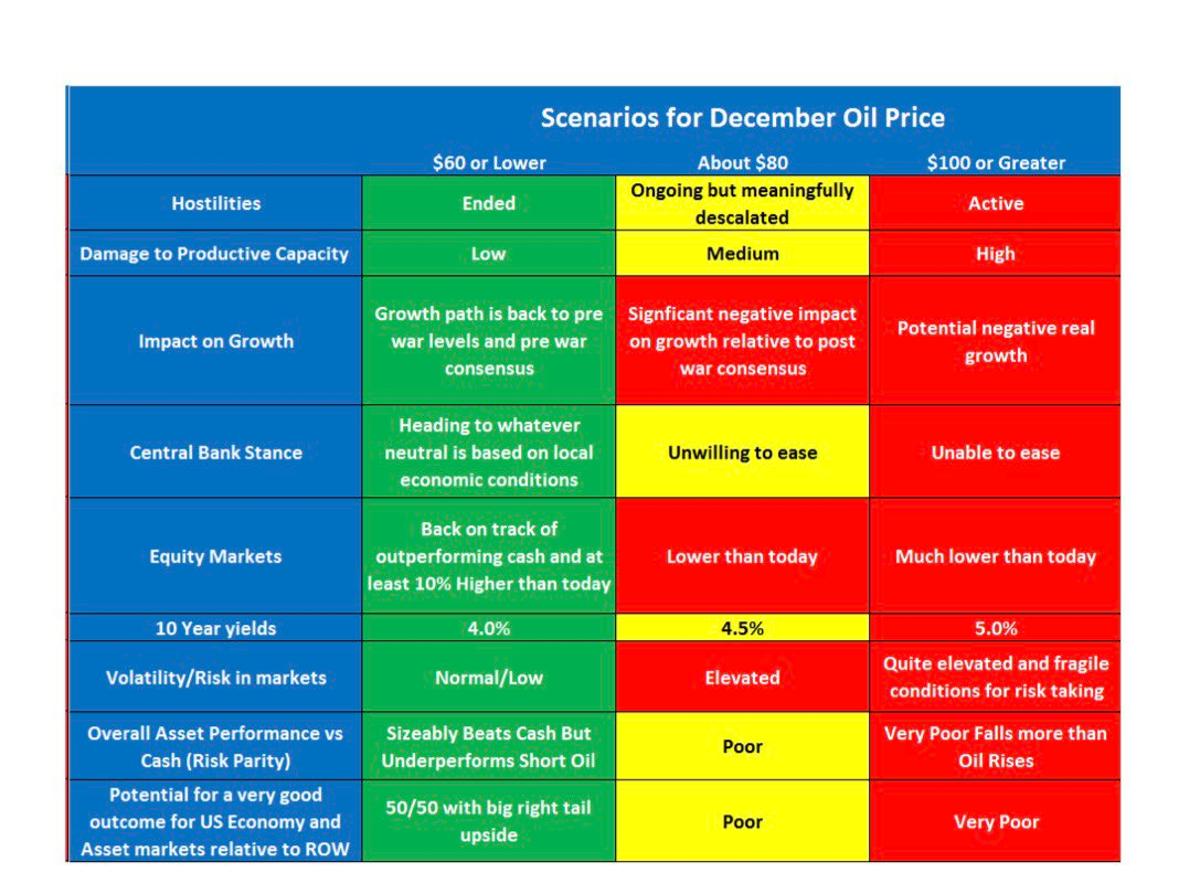
Pairing Short Oil with Short Stocks Beats Single Trades
Because people are narrow minded and can't think. Let me clarify. Also feel free to ask a question instead of asking your guru to explain in chats. I could be wrong of course but my view shouldn't have...
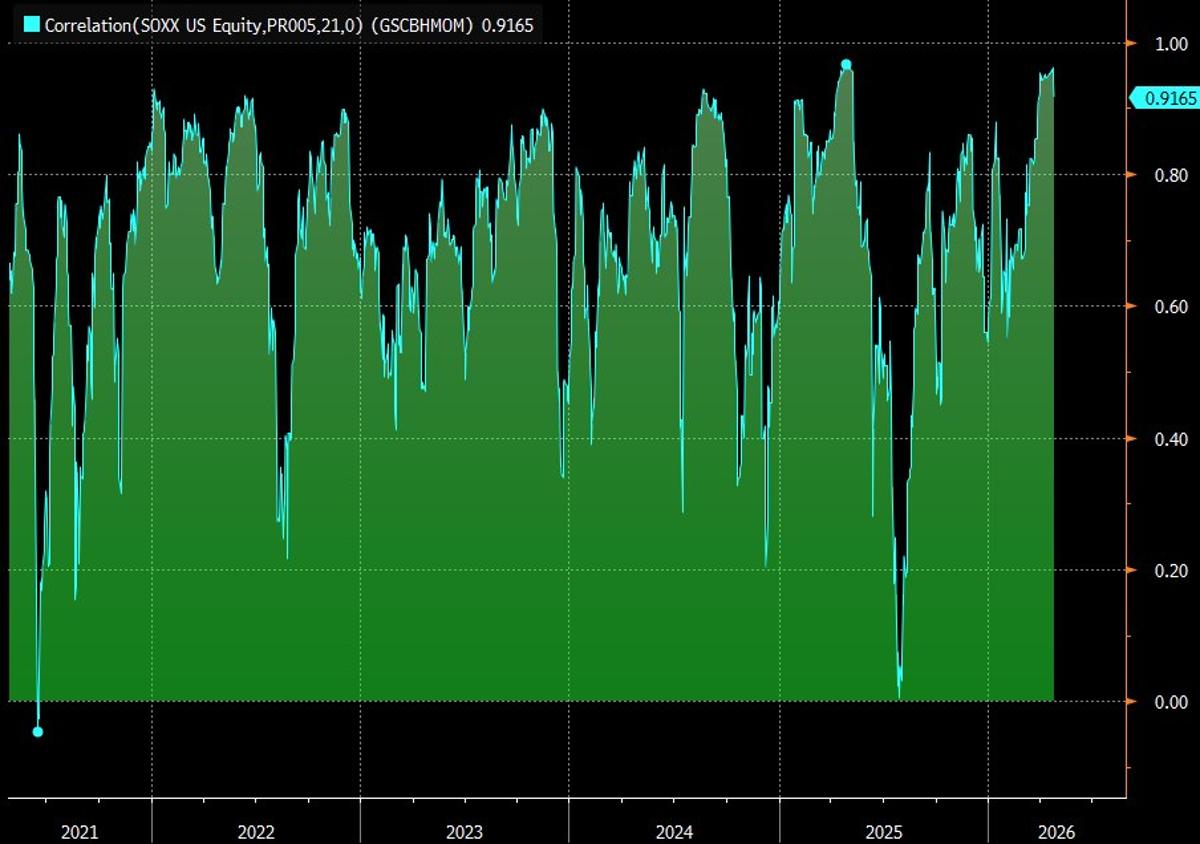
SOXX‑Beta Basket Correlation Peaks Since 2025 V‑Recovery
You can’t spell semiconductors without “V”* 21-session correlation between $SOXX and Goldman’s high beta momo long basket hasn’t been this strong since the April 2025 V-shaped recovery *well you can, but https://t.co/Y5jw7I7M1H
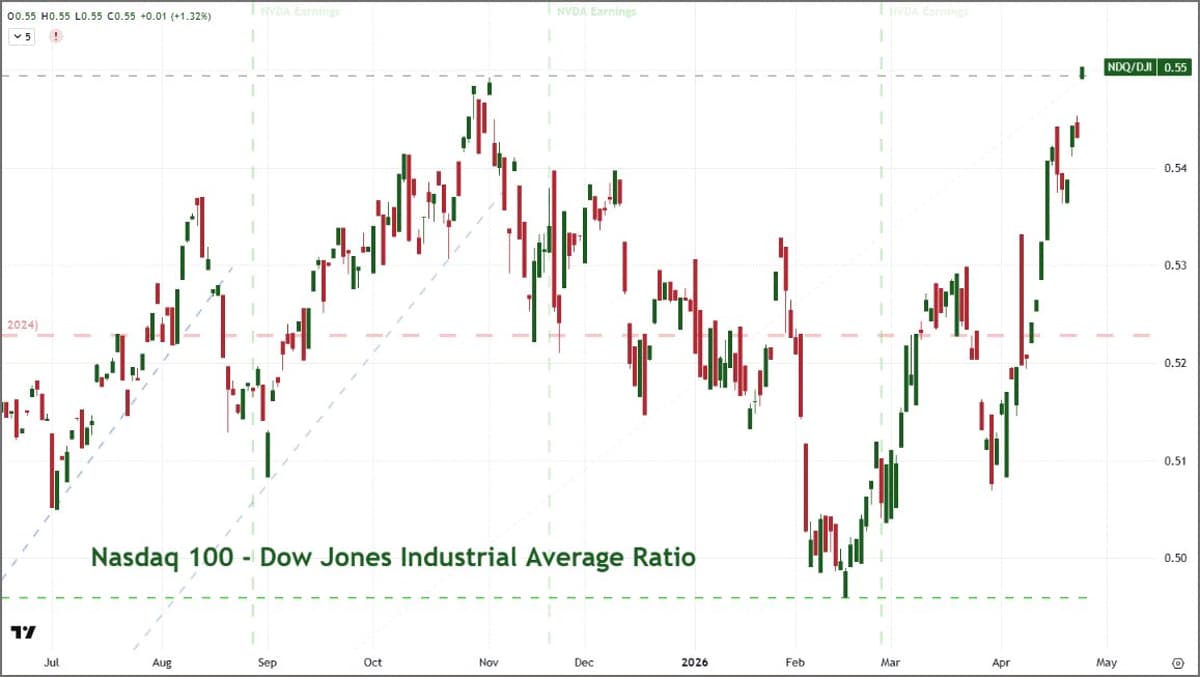
Nasdaq/Dow Ratio Hits Record, Tech Leads Market
The Nasdaq 100 to Dow ratio (tech to blue chip) gapped to a record high this morning - overtaking October's previous peak. Intel earnings certainly helped. Is this a sign that AI and tech is a leading theme again? Is...

AMD Shows Value of Adding to Let‑it‑ride Pile
$AMD a great example of why I like to get names to the let it ride pile. Upping the stop again
SMH's 33% Four‑Week Surge Signals Potential Top
$SMH rallied 33% in the last 4 weeks. Since 2009, it rallied 27%+ in 4 weeks only 3 other times: after the 2020 Covid crash, after the 2022 bear market low, and after the 2025 tariff crash. Add to that...

Euphoric Markets Signal Imminent Bear Turnaround
Woke up, checked the markets. Everything green. Bulls are high-fiving each other. And I'm sitting here thinking — this is exactly when it gets dangerous. The tape feels euphoric right now. That is not a bullish signal, that's a warning....

Markets Overbought, Expect Pullback; Trader Sets Stops
Hey, it is Friday (my least favorite day to trade) the markets are stretched and for the health of the market (QQQ, SPY etc.) they need to start basing. Doesn't mean they will. They can continue to...
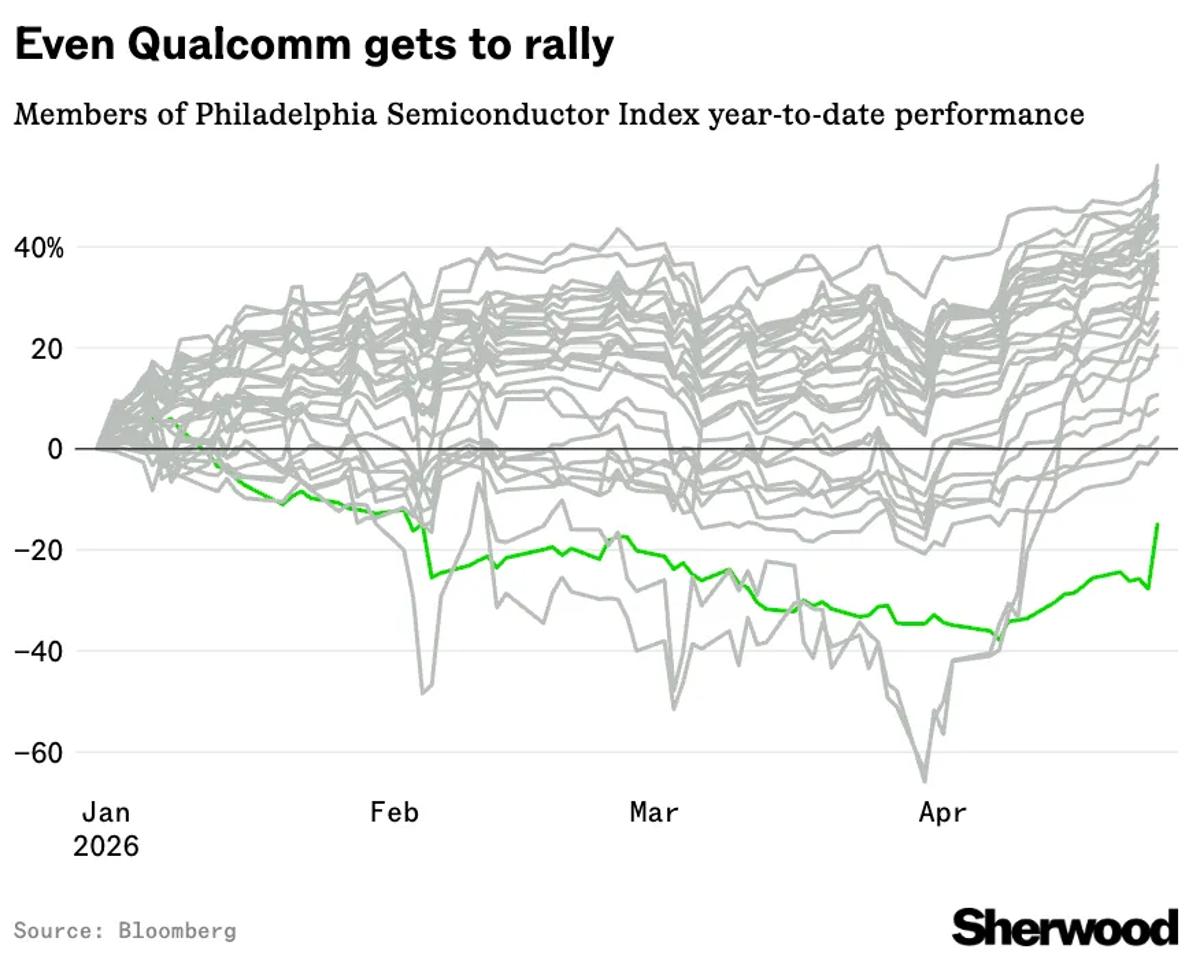
Chip Rally Lifts Qualcomm Stock Higher
The chip rally is so intense that even Qualcomm gets to go up $QCOM https://t.co/JHUQyG5MUs https://t.co/yQSvYsEvZ4
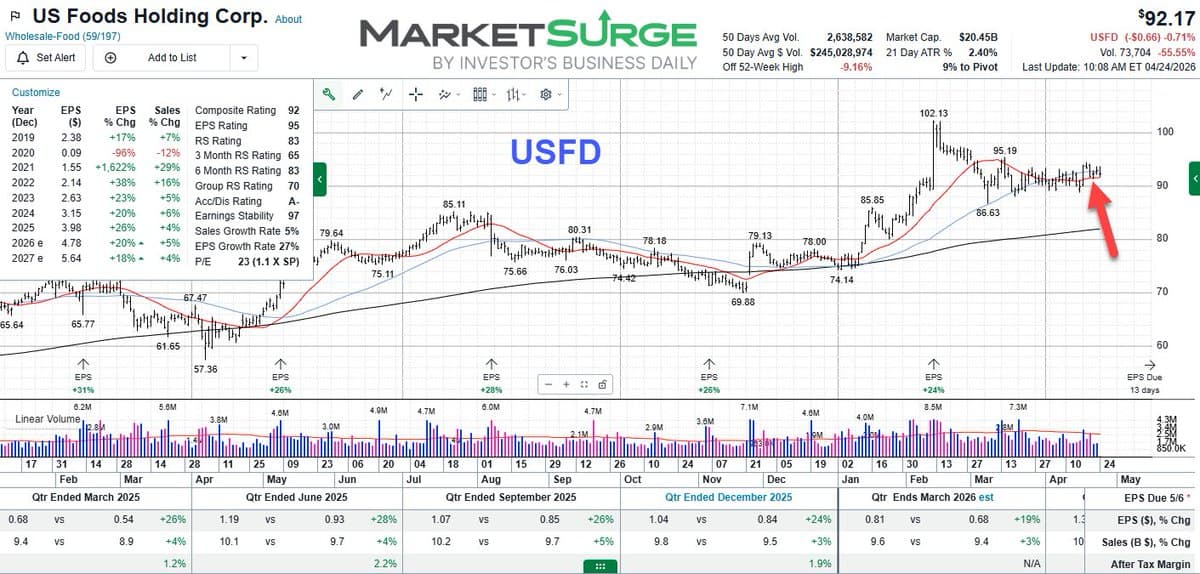
Tight Range in Defensive USFD; Watch for Break Below 20‑SMA
Nice tight range in a more defensive name $USFD no position yet, make the trade your own, my worst case stop would go below the WTD low at the 20sma chart from @marketsurge https://t.co/IHDzkzl0Sw
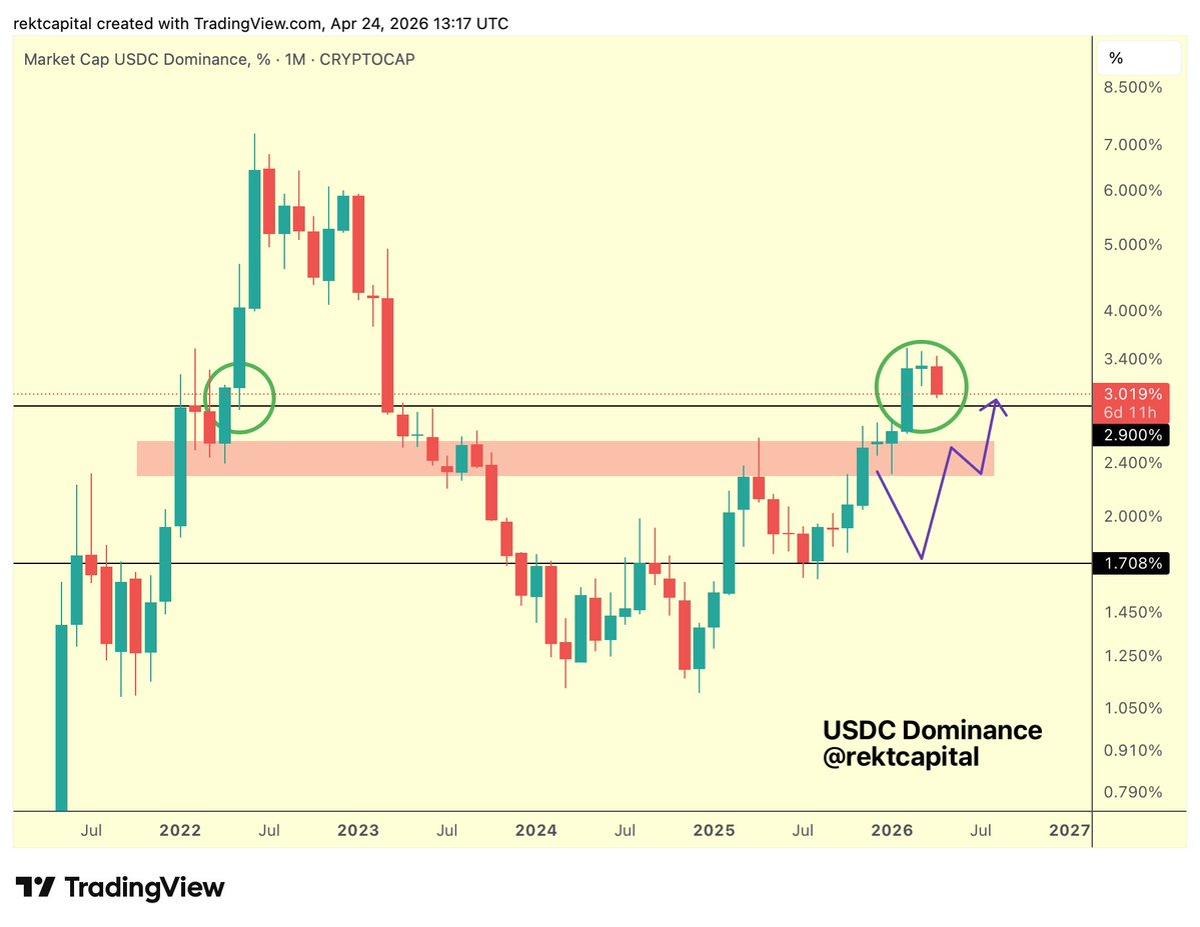
USDC Dominance Set to Retest 2.9% Support, Signals
I posted this analysis on $USDC Dominance a year ago And #USDC Dominance has followed the purple pathway perfectly And the fact that the pathway was followed so closely indicates a strong respect of historical cycles As a result USDC Dominance will likely...

Updated Equity Rally Outlook and Quant Model Status
Joined @TheKEReport yesterday to update our outlook for the equity rally & status of our quant models. Also touched on the technical picture for software, semis, and the metals complex. Check it out... $IGV $SPY $SMH $SLV $GDX https://t.co/stOrJq6zle

IBM Put Position Rolled to June 220, Strangle Ends
rolled short $IBM Apr 24 Exp 235 puts down and out to June 220 puts, calls from Strangle expire today.

QCOM Rally Spikes; Consider Adding Before Earnings
$QCOM on the move this morning raised all stops and watching to put some into let it ride. ER soon
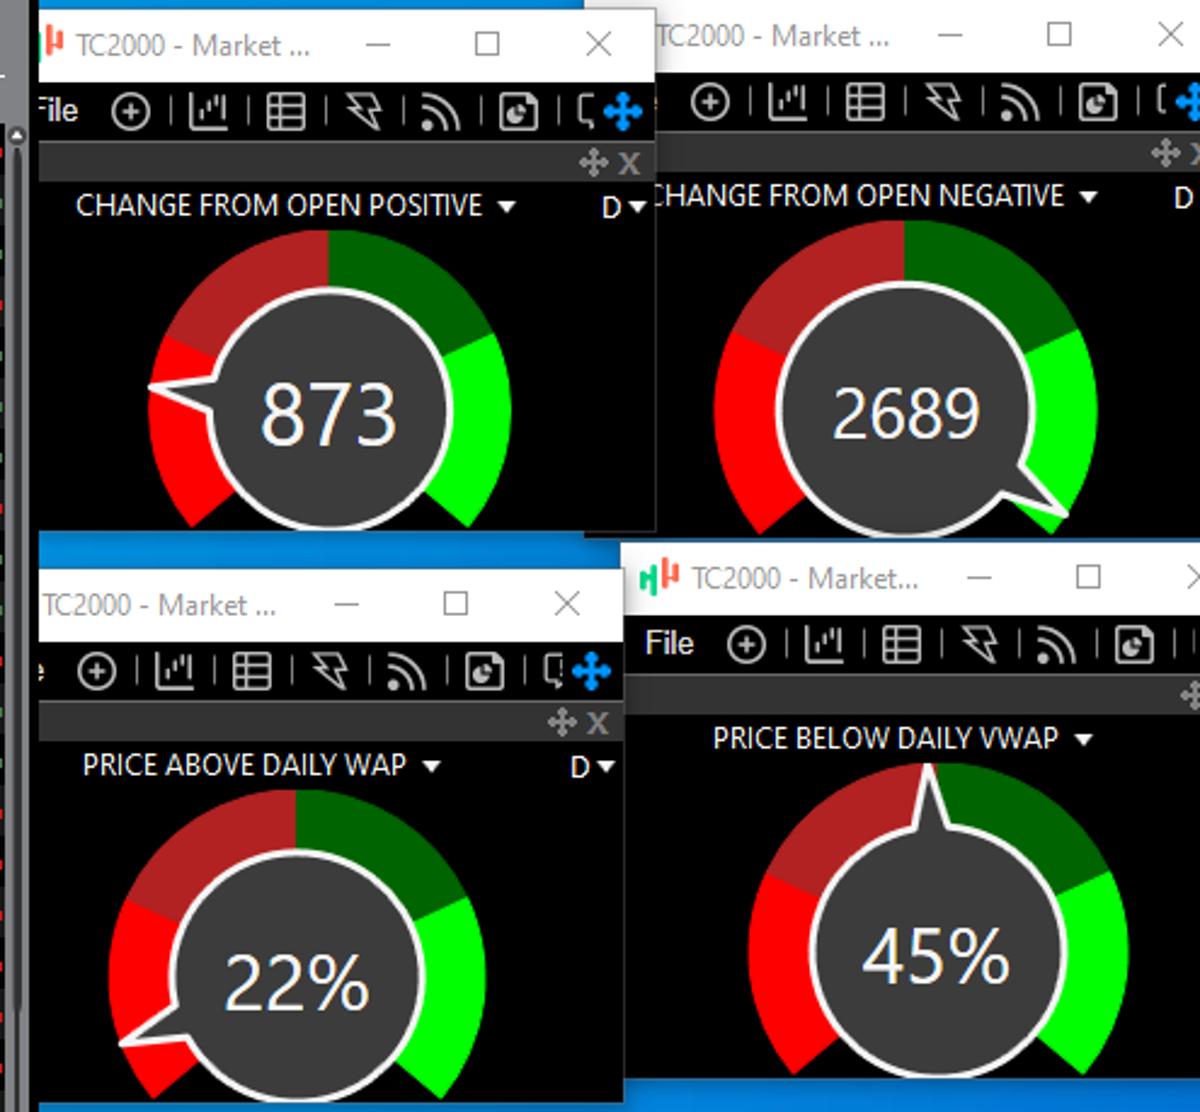
Early Market Breadth Shows Mixed Open Changes vs VWAP
Early breadth: • Change from OPEN, + vs - • % above/below daily vwap https://t.co/MuGblsqmyX
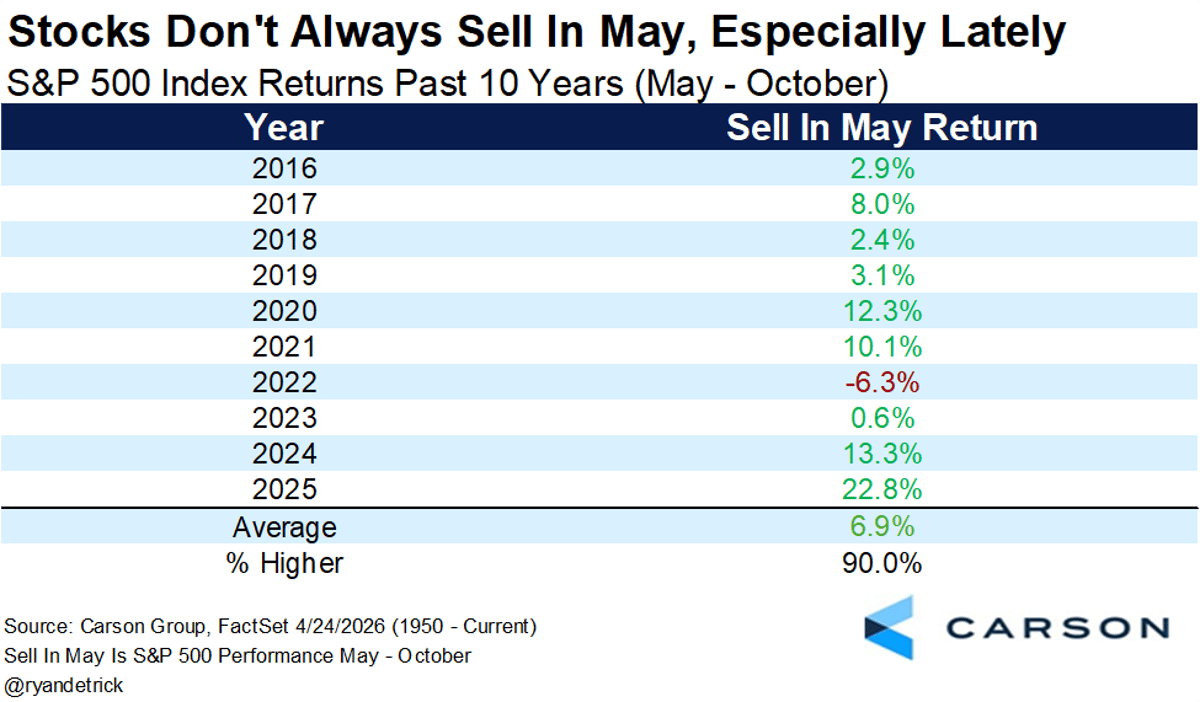
Sell‑in‑May Returns Surge Again After Historic 2023
Yes, the worst six months are coming up soon (May - October). But these six months have been lower only once the past decade and last year was the greatest Sell in May return ever (+22.8%). We are expecting another strong...
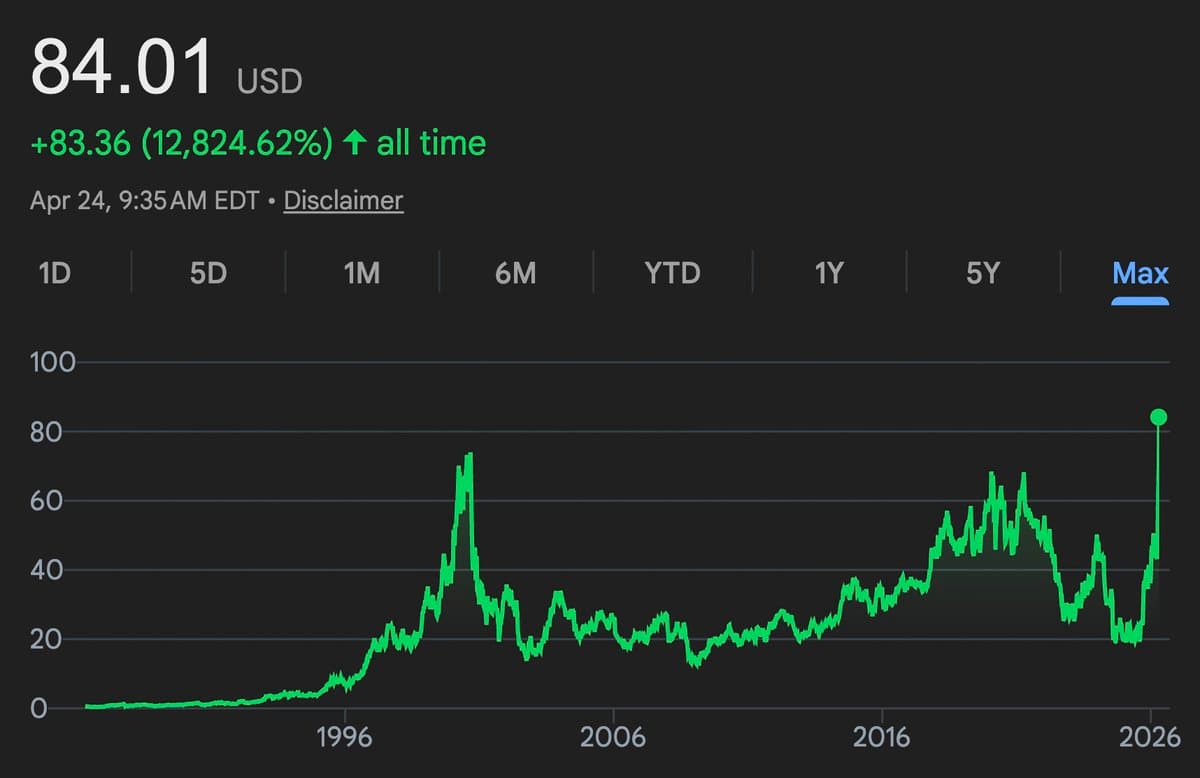
Intel Surges 24%, Reaches 2000‑era High
JUST IN: Intel $INTC jumps 24% at the open, passing its highest level since 2000 https://t.co/wmIFpIEeYC

Sell April 24 60/75 Strangle for $1.55 Credit
$INTC "Trade Idea 4: Sell the April 24 Expiry 60/75 Strangle for a $1.55 credit."puts expire. Will need to roll calls up and out
Micron Set to Soar as Samsung Strike Spikes DRAM Demand
Few large specialists chiming in on $MU (memory) more bullish than ever. more server (or even client CPUs) means a lot more DRAM . MORE importantly SAMSUNG indicated a STRIKE, which cause $MU to surge https://t.co/7KhGWVDVdH
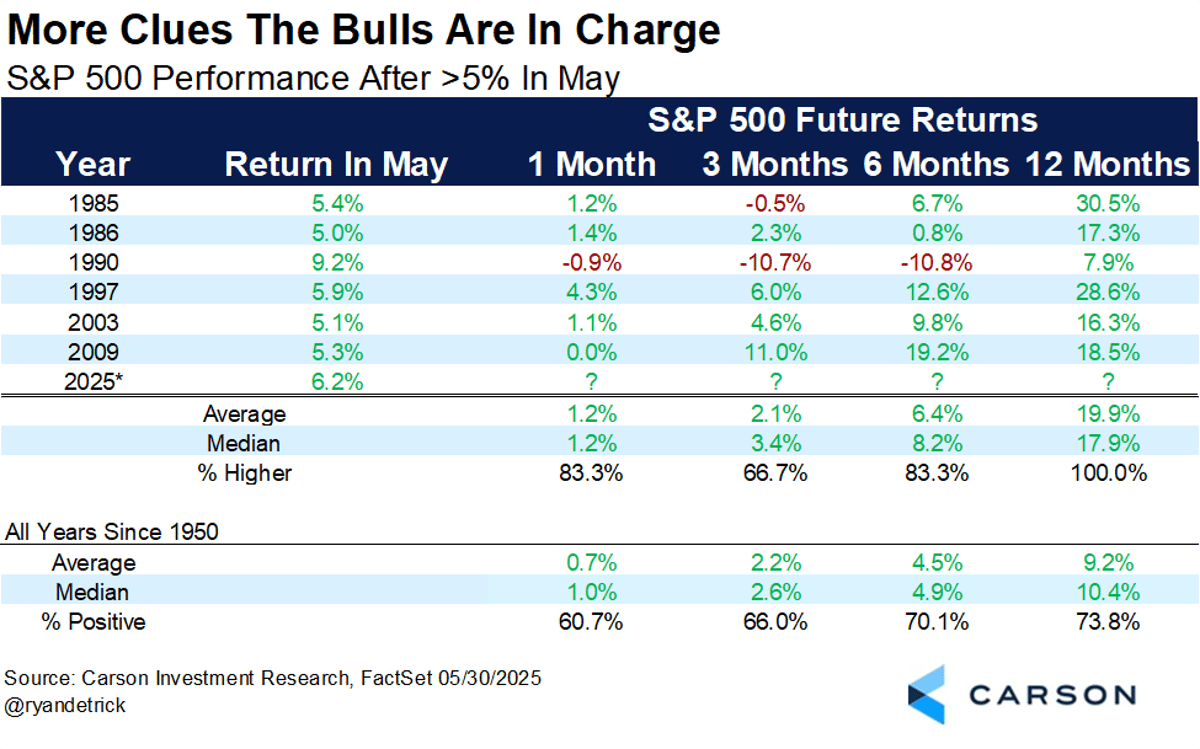
May Gains >5% Signal Strong Year-Long Returns
We shared this last year, but amazing how well it played out. Historically, no month sees better future returns when it is up >5% than May. Up 19.9% a year later and never lower. https://t.co/HxIeQFLYDa

CPU Resurgence Fuels Gains for Intel, AMD, ARM, Qualcomm
$INTC, $AMD, $ARM, $QCOM all about to open higher on the great CPU resurgence. Expectations are $QCOM fleshes out their data center CPU/accelerator strategy soon.
Kenny Glick Shorts Intel Live on StockMktTV
We got Kenny Glick @HitTheBidRadio out here shorting Intel today LIVE on @StockMktTV. You gotta hear this https://t.co/tQrme2O2I3 $INTC https://t.co/GRSjyN5SI1

Geopolitical Whispers Fuel Market Volatility Ahead of Central Bank Decisions
Iran headlines are driving everything today $DXY pulled back hard off its highs $SPX whipsawing $CL all over the place No US data on the calendar, so every geopolitical whisper is moving markets. Add Israel/Lebanon missiles and China restricting US tech investment...
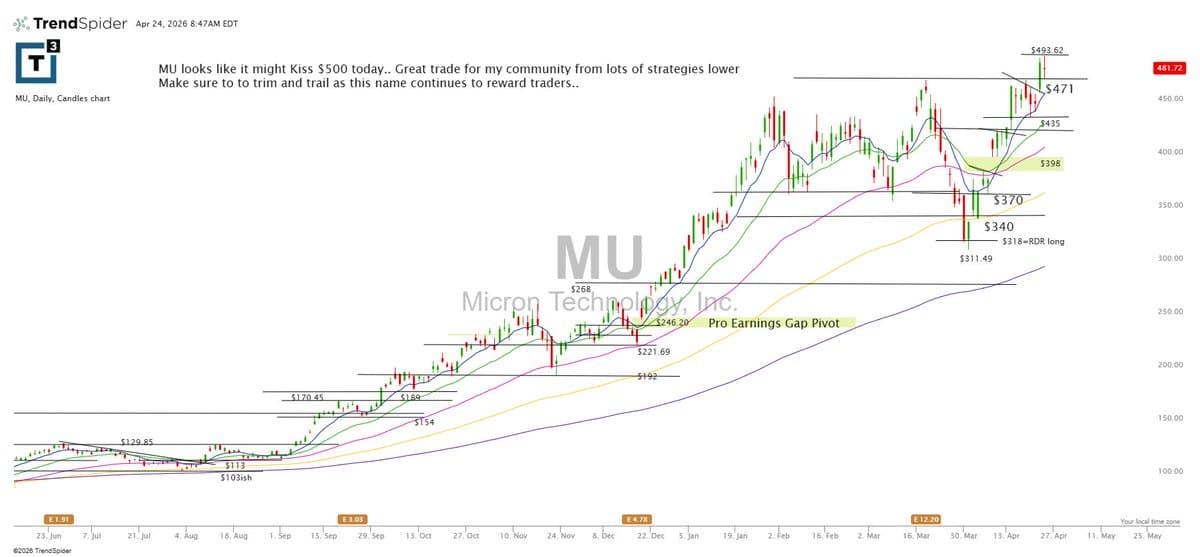
Trim and Trail $MU; $500 Target Looming
$mu gave so many strategic entries... Make sure to trim and trail as it might kiss $500 today https://t.co/HEfoq21sw6

Mean Reversion Strategies Outperform SPY, Up 44% Since Inception
Mean reversion (MR) for subs with new signals. Since inception: -#ES_F bonus MR +44.7% (May 21, 2025) YTD +15.7% -Bonus MR+Momentum: +3.7% (October 9, 2025. YTD +3.6% -Main MR strategy: +38% (June 27, 2023) YTD +5.2% - $SPY YTD +4.2% - Link in profile (Daily...