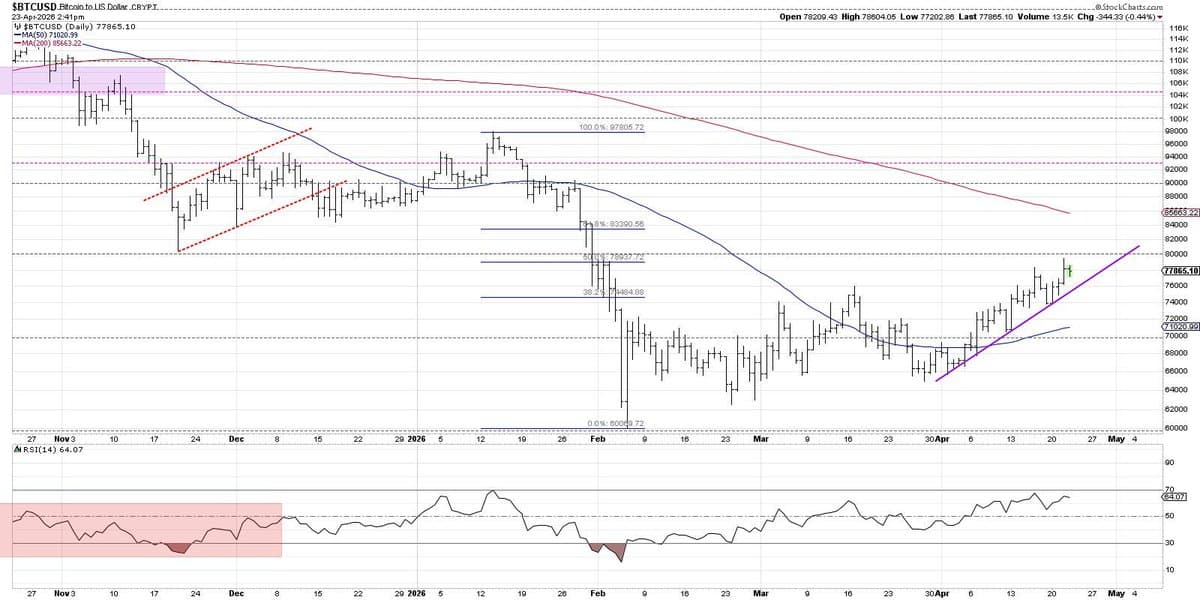
Bitcoin's March Trendline Holds, Uptrend Persists
For me, trendlines provide a visual representation of the pace of the trend. As long as #Bitcoin remains above trendline support from the end of March, this is a pretty clear uptrend phase IMO. But if that trendline is broken... $GBTC $IBIT https://t.co/NtJRQFI5K2
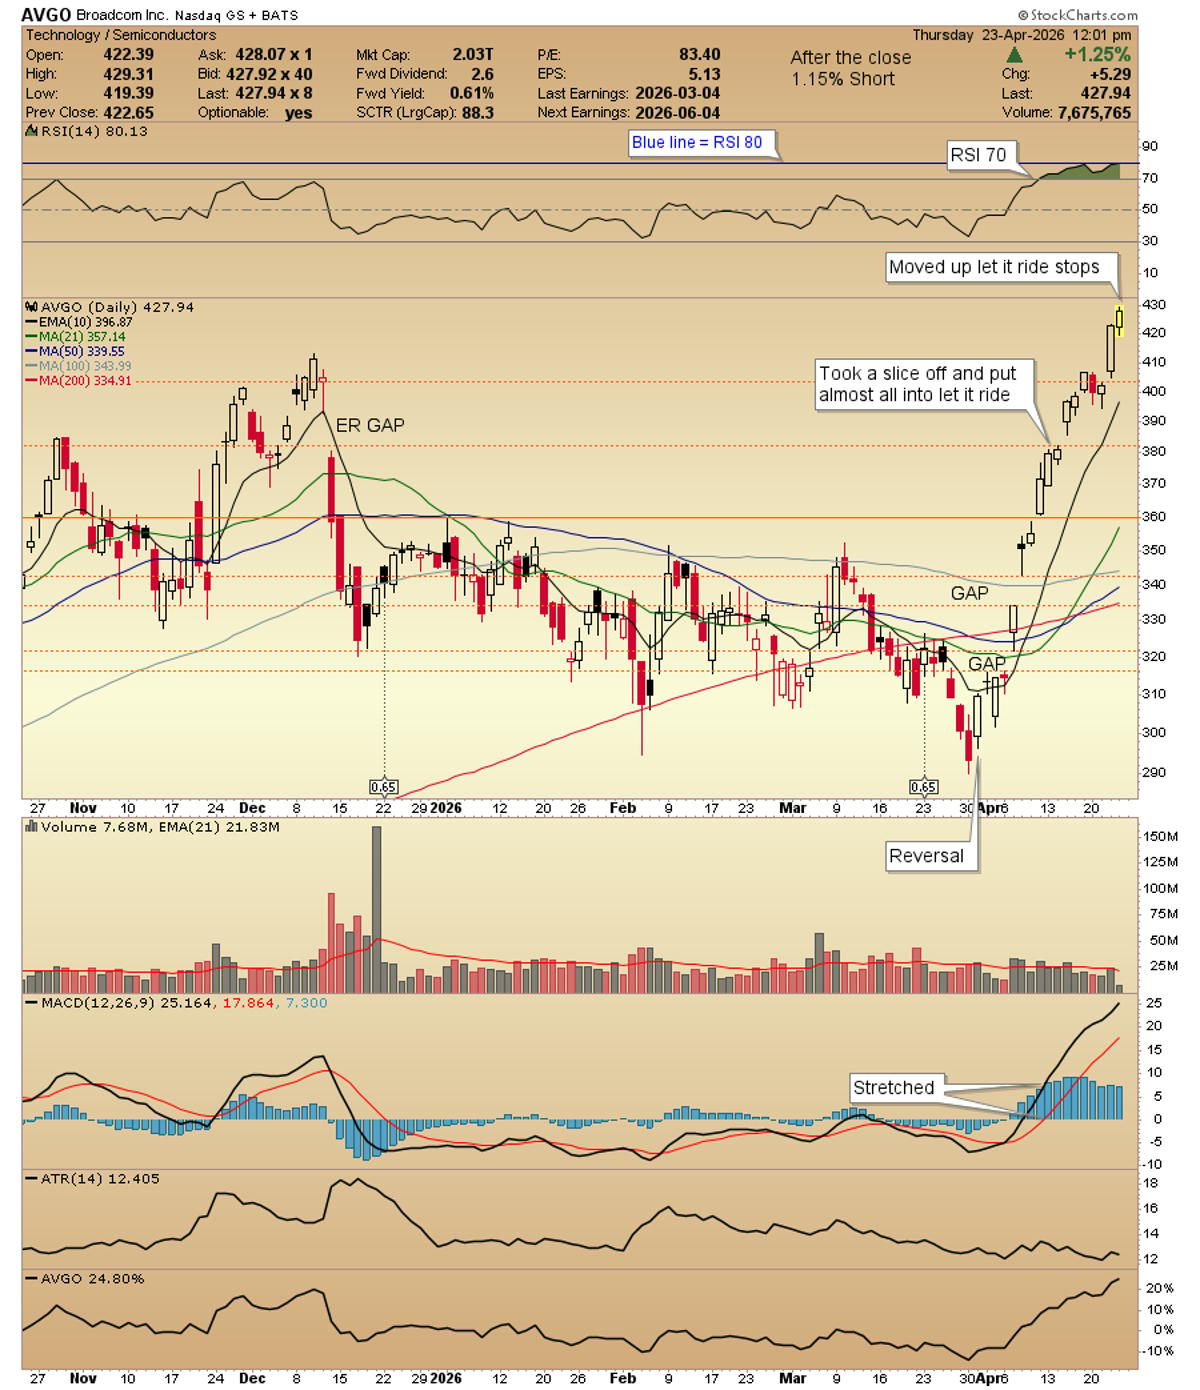
AVGO Uptrend Continues, Holding Positions Amid Pullbacks
$AVGO daily updated chart. Moved up let it ride stops. I am still giving room for pullbacks and basing on most orders. https://t.co/HN21WZCjfN

Today's Breadth Differs; Past Rally Won’t Repeat
I know, I know. You just watched a bunch of stocks rip higher without a pullback — and now you want to hold everything expecting a repeat. But the breadth regime from three weeks ago is not the same as the breadth...

TSLL Targets $12.44 on 15‑Minute Chart
$TSLL see my 15 min chart posted earlier.... I am watching 12.44 for next level.
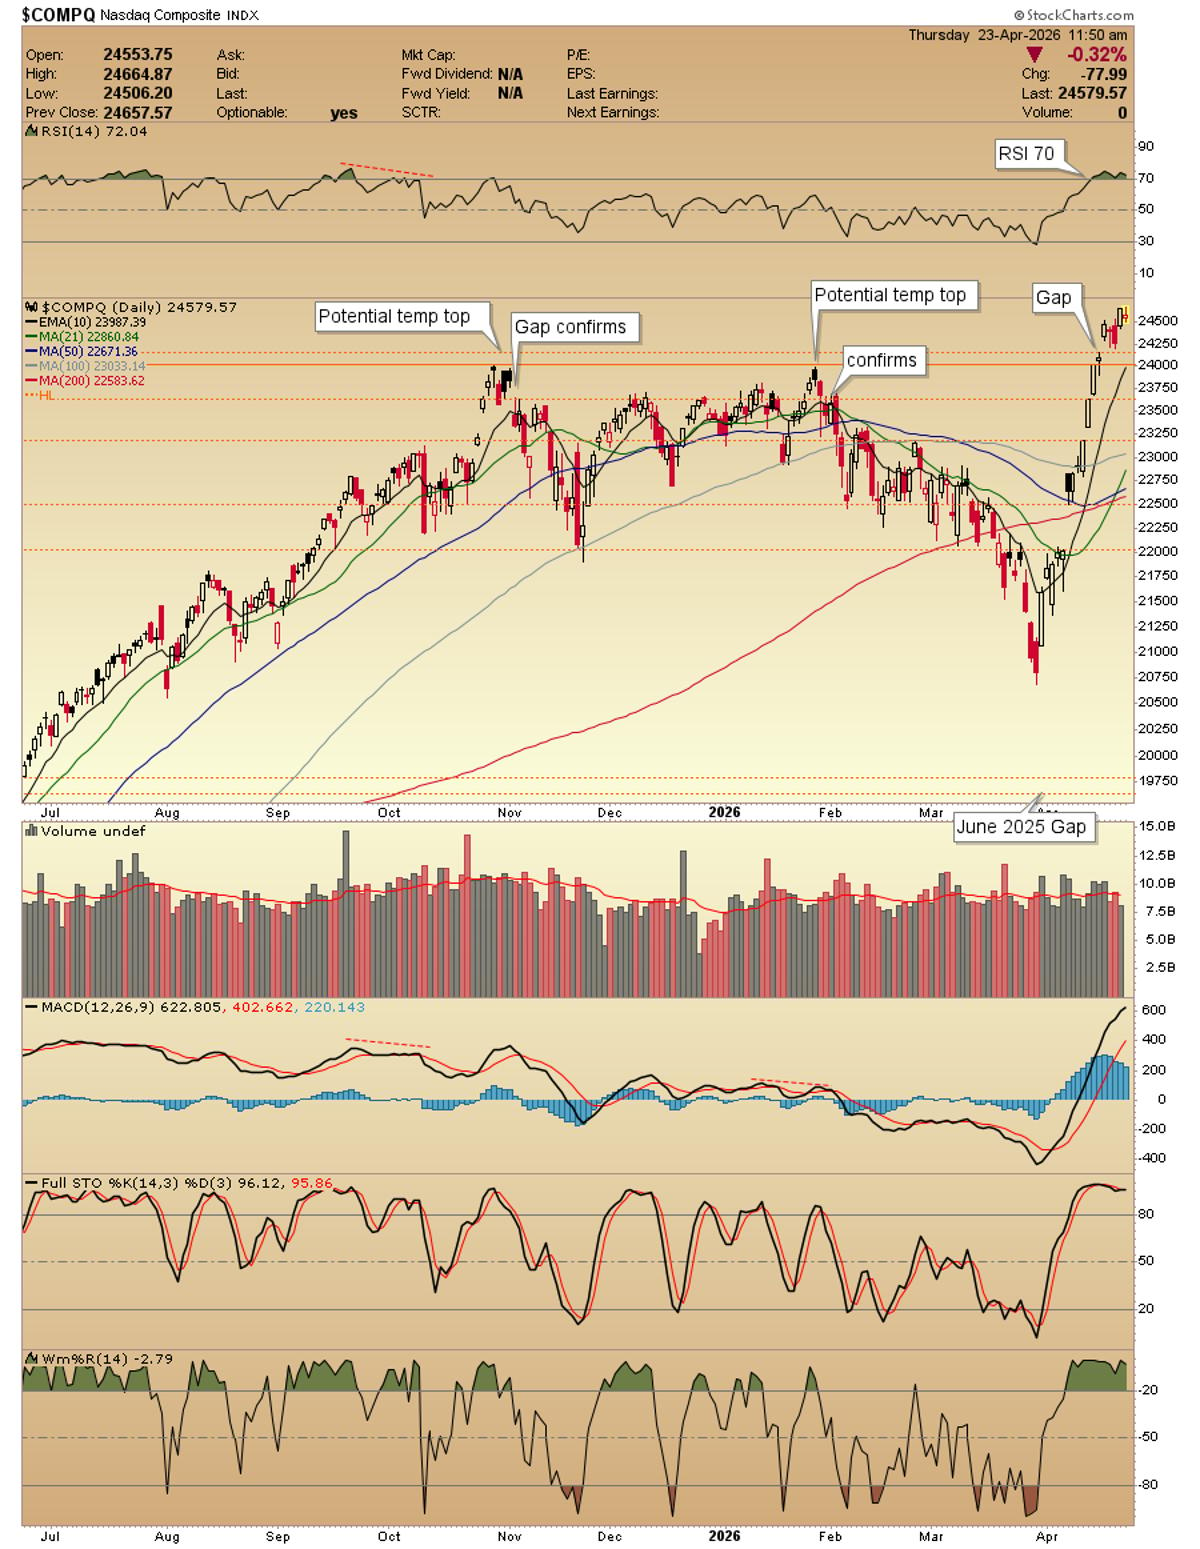
COMPQ Stuck in Nosebleed Zone, Awaiting Lower Levels
$COMPQ daily chart. Many levels below to catch price. We stay in the nose bleed section for now. https://t.co/HckSuLMwfu

Patience and Proper Sizing Beat Momentum Traps
7133 SPX is to $CAR at 700 As $CAR at 240 is to SPX at ? Momo and short squeezes can run in your face a while. They've run in my face from 6980. Patience and right sized
High‑probability SPY Setup Could Force Qullamaggie’s Comeback
If this high probability $SPY set up works @Qullamaggie will have no choice but to come out of retirement and write "lol" https://t.co/xYiBmPVbcl
SOX's 42% Surge Mirrors Rare Post‑Bear Rallies
$SOX(semiconductors) rallied 42% in the last 17 trading days. This happened only twice in its history: On April 30, 2001, after 14 months of bear market. On November 1, 2002, at the beginning of a new bull market, and after 31 months...
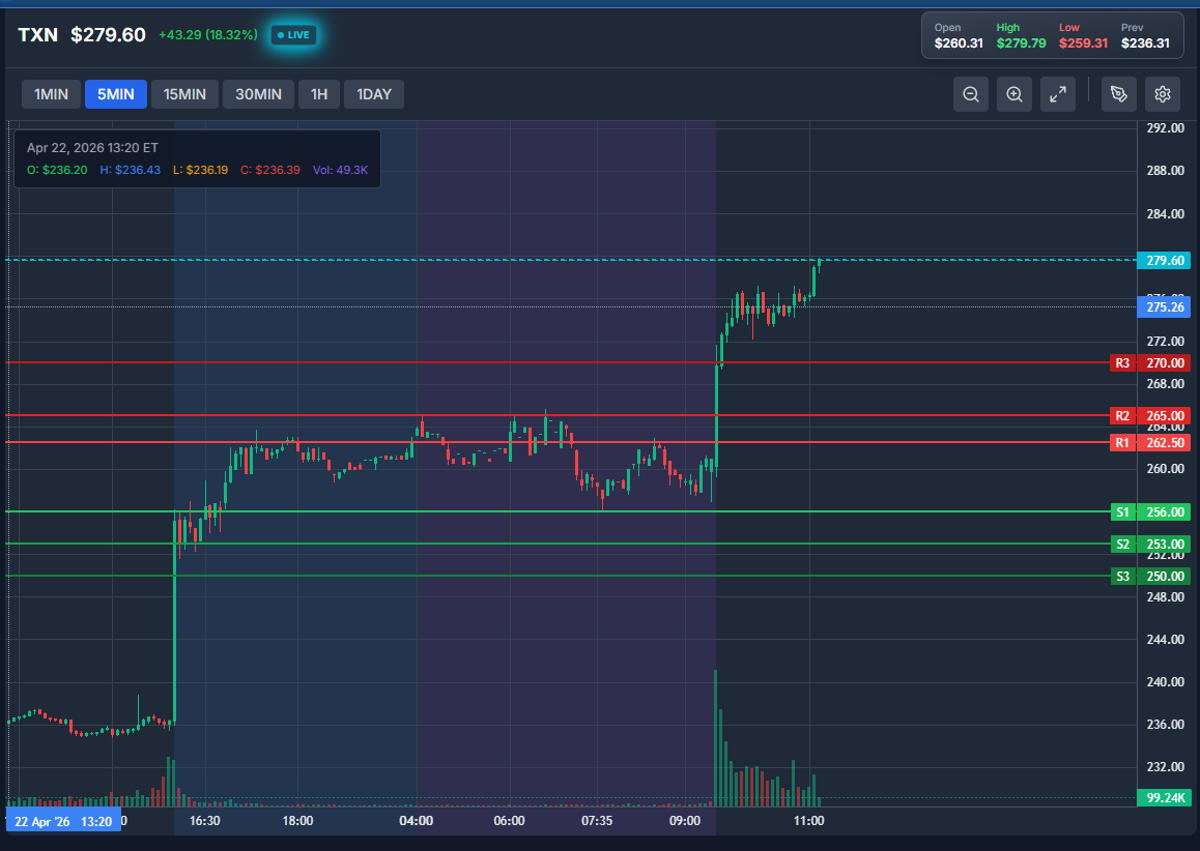
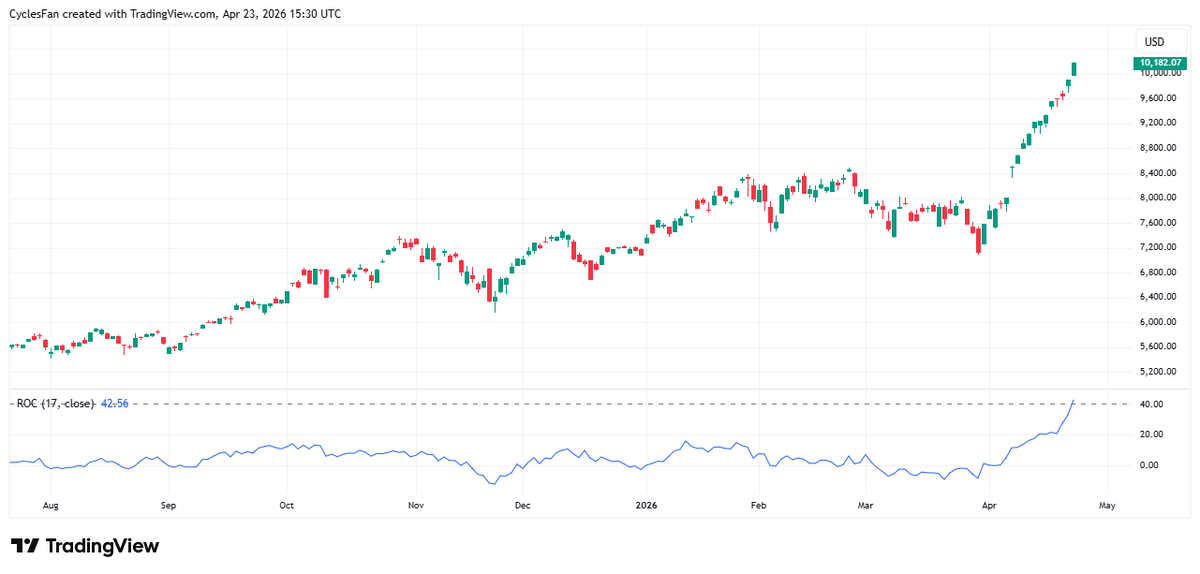
TXN Leads as Prime Example of SMB Money Trade
$TXN #1 today is a great example of the SMB "The Money Trade" (google it) https://t.co/Q19DB7qFKr
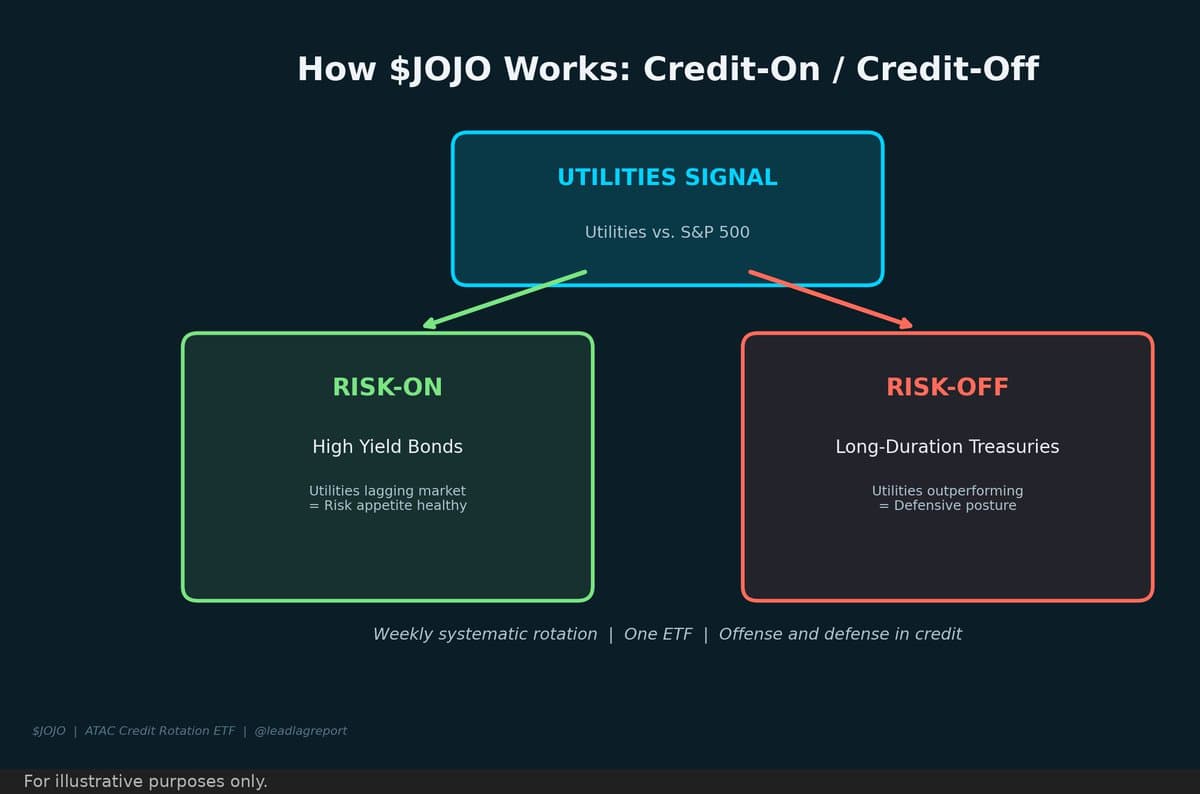
JOJO Leverages Utilities Signals for Credit Rotation
Advisors looking for differentiation in fixed income: $JOJO uses utilities sector signals to rotate between risk-on and risk-off credit. Systematic, transparent, and timely. https://t.co/vNSFE0Fce0
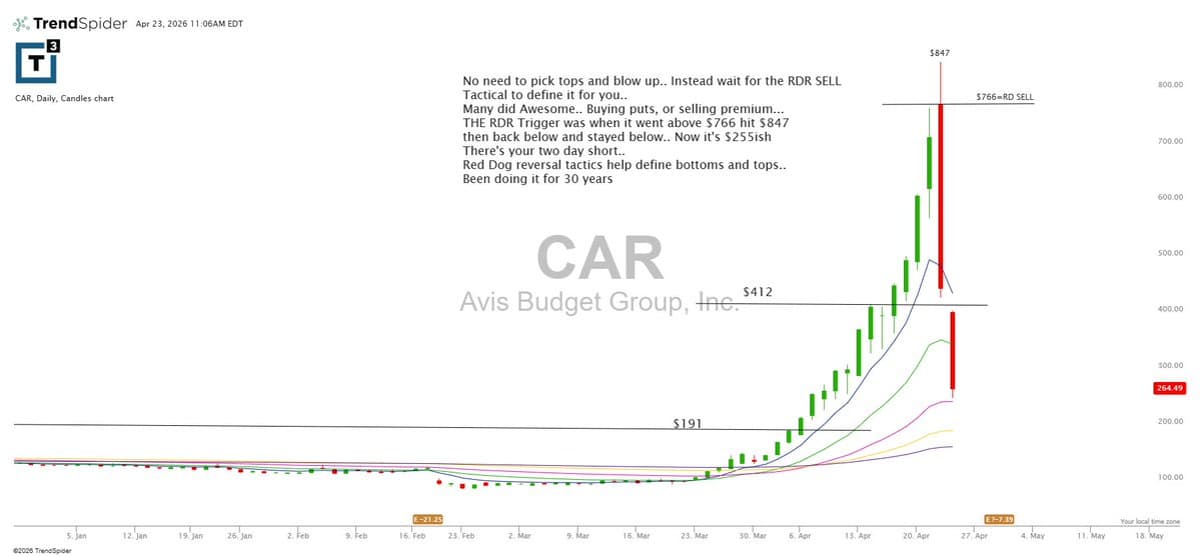
RDR SELL Technique Predicts Short‑term Car Stock Moves
No need to pick Tops-- My RDR SELL technique calculates it and has worked for Decades (at least for my community) Perfect two day short in $car for some https://t.co/DV2FMamOs7

Shorted $CAR at Open, Targeting $215 Close
Shorted $CAR immediately at the open today after missing all of yesterday. I didn't want to short later in the day yesterday, but it was clear by EOD that it was broken. Thinking we close at around $215 (July 2025...
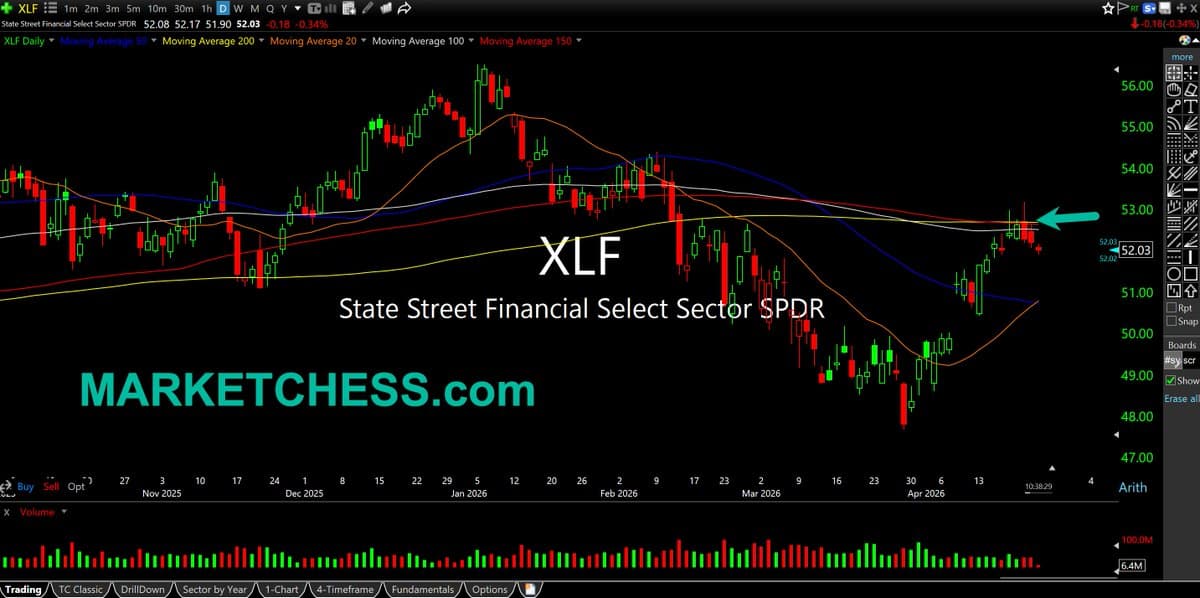
XLF Rallies to 200‑day MA; Watch for Rollover
$XLF Daily. ETF for big banks, many of which reported earnings. Rally up to 200-day m.a. & confluence of moving averages. Private credit had their bounce too. Watch for rollovers https://t.co/3hGFhsxWIf
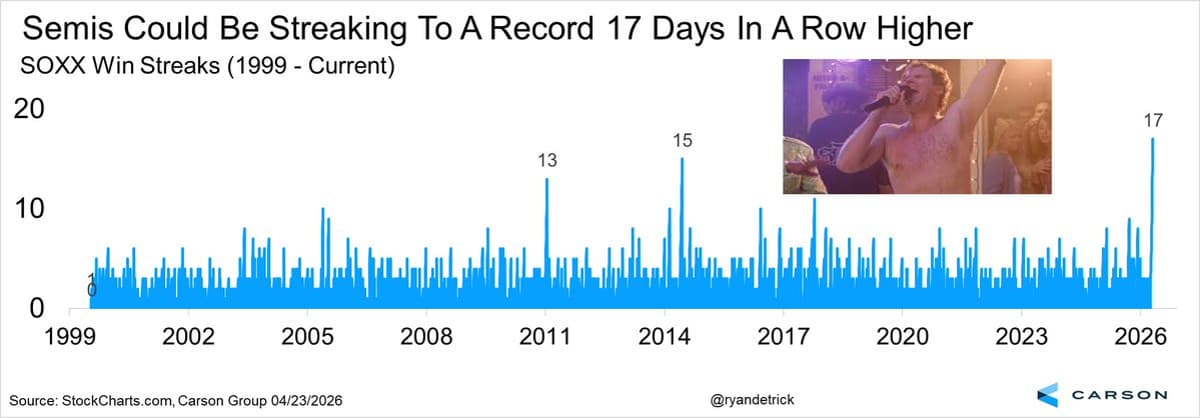
Semis Enjoy Record 17‑day Green Streak
It is green right now, which would be a record shattering 17 days in a row higher for semis. That is quite the streak. Frank the Tank is smiling at this type of streak. https://t.co/Dd3L75talj

TI Surges 15% on Earnings After Heavy Call Buying
Texas Instruments (TXN) 500 January $340 calls bought $14.20 to $14.25 as it explodes 15% on earnings following big call buys all week in it
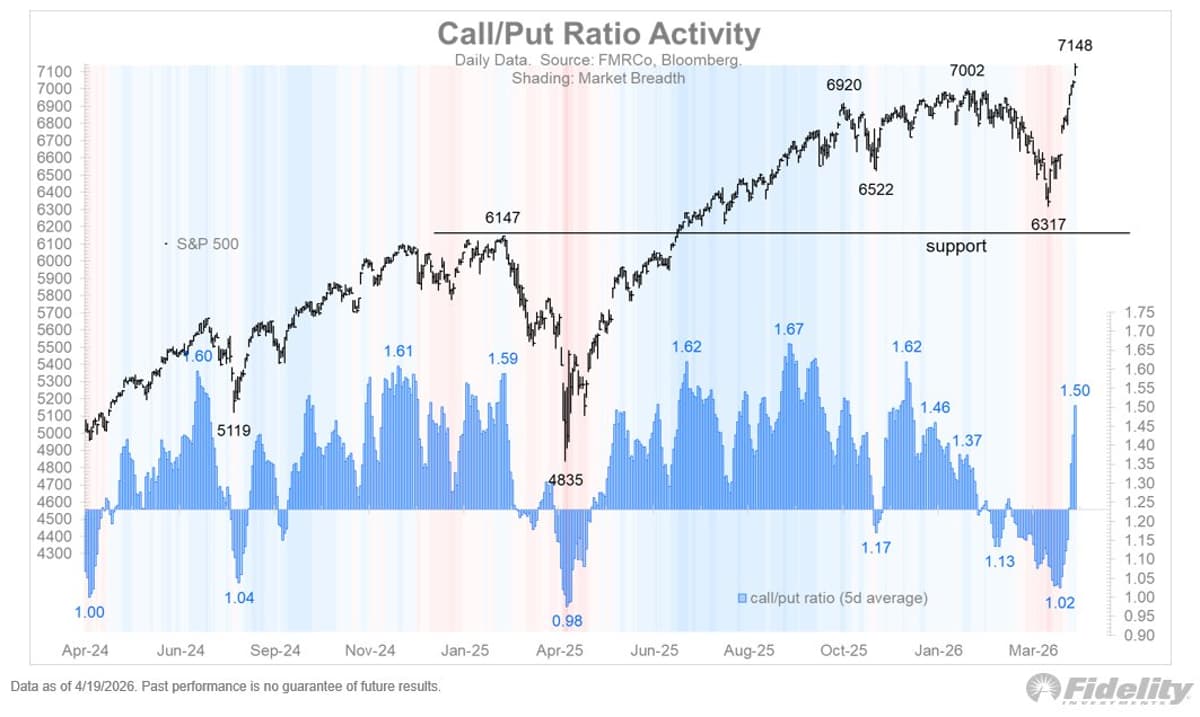
Short Covering Fuels Equity Melt‑up as Call/Put Ratio Spikes
The equity melt-up of the past two weeks was surely driven (in part) by short covering. The call/put ratio below has now surged from 1.02 to 1.50. https://t.co/jGi0QAJW3f
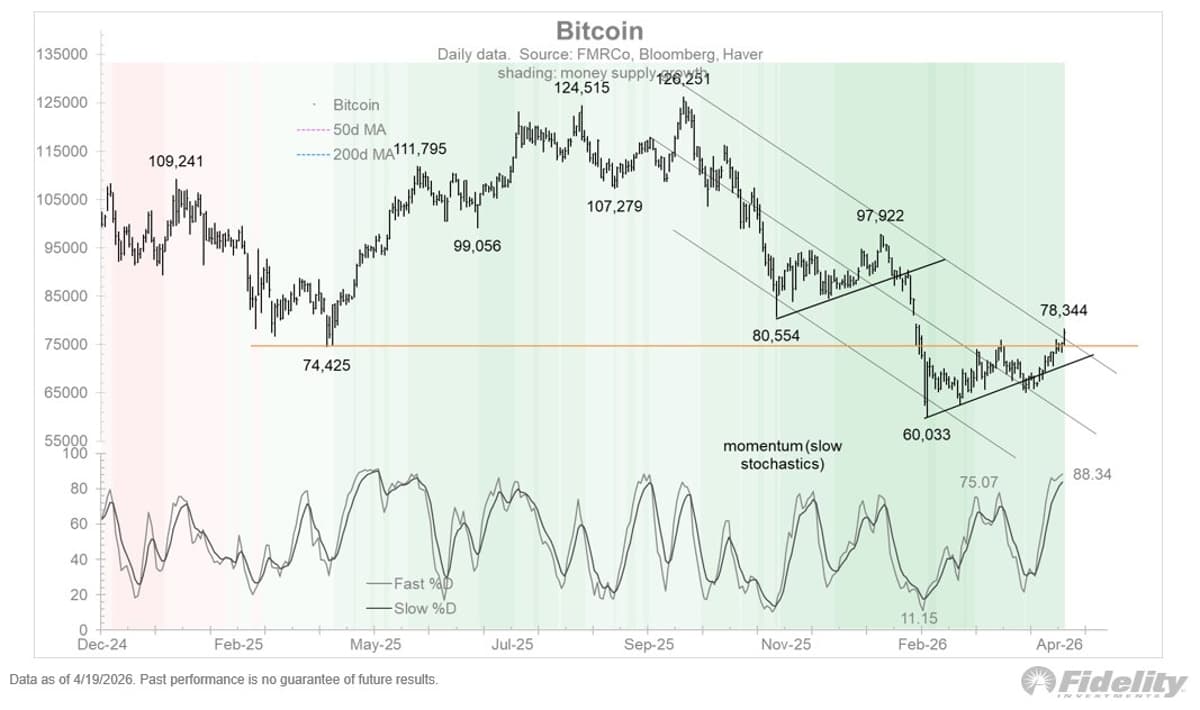
Bitcoin Builds Base at $78k, Primed for Next Surge
Bitcoin continued to build up last week, making a new recovery high of $78,344. The rally off the $60,033 low could still be described as a bear flag (not unlike the bear market rally last fall), but my sense...
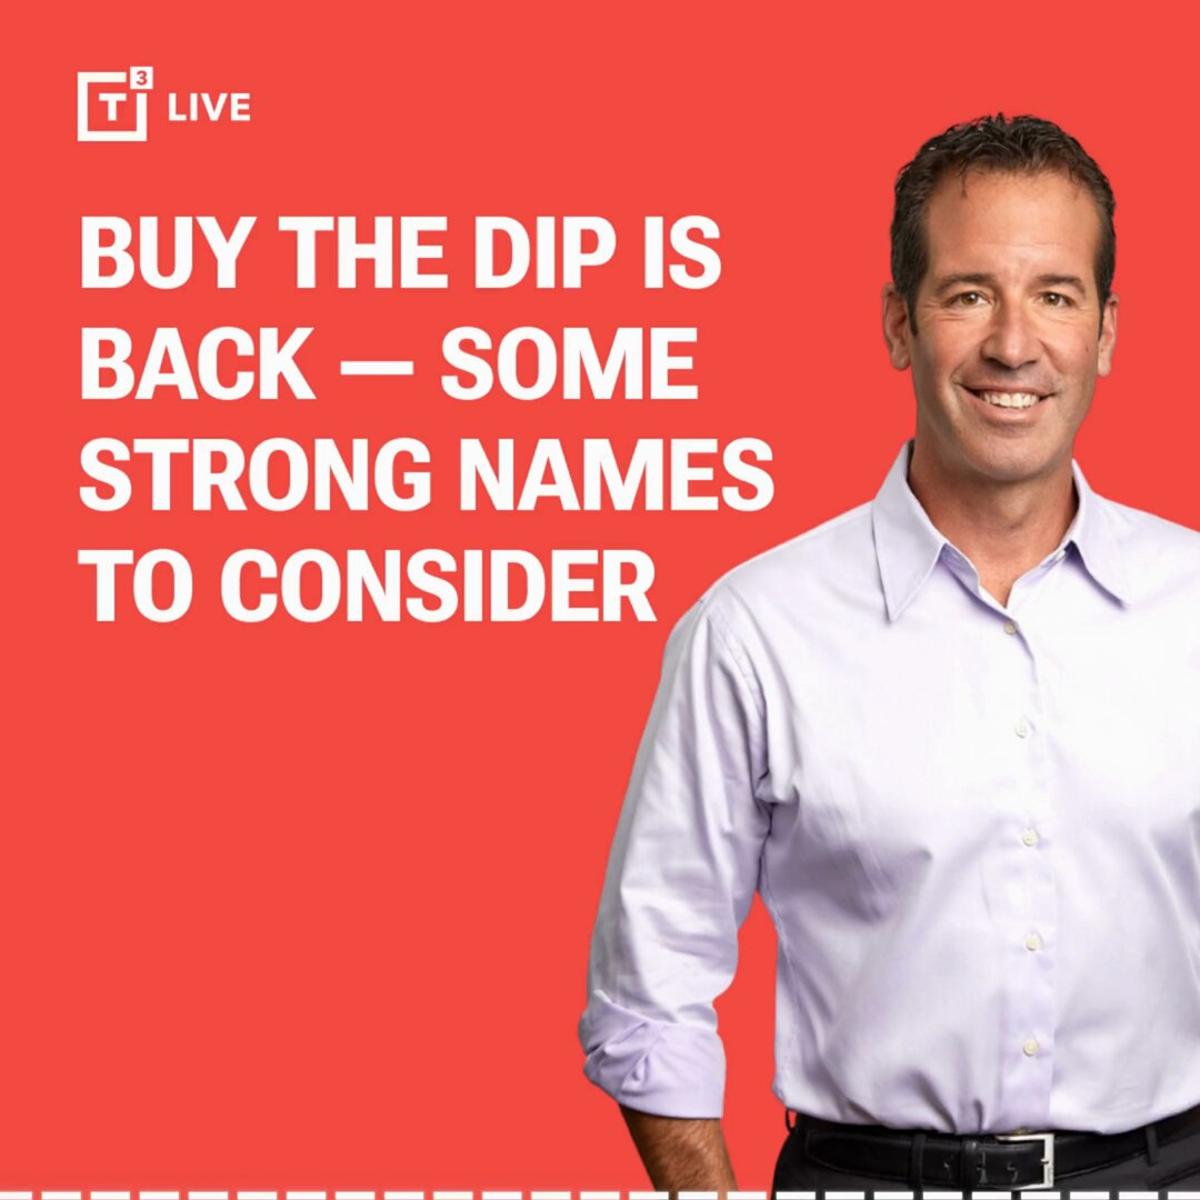
Buy the Dip Returns: Target MU, NVDA, AMZN, GOOGL
📺 BUY THE DIP IS BACK — SOME STRONG NAMES TO CONSIDER In a strong uptrend, pullbacks are once again becoming opportunities as leaders hold key levels and momentum remains intact. Some strong names to consider: – $MU is the focus after...

Buy Tesla April 24 385/375 Put Spread for Credit
$TSLA "Trade Idea 1: Buy the April 24 Expiry 385/375-372.50 1×2 Put Spread for a 5 cent credit." sell to close a 385/375 put spread on any strngth in stock. Let IV fall then can buy remaining put or...

Free IBM Put Spread: Sell, Wait IV Drop, Roll
$IBM "Trade Idea 1: Buy the April 24 Expiry 250/242.50 1×2 Put Spread for free." sell to close a 250/242.50 put spread near $7.50, let IV fall then will need to roll remaining put down and out.
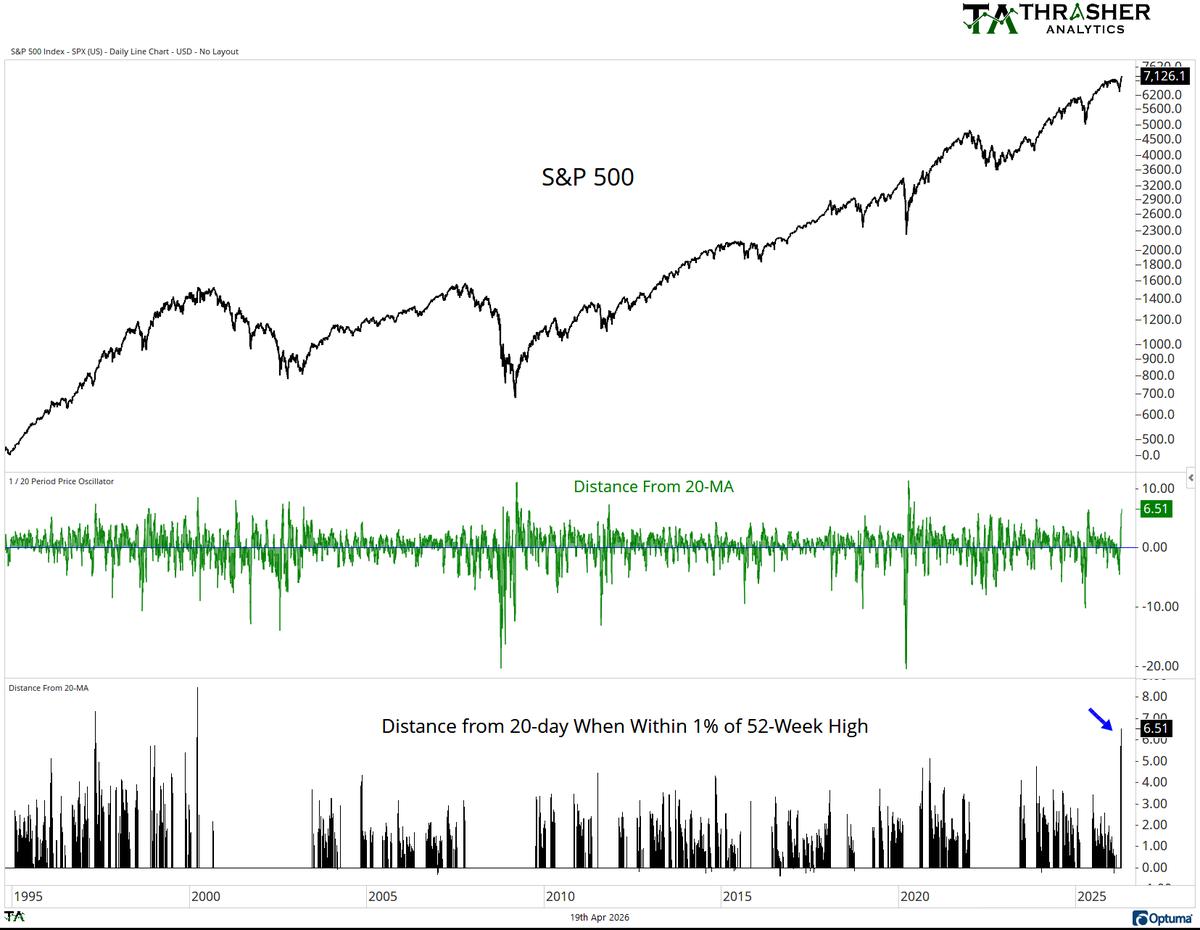
S&P 500 Hits Highest 20‑Day MA Gap Since 2000
A chart from Sunday's Thrasher Analytics note... The S&P 500 was 6.5% above its 20-day MA, the highest it's been above the short-term average since March 2000 when filtered for periods within 1% of a 52-week high, meaning not within a...

SpotGamma’s Early Alerts Navigated Q1 2026 Market Turbulence
Q1 2026 was turbulent. How did SpotGamma support subscribers through the craziness? ✓ Jan: Flagged a "window of weakness" post-OPEX — S&P dropped 2% the next session ✓ Feb: Called SPX 6,900 as key risk pivot — vol spiked for 3 days...
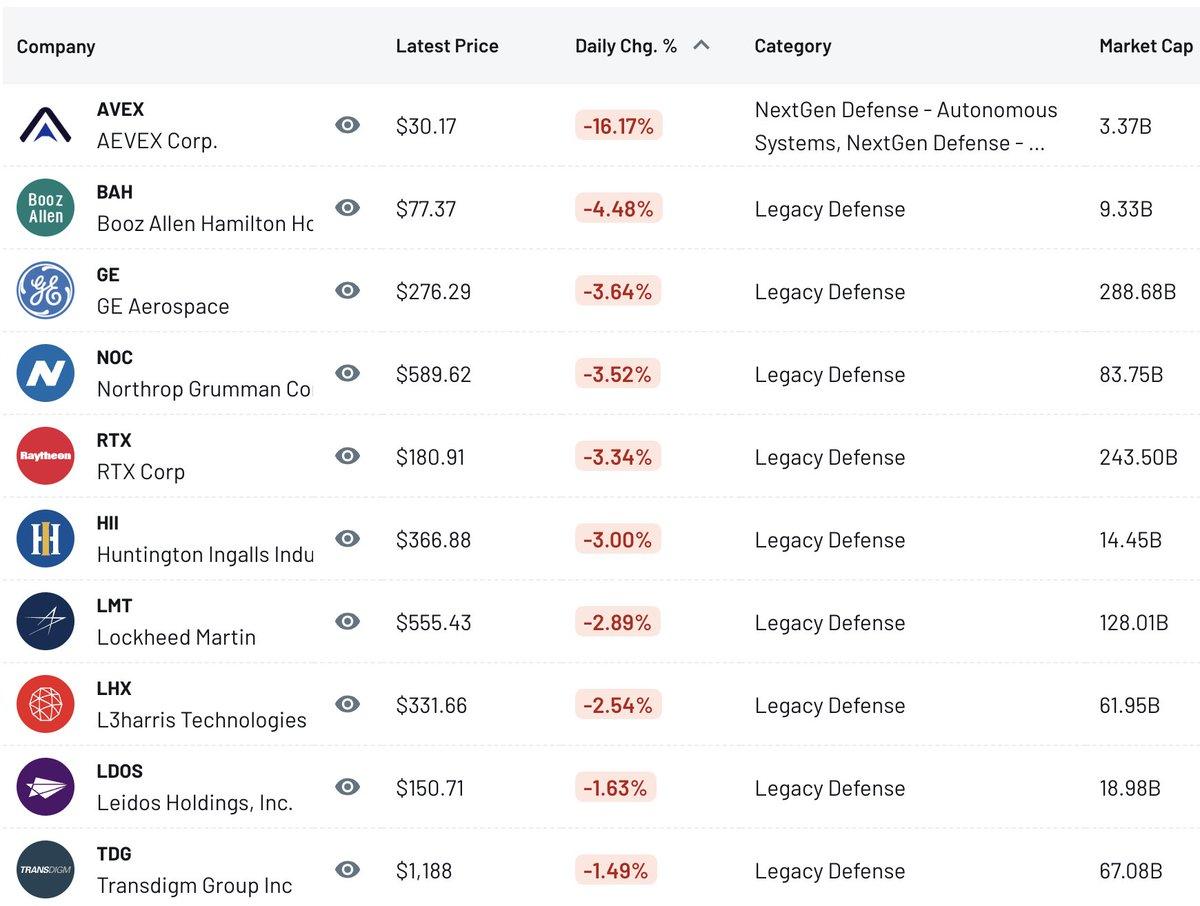
Boeing, Space Primes Surge on Earnings and Contracts
NextGen Defense – Daily Gainers & Losers (04/22/26) NextGen Defense traded mixed as Boeing and space‑focused primes advanced on solid earnings and contract momentum, while newly listed drone maker AEVEX and large legacy primes lagged. – The Boeing Company (BA) rose 5.53%...
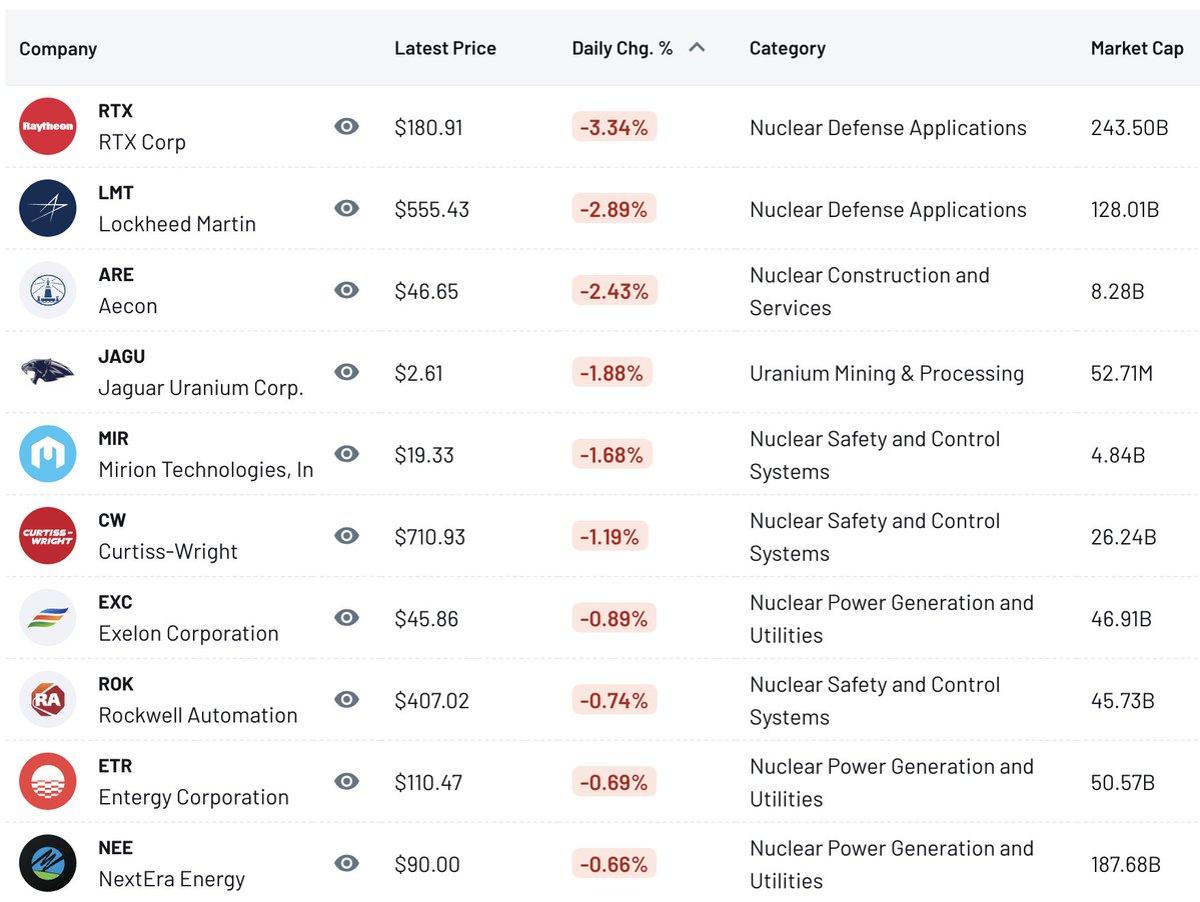
Nuclear Stocks Rally on SMR, Enrichment Gains
Nuclear – Daily Gainers & Losers (04/22/26) Nuclear names ripped higher as SMR developers and enrichment plays surged, while large defense contractors and diversified utilities saw mild profit‑taking. – Eagle Nuclear Energy (NUCL) jumped 17.55% to $12.46, extending its post‑SPAC momentum after...
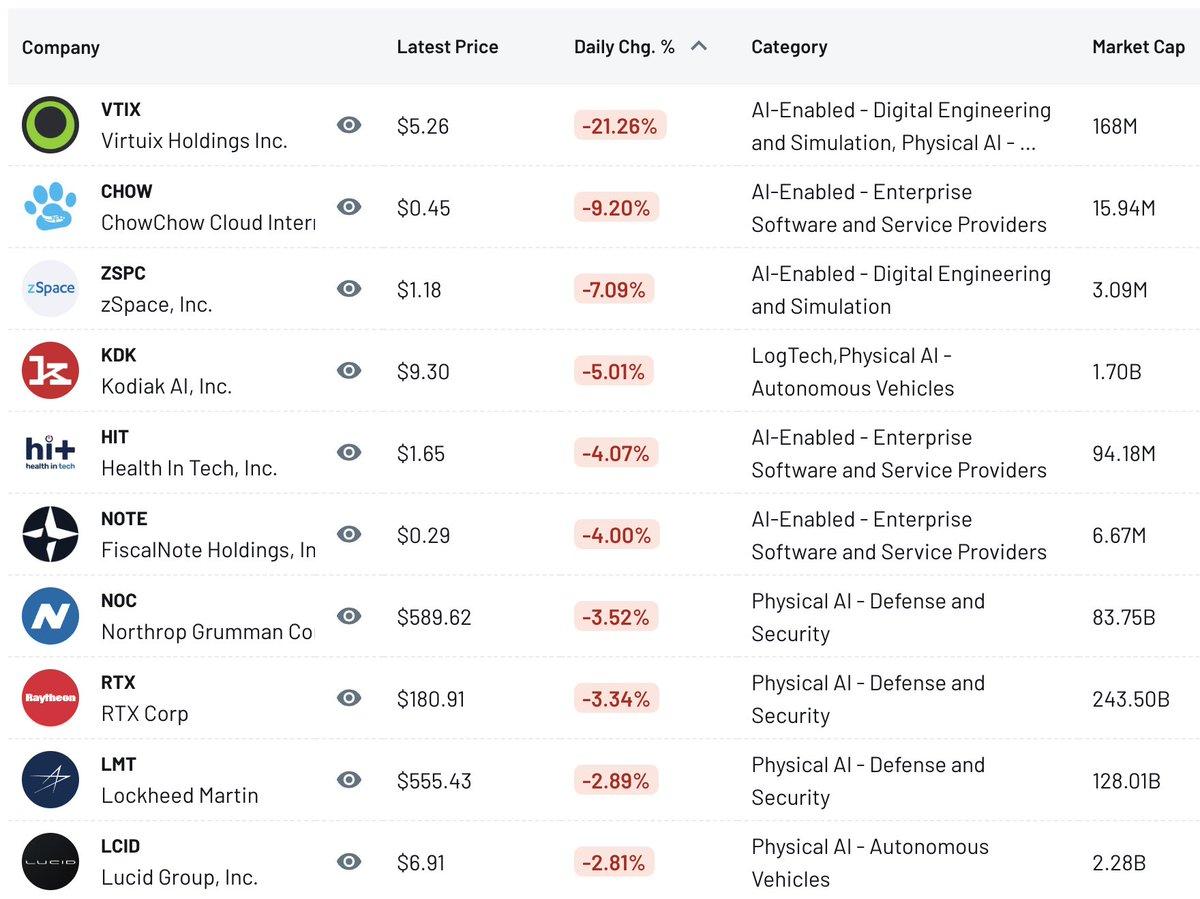
Speculative AI Small‑Caps Surge, Autonomy Stocks Slip
Next Waive – Daily Gainers & Losers (04/22/26) Next Waive names rallied as speculative China‑listed physical‑AI small caps and energy‑software platforms surged, while digital‑engineering and autonomy leaders like Virtuix and Kodiak AI slid on profit‑taking. – Huachen AI Parking Management (HCAI) skyrocketed...
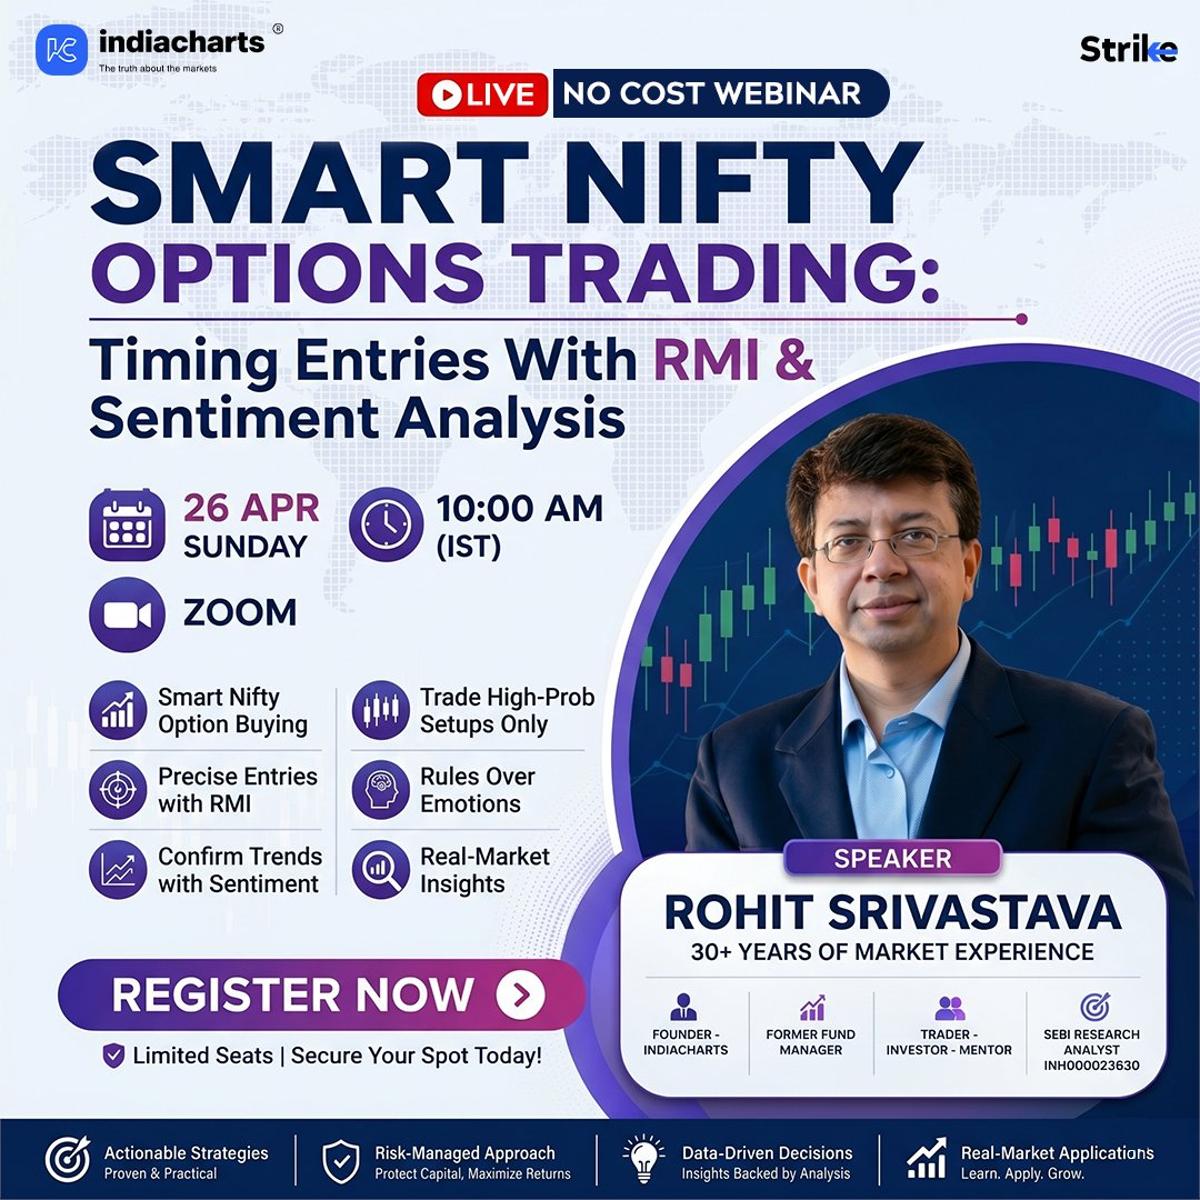
Master Nifty Options Timing with RMI & Sentiment
🚨 WEBINAR ALERT Smart Nifty Options Trading: Timing Entries with RMI & Sentiment Analysis 📊 Learn a structured approach to Nifty option buying 🎯 Use RMI (Rohit Momentum Indicator) for precise entry timing 🌐 Combine market sentiment indicators to confirm trends ✅ Identify high-probability trade...
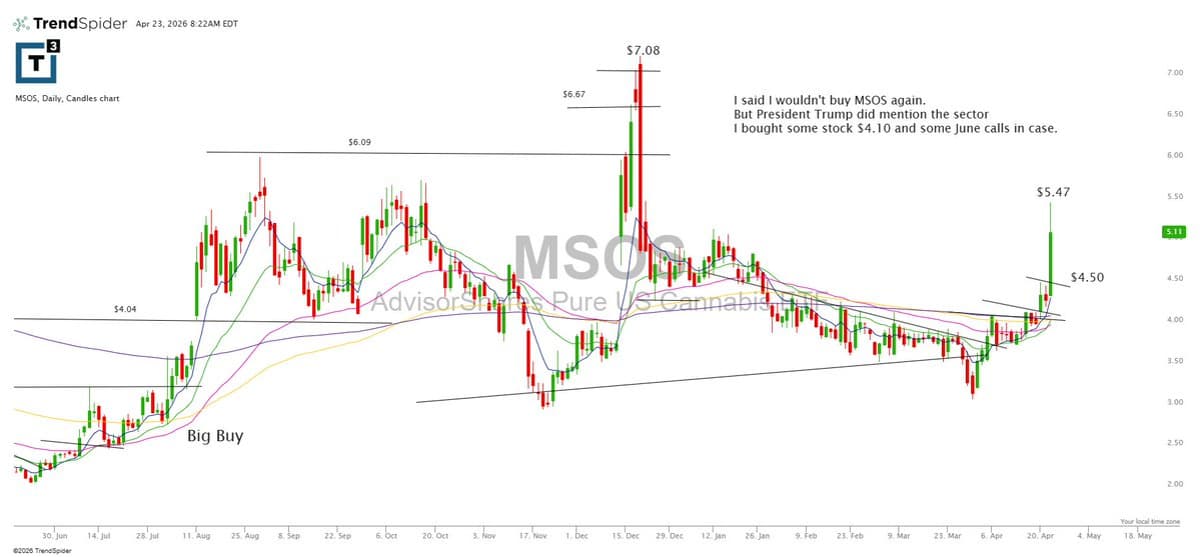
Bought MSOS at $4.10, Trimmed at $5.60, Holding Onward
We did buy $msos at $4.10ish and some calls on Monday with @StocksOnSpaces and @WOLF_Financial i did trim some here $5.60+.. I'll stay with some https://t.co/LlsEF5td6t
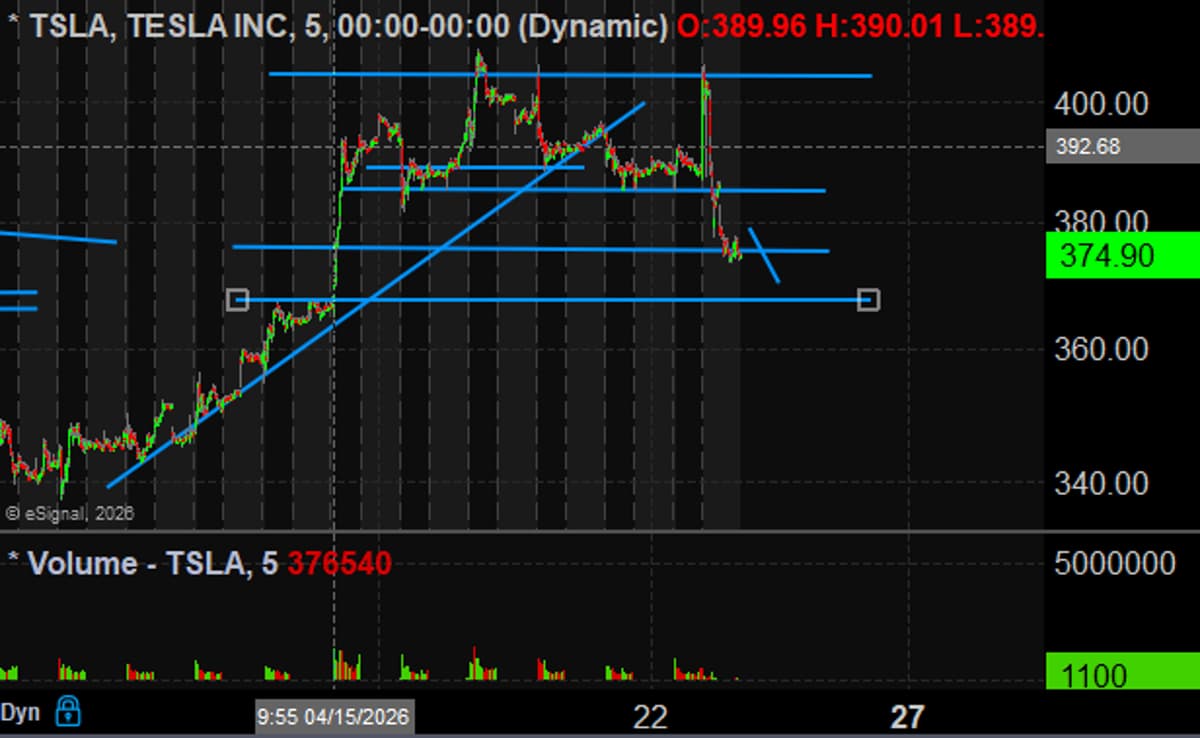
Tesla's $25B Capex and Robo‑Taxi Delay Pressure Stock
based on the chatter it seems the 2 things driving $TSLA lower after the pop are 1. $25B capex 2. robo-taxi scale deployment pushed out to 2027 ------- it's hit both sides of the "risk range" i highlighted ystdy. --i'll trade it long if...
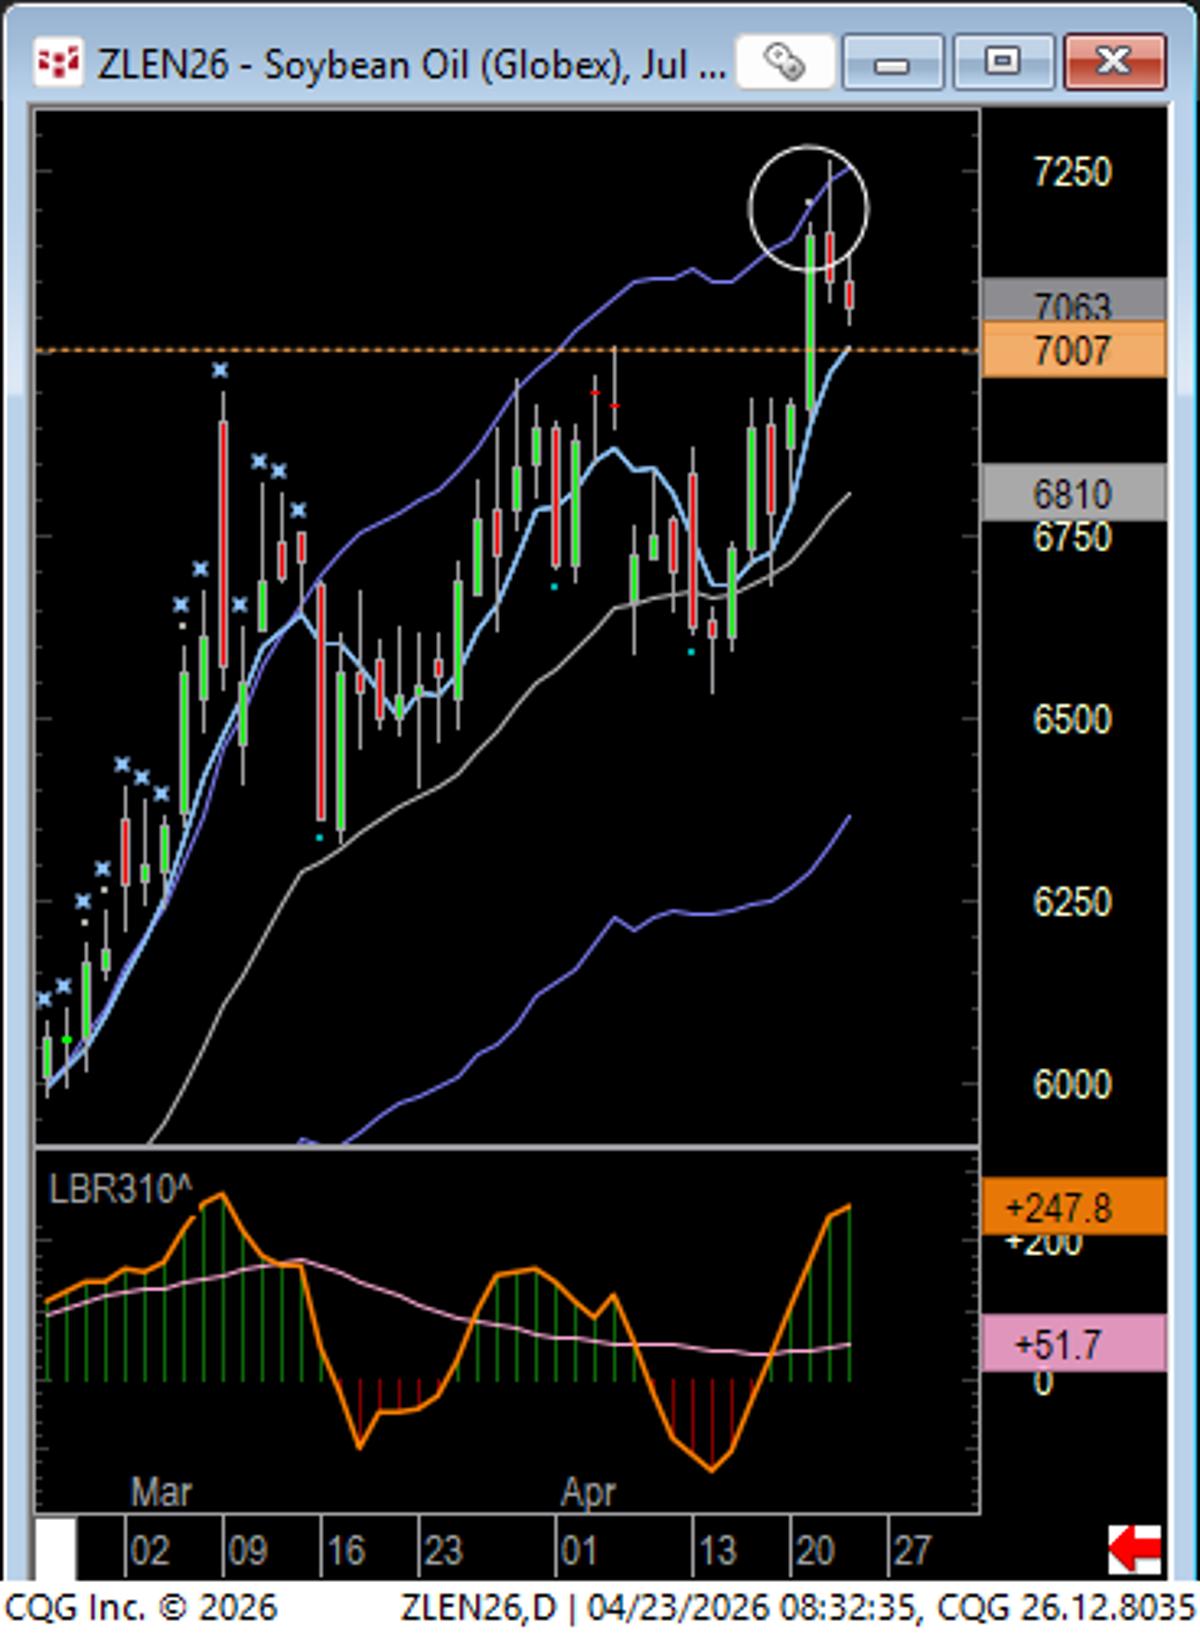
Bean Oil Near Keltner Break, Possible Bull Trap
Bean Oil - not quite a climax close outside Keltner Channels, but potential bull trap/last gas for now if it drops back into range. https://t.co/MKc2Peq27r
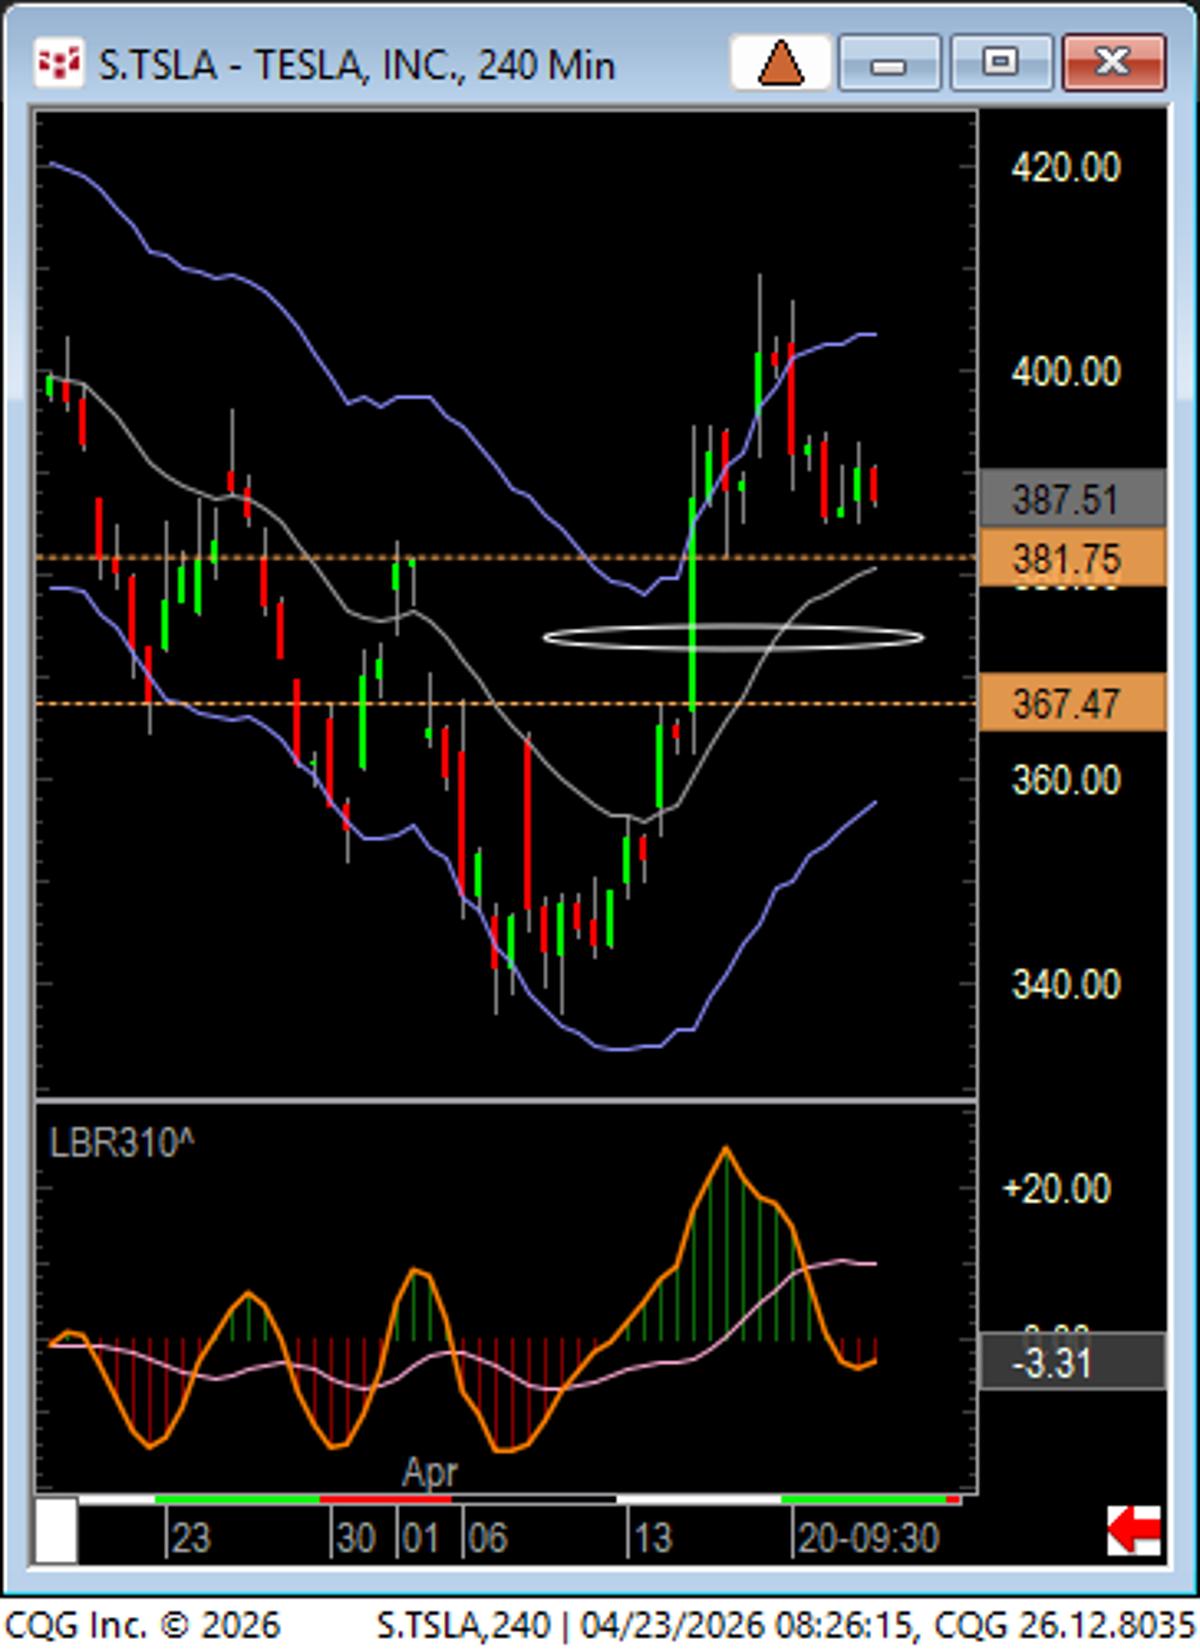
Tesla Gaps Down, Eyeing Cave Fill Before Tech Earnings
TSLA - looking for cave fill repair with gap down this AM...(next week is big earnings week for tech..) https://t.co/2ZSXNvaOjf

Software Weakness Drives Pullback, SPY Support Holds
📺 THIS PULLBACK IS ABOUT SOFTWARE, NOT THE MARKET The market is opening lower today, led by weakness in software $IGV. Despite that, the pullback in $SPY is relatively small. Yesterday’s gap has already been filled, which resets the chart and removes...
Markets Reach Balance, Enter Bracketing Phase
markets coming into balance now: Indexes, Bonds, https://t.co/KzLjFarnZN.JY, GCC..etc formed 3 bar balance. Markets now in bracketing mode. https://t.co/UmBCm7Gjzj
Market Rally Drives Bullish Sentiment to January Highs
From Peter Boockvar @pboockvar "Nothing like a stock market rally to lift sentiment as mood always follows price. In the most fickle and volatile sentiment survey, the AAII retail one today saw Bulls jump by 14.3 pts to 46, the...

TSMC Share Gap Narrows, UBS Spots Trading Opportunity
The narrowing gap between TSMC’s Taiwanese shares and its US-listed stock is creating a new trading opportunity, according to a UBS client note https://t.co/KZ67CNpx8v
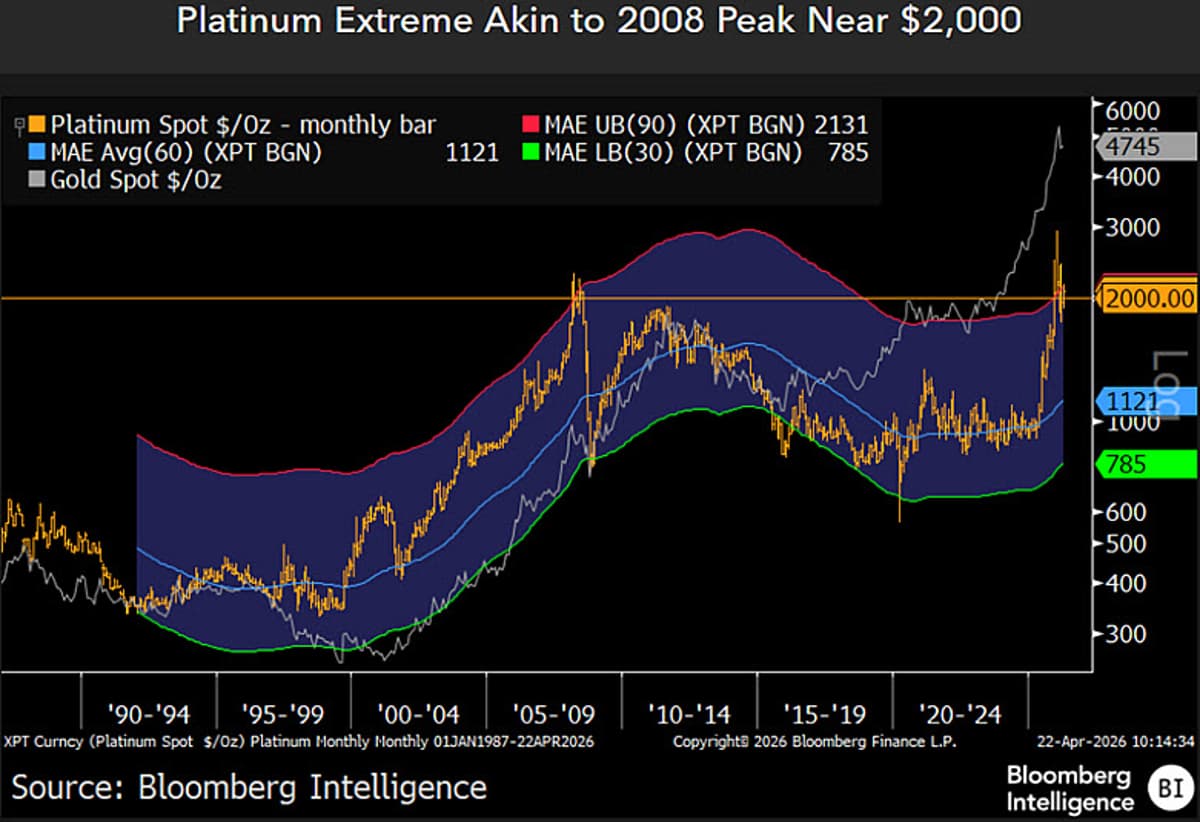
Platinum Overextended yet Deeply Discounted to Gold
Platinum Is Stretched, But Low vs. Gold Platinum is extremely extended vs. its 60-month moving average, but a primary underpinning may be its steep discount to gold. At about $2,000 an ounce on April 22, my graphic shows platinum around the...
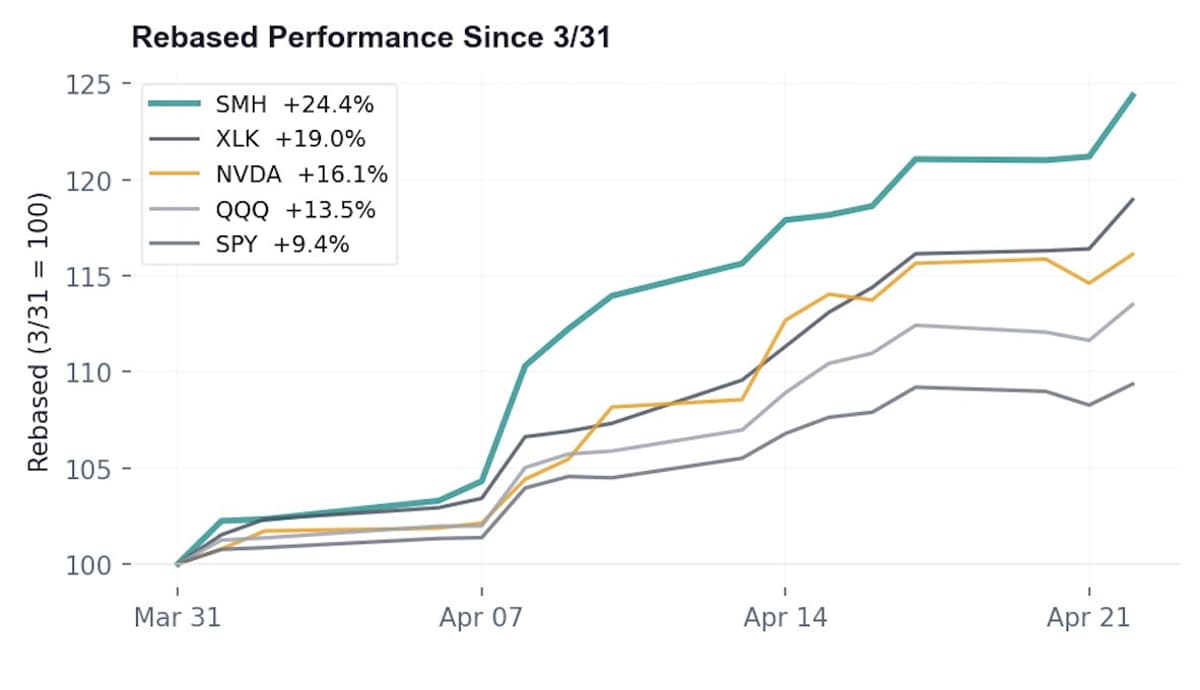
SMH Rides 24% Surge, Yet Stretched on Bullish Hope
The market bullish thesis is predicated on this outperformance continuing $SMH Its up 24% since 3/31 Fresh off of 2nd longest winning streak in history (13 days) So stretched. https://t.co/46KPSsraIH

Crypto Slides as Stocks Hit Record Highs
The $79K wall held. Almost to the dollar. Bitcoin peaked at $78,923 yesterday — $277 below the Short-Term Holder cost basis at $79,200, a level where every buyer over the past 155 days sat at breakeven — and immediately got...

Master Basics First, Simplify Until EV+ Strategy
1. Price action 2. Support/Resistance 3. Volume 4. Journal Until you have an EV+ strategy, Keep it as simple as possible.

Bitcoin's Bull‑Trap Fractal Signals Potential $45K Drop
Bitcoin is repeating the same fractal we’ve seen during EVERY bull trap. If this pattern plays out, $BTC could drop to $45,000 within 2 weeks. Save this chart now. It’ll make sense later. https://t.co/6VLCBEXRNz
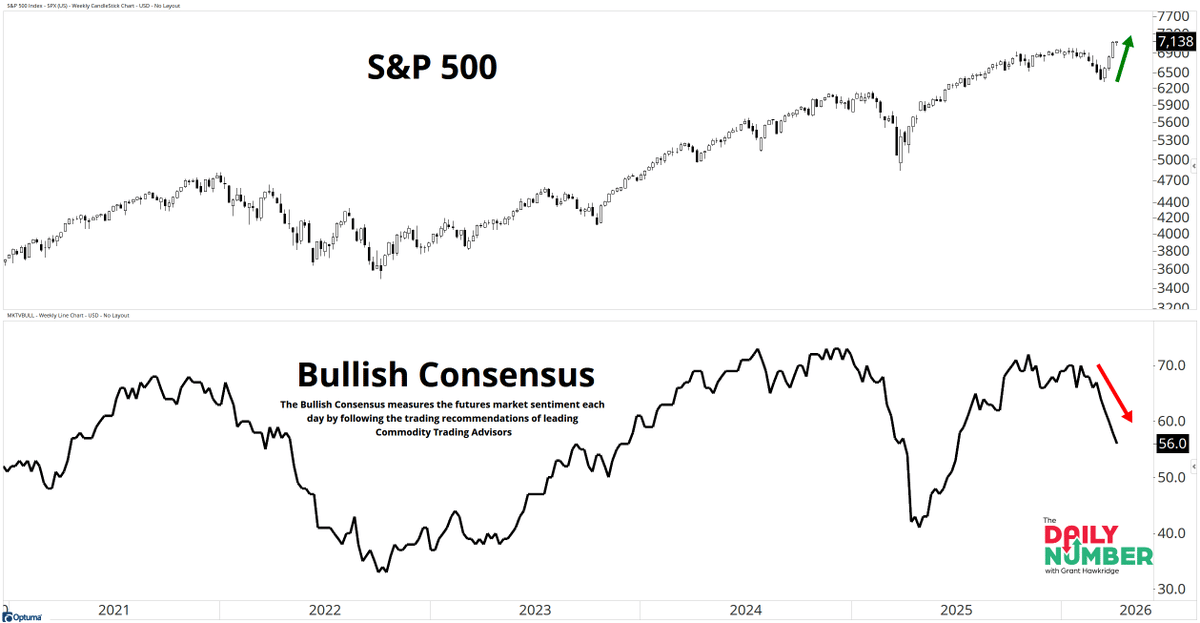
Markets at All‑Time Highs, Crowd Misreads Pullback
Stocks ripping to highs... and the crowd is clueless. Bullish Consensus is in the middle while the S&P 500 prints all-time highs.... The crowd is waiting for another pullback that isn’t coming. Are you following price, or them? 👉 https://t.co/dxD8qHBlrB https://t.co/bHh3Rlvvqs

Whales Stockpile Energy Stocks While Retail Chases AI
Hey @grok Analyze the last 90 days of billionaire 13F filings. Which sector are the whales quietly loading up on while retail chases the obvious AI names? Top 3 tickers.
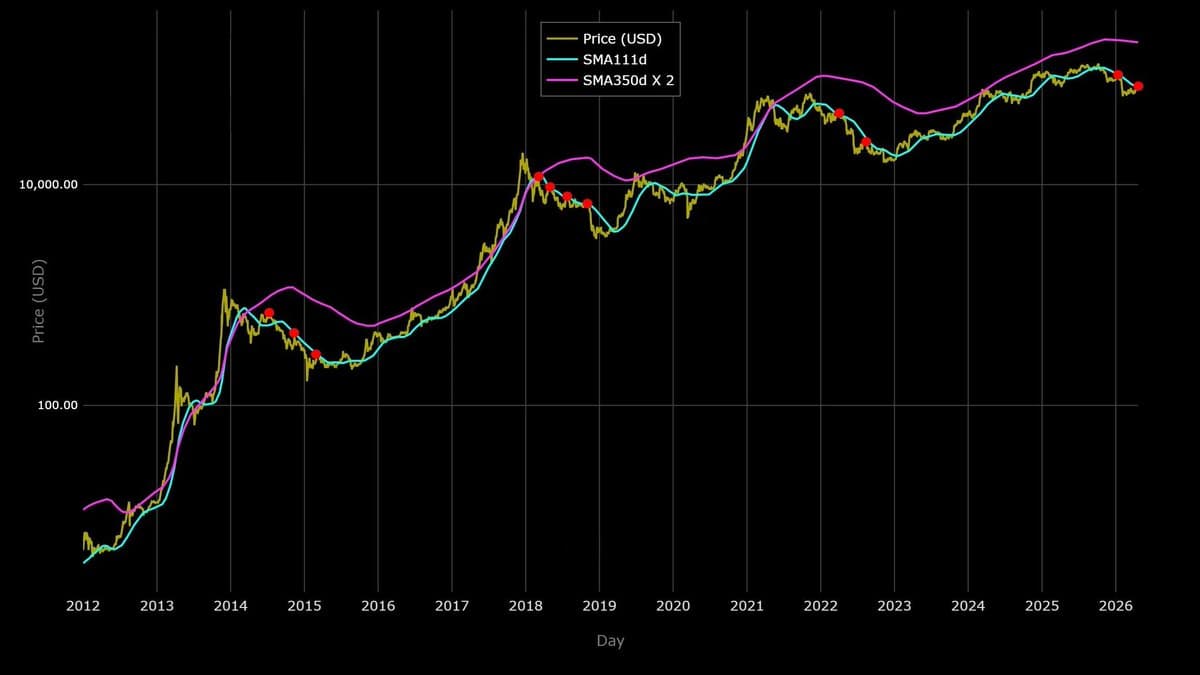
BTC Must Reclaim 111‑Day SMA to Avoid Rejection
#BTC For a trend reversal to be confirmed, BTC needs to reclaim the 111D SMA. If price fails to break above it and hold, a rejection becomes highly likely - especially with the higher time frame trend on the weekly and monthly...
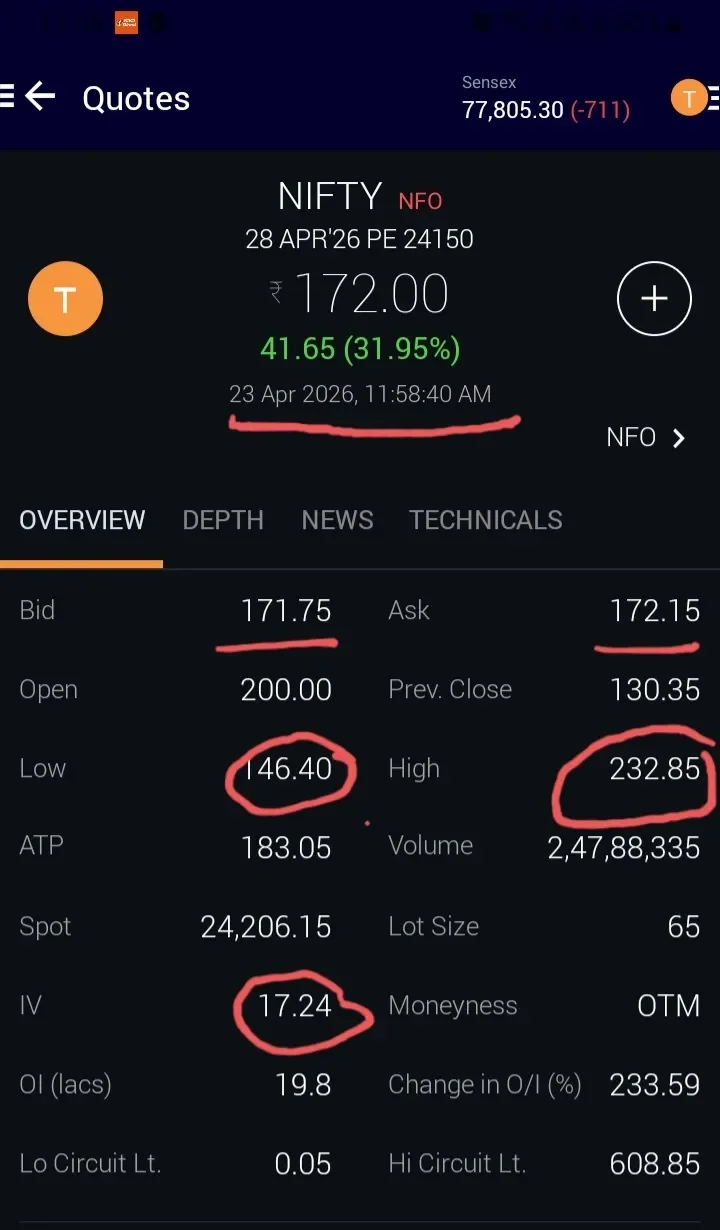
Holding 24150 PE, Expecting IV Expansion Above 130
Today's GammaGrid Insights 😎 Holding Nifty 28 Apr 24150 PE @ 154.15. IV looks decent here, expecting some expansion. As long as it holds above 130, setup is intact. Let’s see if market proves me right 😁 #Nifty50 #optionsTrading
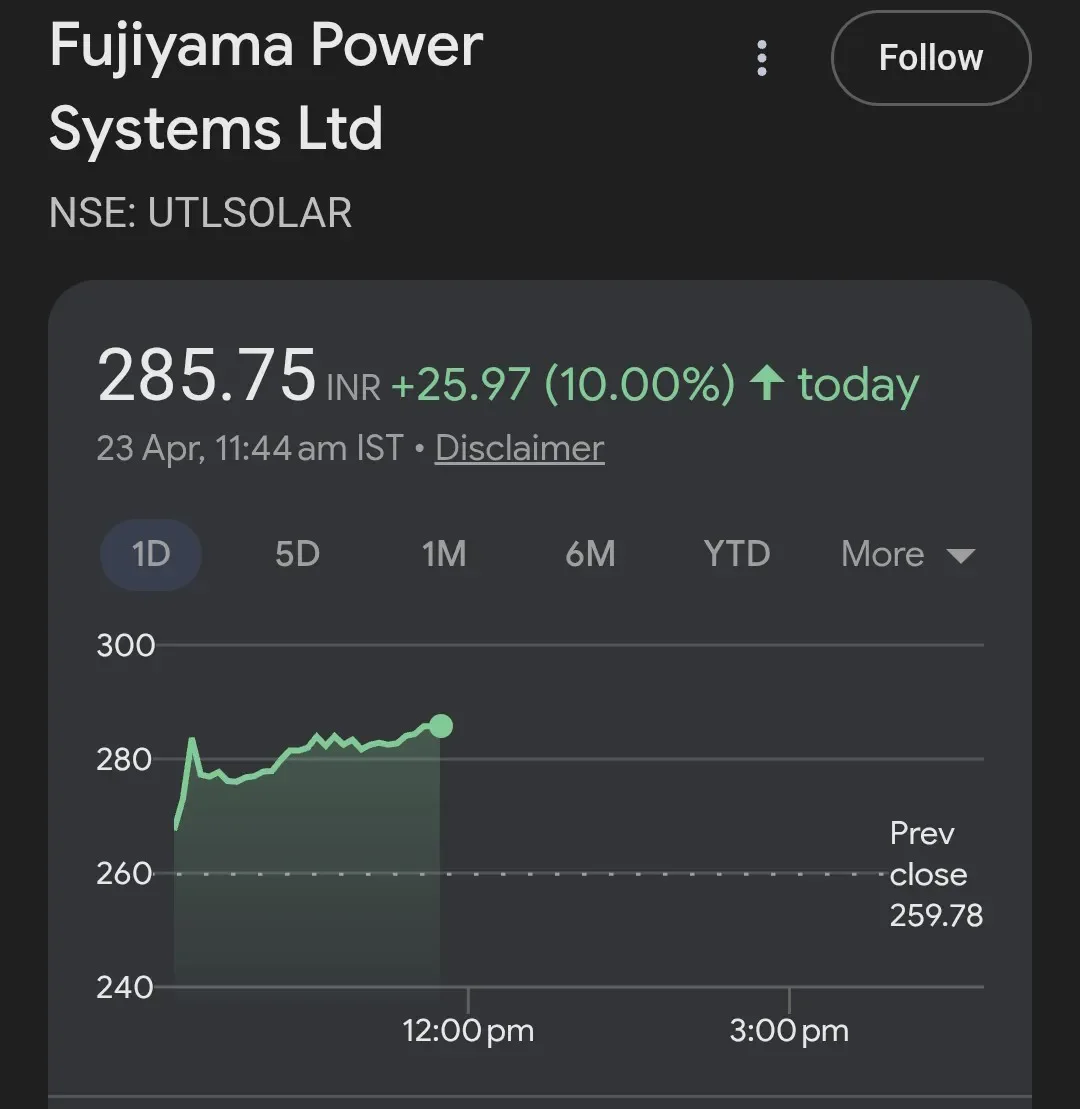
Holding the IPO Yielded 25% Upper‑Circuit Gains
Fujiyama Power (UTL Solar ) : Hit 10% Upper Circuit 🔥 We asked to Hold in IPO.✅ Today it hit 10% Upper Circuit and Now trading with above 25% profit 💸 I asked my priorities members to Hold it. Even I did...
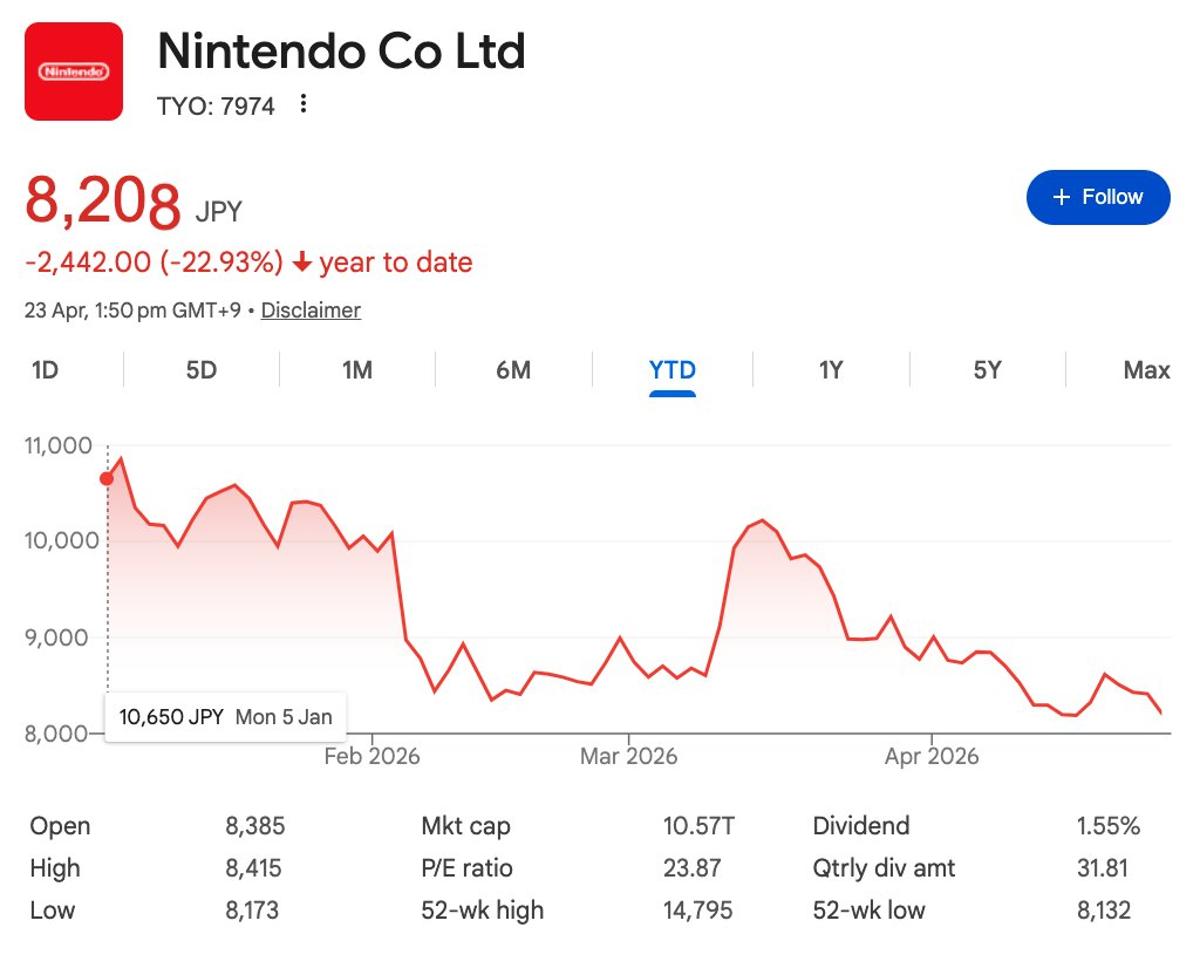
Nintendo Shares Slump, Daiwa Slashes Target Price
1) After falling every day this week, Nintendo stock again down -2.50% currently (1h trading left on Thursday in Japan) and -23% overall this year so far - close to Sony's losses. Today, local bank Daiwa lowered the target price from...
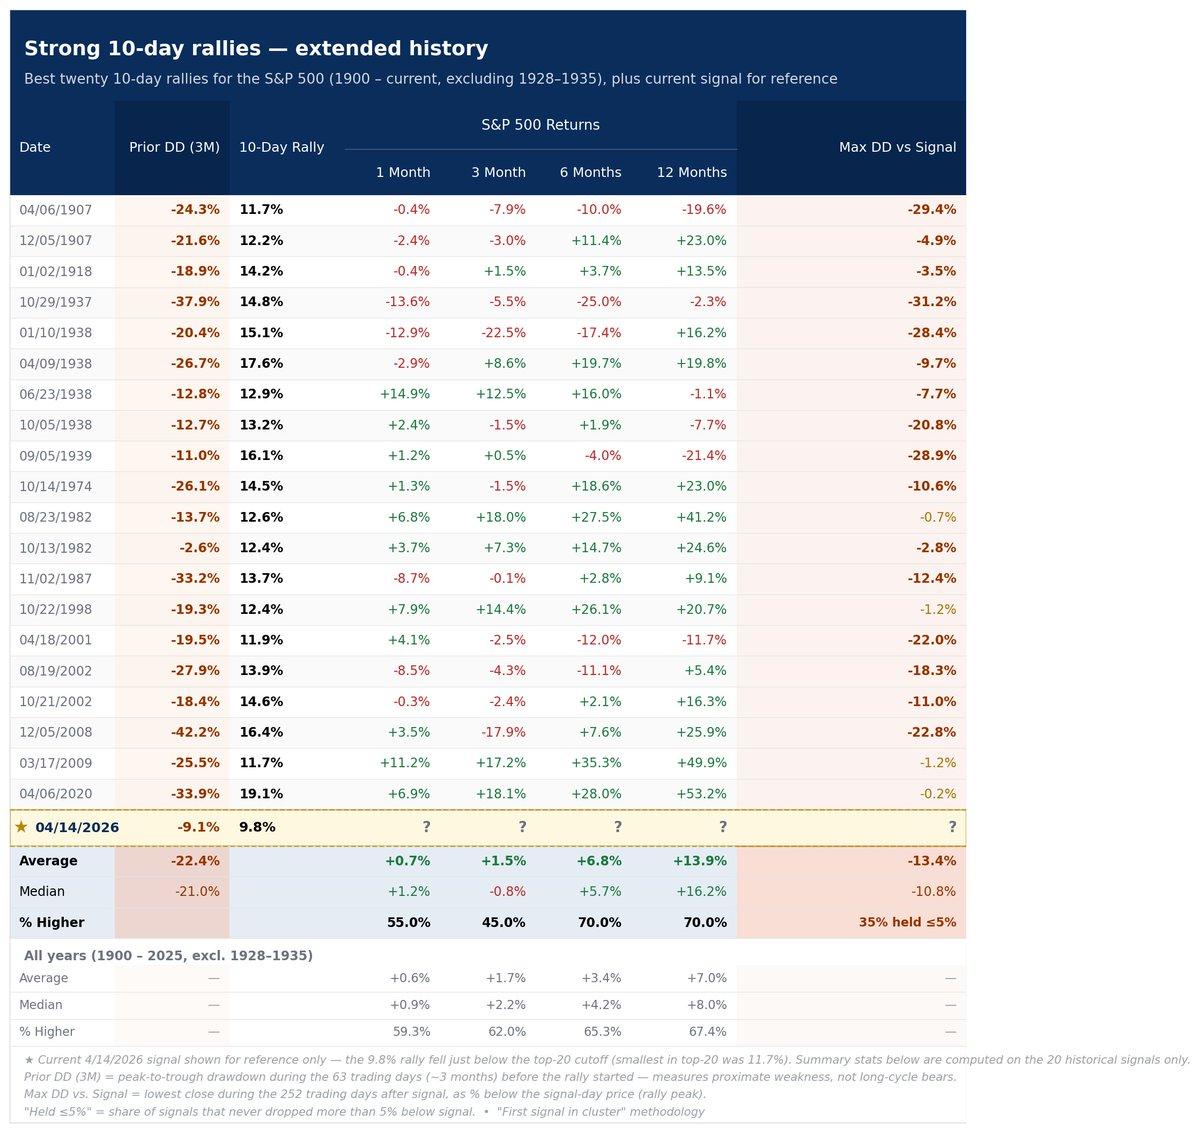
ES Futures Ten-Day Rally Shows Rare Upside Volatility
I remain painfully curious about all these, partly bc I can't recall this type of upside vol above the 50 WMA + experience wise this had ~4 of 10 V markers. Top 20 ten day $ES_F rally's, 1900-Today, depression excl. Added...

Gain Market Exposure Without Chasing: Swing Trade Ideas
Trading markets that go straight up isn't easy for anyone afraid of heights. In today’s video I break down how to gain exposure without blindly chasing, along with a few swing trade ideas, including $OKLO $CIFR $SNDK $CRWV and...

Confirm Breaks and Retests Before Entering Supply Zones
You keep marking a supply and demand zone and entering right away. That’s why the trade fails. High quality supply and demand trades need confirmation. You want a clear break of structure first, then a break and retest before entry....

Interlocking H&S Top: Inverted Shoulder Highlights Potential Reversal
The chart on the right is one of my all time favorites because it features a possible H&S top wherein the right shoulder took the form of an inverted H&S formation. We identify such structure as "interlocking" H&S
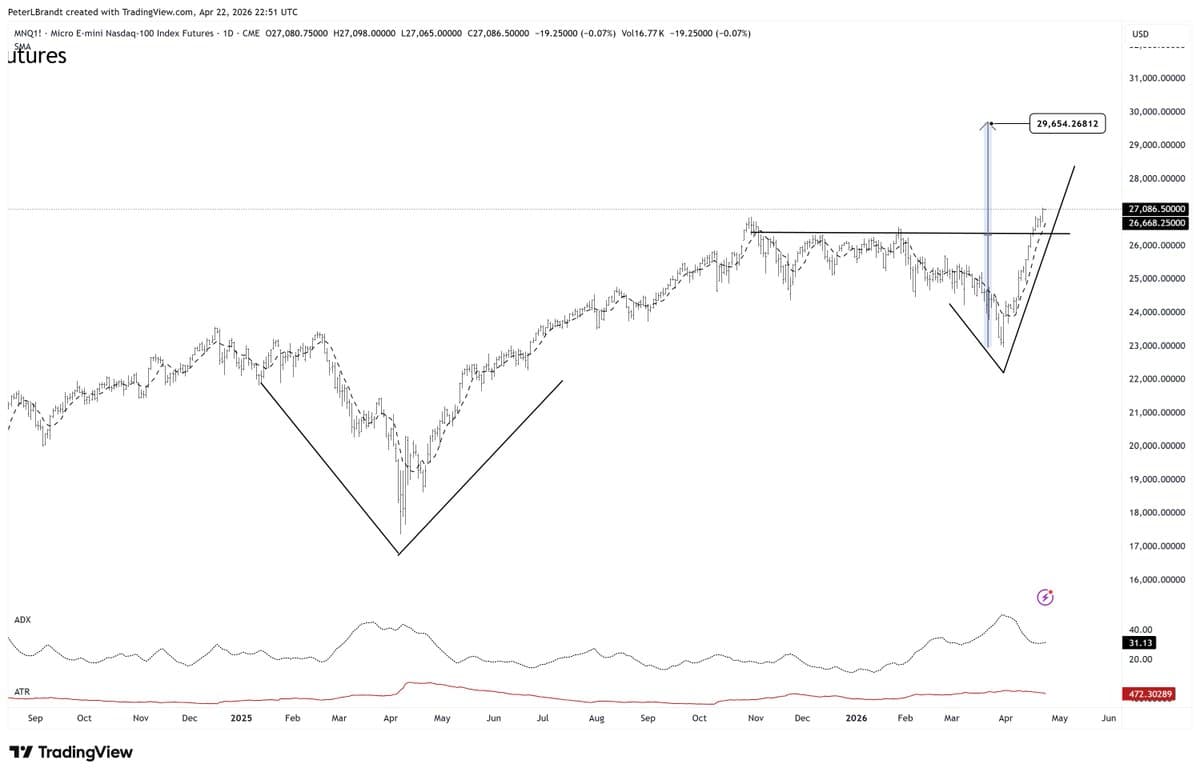
Second V‑Extended Bottom Signals NASDAQ Surge to 29,600
V-extended bottoms are very rare, but they do occur. In fact, this is the second "V"-extended bottom in the NASDAQ in the past year. Now, that is rare. It portends higher prices with an initial target of 29,600 $NQ_F https://t.co/2qSB0vKXhk