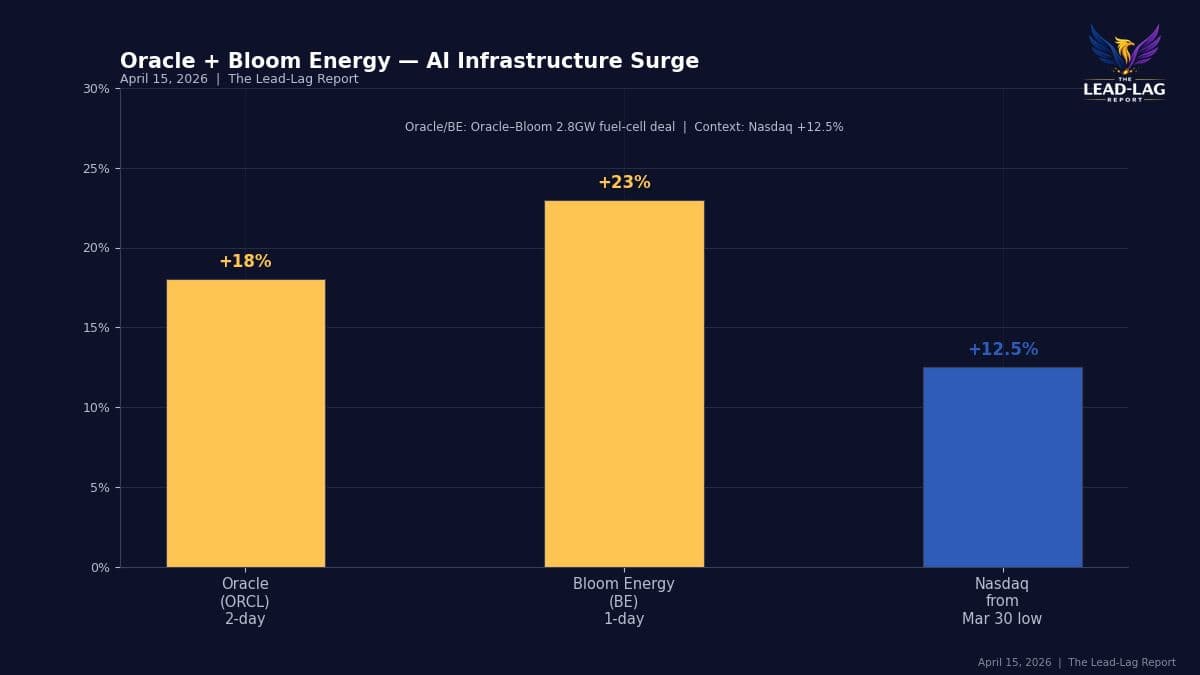
AI Infrastructure Drives Energy Demand, Sparking New Investment Theme
$ORCL up ~18% in two days. $BE surged 23% on a 2.8GW fuel cell deal with Oracle. AI infrastructure is the new arms race — and the energy required to run it is creating a second-order investment theme that most portfolios haven't fully priced. https://t.co/Wm83kXdcQT
UBS Flags Crowded Longs, Calls for More Upside
UBS has $LITE and $CIEN as crowded longs. AKA consensus favorite's requiring more consensus upside/much better results over expectations to move the stock. Sort of feels like many names in optical are getting to be in a similar spot....
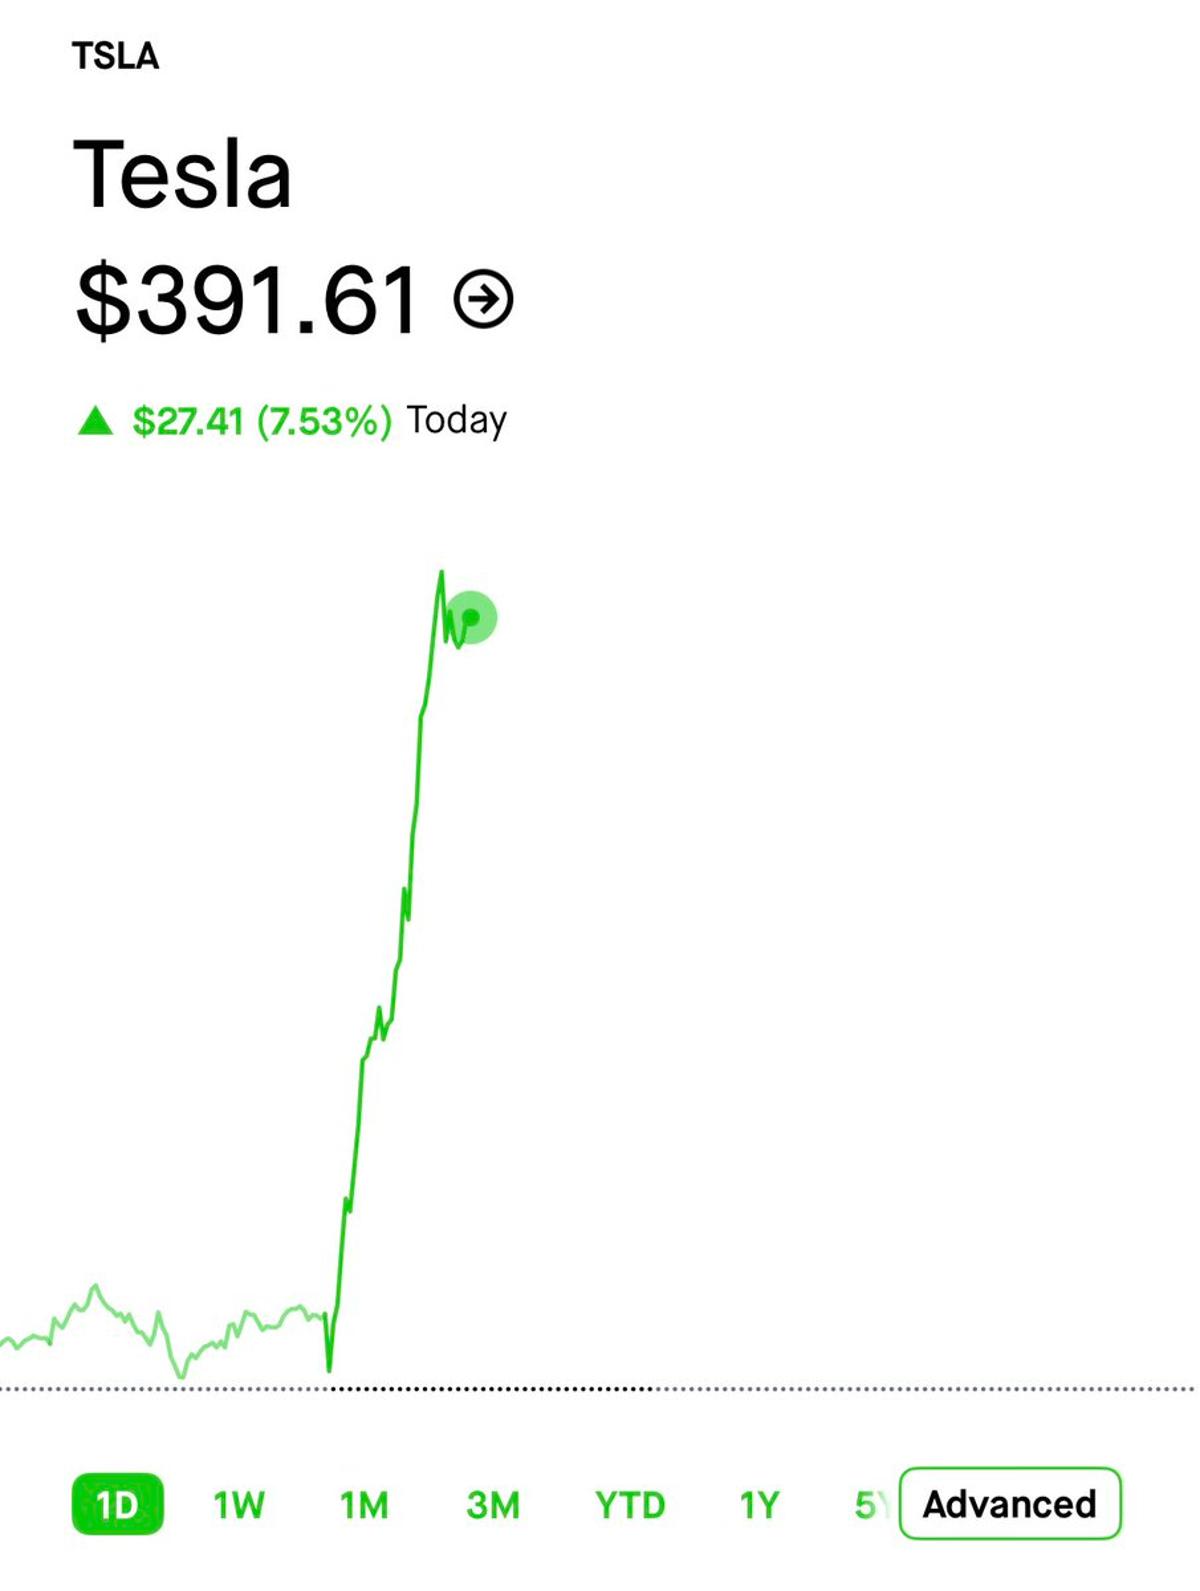
Stock Jumps $337 to $400 in a Week
I love this stock because you can buy at $337 one week and it’s at $400 the next week https://t.co/Mz7nR8AxRu
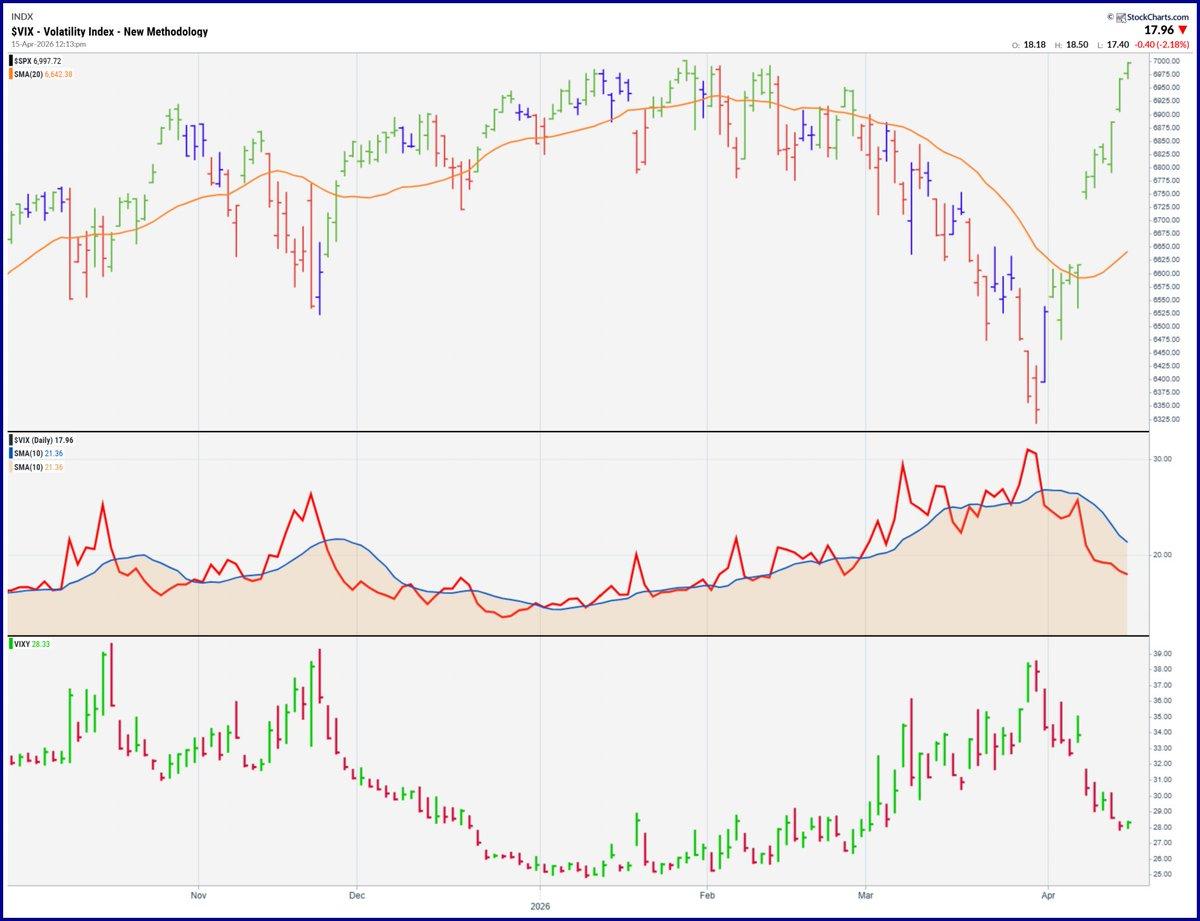
SPY Climbs, VIX Falls, yet VIXY Rises—Who's
Just one day and it's not over - $SPY up ✅ $VIX down ✅ but VIXY up ❌ Which one of you is buying VIX futures?? 🤔 https://t.co/h1DXe2Bnxh

Apple Climbs to $262 After BAML Upgrade
So far so good. Some were long $aapl verse $256 and others added as it cleared and held $262. BAML big upgrade (below was this morning) https://t.co/3RK1zJmCoY
Equity Demand Soars; Markets Unfazed by Hormuz Blockade
Wall Street is choosing optimism. $SPY near record. $QQQ up 10 straight days. Oil falling. Gold rising. VIX at 18. The Strait of Hormuz blockade didn't break markets. That tells you more about modern equity demand than any single data...

Skipped BIRD Liquidation; Stock Surged 467%
I took a look at $BIRD upon announcement of their asset sale as a liquidation play, but figured we may get screwed on the liquidation proceeds, so I passed. Turns out my thesis was right, but the result was very, very...
Swing Trades Thrive; Short‑term Shorts Feel Painfully Stuck
Swings = amazing no complaints best I've done on any market correction to date (except I should have sold 0) ie: $INTC $META $SNPS $ORCL and many others (pretty much anything you bought worked didn't take skill) or like $IONQ...
NVMI Sees Massive ITM Call Buying, Bullish Surge
Nova Measuring (NVMI) strong Semi Equipment name sees massive trade buy 1400 August $490 ITM calls as April $420 adjust a winner from 2/18 that is +50%

SPX Holds Positive Gamma; 7025 OI Leads Upside
SPX overall positive gamma still holding. -7,025 is the biggest 0DTE OI right to upside. -Downside eyes on 6,965 Now trial it in BLOOMBERG: APPS SPOTGAMMA Updating every minute of every day - not that stale bank stuff + see SPX gamma map +5...

Nasdaq Rides 10-Day Streak, Five‑Wave Bullish Momentum
The Nasdaq has completed 10 days of consecutive gains and the hourly chart shows a possible five wave advance in progress. Once complete there could be a pullback but the larger trend should remain bullish #Nasdaq #StockMarket #ElliottWave #TechnicalAnalysis #Indiacharts...
Avoid Shorting Low‑Float Recent DeSPACs, Especially AI
Idiots. Never, EVER short low float recent deSPACs. Particularly those with a (somewhat) AI angle these days $MRLN

Late Short Squeeze on IONQ, QBTS Prompted Quick Exit
I was short $IONQ and $QBTS from lower prices. I knew I was late to the short trade so fortunately they were extremely tiny positions. With the squeeze continuing at the open I covered them and quit the trade for...

60M QQQ Call Options Set to Expire Today
QQQ $60M of Jan. 575 and March 590 calls look to be cashing out today

QQQ Buyer Shifts 20k Calls, Signals Overbought
Nasdaq (QQQ) buyer 20,000 June $675 calls $4.26, adjusts June $640 taking off some Delta into overbought

Buy April 185/187.5 Call Spread, Sell 177.5 Put
$MS "Trade Idea 2: Buy the April 185/187.50 Call Spread ($1.25) and sell the April 177.50 Put for 40 cents." puts expire, sell to close call spread on any weakness in stock or can watch to see if maxes out...
Buy BAC 54/55 Call Spread, Sell 52 Put
$BAC "Trade Idea 2: Buy the April 54/55 Call Spread (34 cents) and sell the April 52 Put for 1 cent.' puts expire, sell to close call spread on any weakness in stock price.

Uptrend Pullbacks Offer Prime Cash Deployment Opportunities
although my 50/200 $SPX model didn't quite reach that lower horizontal washout line, indicating solid intermediate-term pullback relative to long-term uptrend, the story is the same... pullbacks in uptrends are helpful for those trying to deploy cash... https://t.co/TheoptTSBK

Broad Market Buying, Yet Oil and Dollar Remain Weak
you can see that there has been buying everywhere, here is a daily/weekly #MACD & force index layout... i refer to my #doubledouble list, which is positive #MACD and postive 13-day force... only, oil/commodities/$DXY sitting double negative... #AssetWatch https://t.co/X3Xuvt6PU8

Canada’s EWC Outperforms U.S. Indices Amid Market Rise
as you look at the U.S. stock market rising, don't forget those relative trends, which favour Canada $EWC, no matter U.S. equal weight $RSP or cap-weighted $SPX https://t.co/50q7XPZYxo

Selective Momentum: Buy Pullbacks in Catalyst‑Driven Stocks
🔥 Here’s is my🔥 #stickynote for April 15, 2026: Markets setting up with selective momentum — watching autos, nuclear names, and beaten-down retail for opportunity 👀 🧠 Economic Headline: Inflation data + earnings remain in focus today, with traders balancing macro pressure against...

HOOD Still Strong; Trimming Some, Holding Rest
$hood is still working great from Mondays entry that i discussed on @StocksOnSpaces @WOLF_Financial Monday 3:00 I’ll trim some and hold some https://t.co/7ndBMm8TfG

Copper Prices Overextended; Must Revisit 5‑Year Mean
Copper Peak Inklings? Stretched From 5-Year Mean Copper faces up-too-much risks near the start of 2Q. If the metal doesn't revisit its five-year moving average at $10,253 a ton, it would be the first year since 2021. Copper dropped 14% in...

Energy Giants Plunge, Tech Stocks See Modest Pullbacks
Current drawdowns from 52wk highs.. $AMZN -3.6% $GOOGL -4.7% $AVGO -5.6% $NVDA -7.5% $XOM -15.7% $CVX -12.9% https://t.co/XWIU5wCgQt

Quality Factor Weakens as QUAL Underperforms SPY
The quality factor has softened, $QUAL vs $SPY falling below its 200dma. ... More on this tk from me on @stockcharts @soberlook https://t.co/62ONaGmlte

VSA Strategy: Trap Shorts, Squeeze Liquidity, Repeat
Here is more color from @IUTraders on the idea posted last week on $VSA on here $VSA game plan like the $UCAR idea you saw posted in the .5x's Trap set, punish shorts, squeeze out for liquidity on FTD. Repeat. Left 1/3...
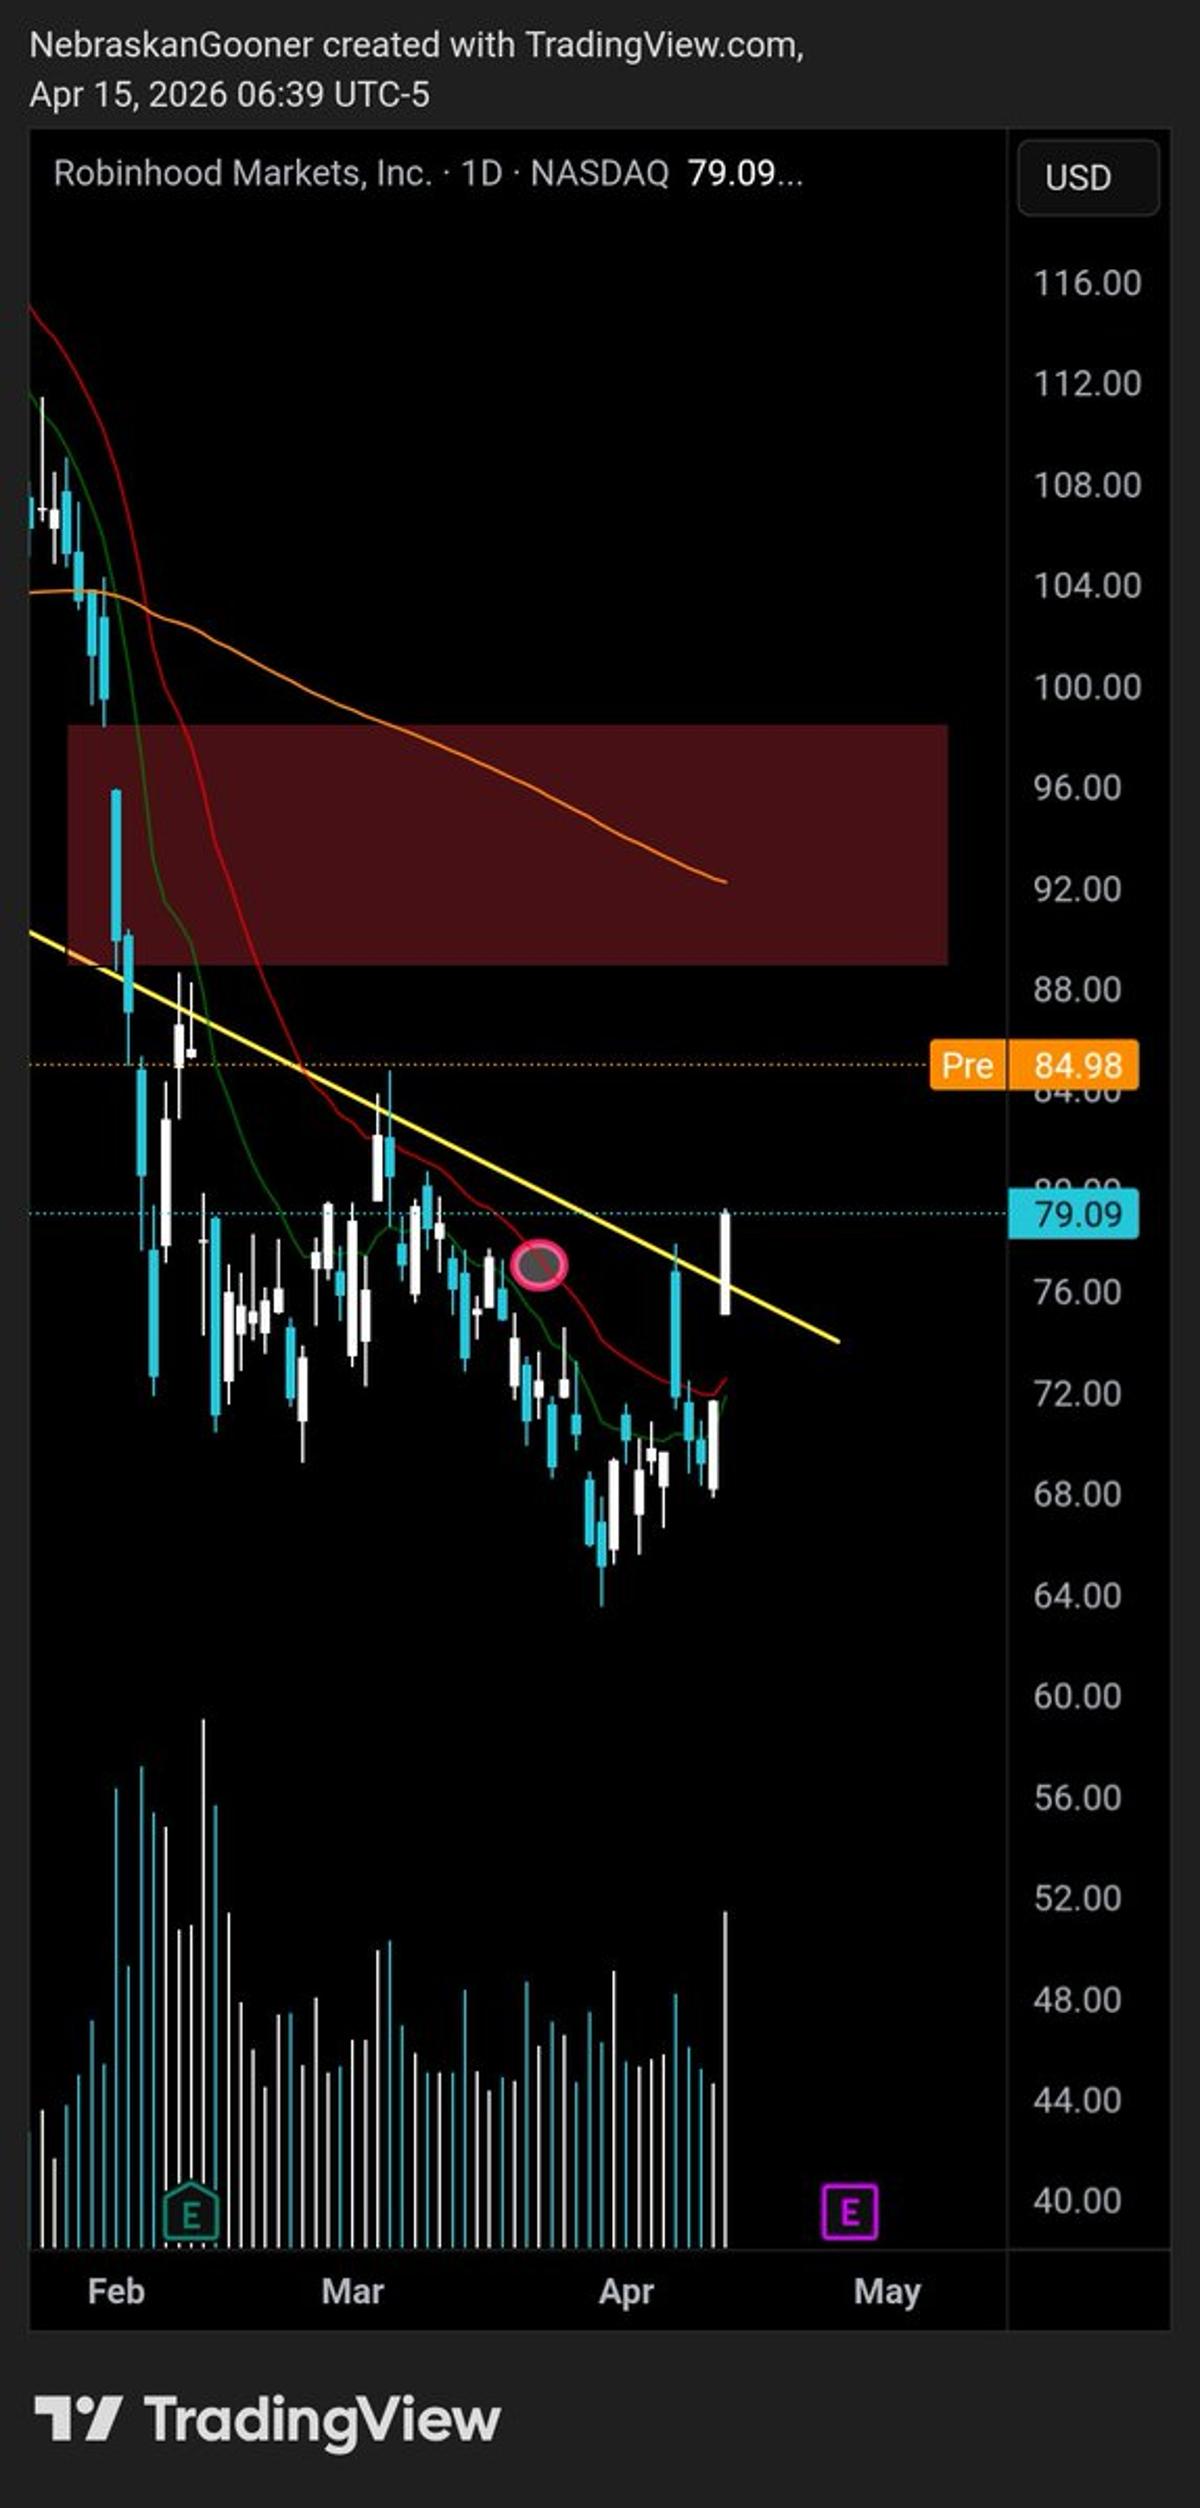
HOOD Surges 8% Toward Chart Resistance Target
$HOOD Big 8% gap up this morning. Already almost to my resistance target mentioned in my chart analysis video yesterday. Wow https://t.co/9ORAFXoWto

NVDA Forms Classic Head‑Shoulders, Target Set at Shoulder Height
$NVDA is a textbook example of the H&S pattern with a target now equal to the height of the H&S projected upwards from the right shoulder high. https://t.co/Fet2aA2lGX

NVDA H&S Failure Signals Bear Trap, 236 Target
A textbook example of the H&S failure is $NVDA. Here an 8-month H&S top was completed briefly on Mar 30 with NO follow through. This was the first point when a bear trap was detected. The target of a H&S...

AI Stocks Rally 10 Sessions, Near Historic Peak
The 10-session surge in AI stocks off the March 30 lows is a smidge off their best performance ever during this boom https://t.co/UBIyY0DJwL

One Line Suffices; Extra Lines Are Rookie Overkill
Hey aspiring chartists If you need to draw more than one line on a chart to find a trade you are in big trouble One is all that I ever really need for any given trade Anything more is rookie overkill https://t.co/vu4M7wmjMS
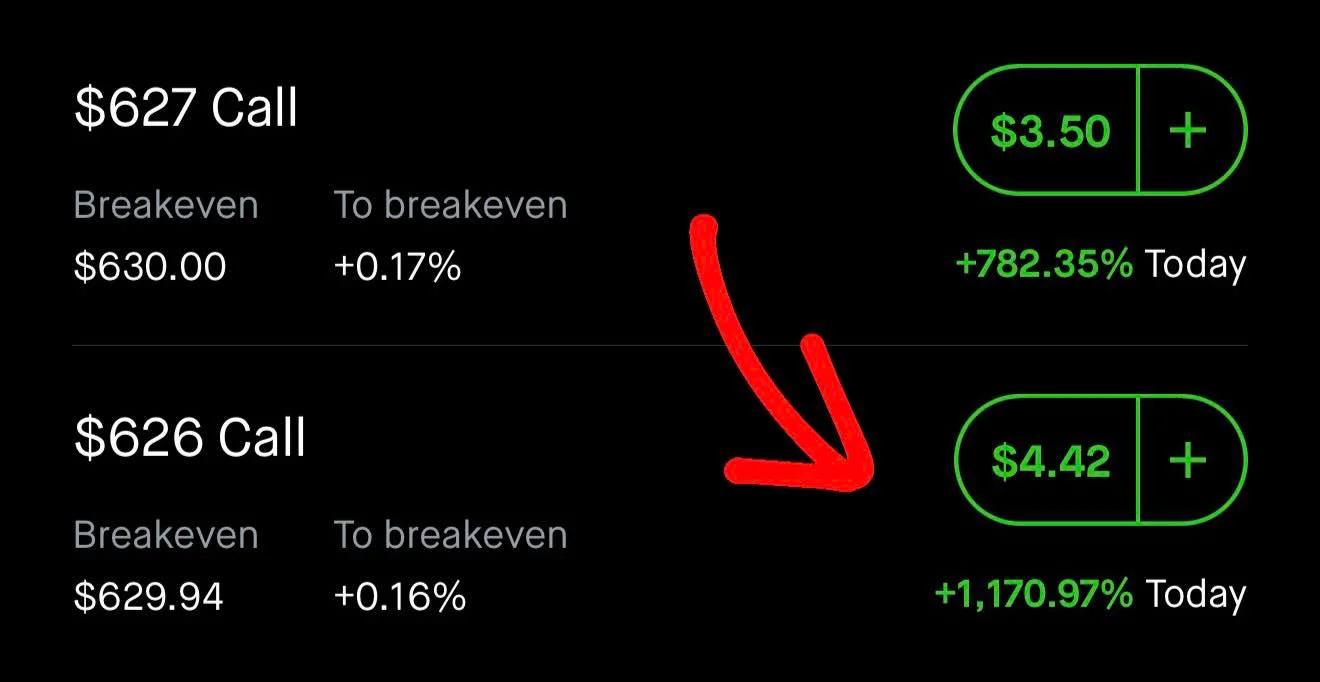
Timing, Not Luck, Drives 10x Options Gains
Is it luck or timing? How some traders make 10x on options in a single trade.
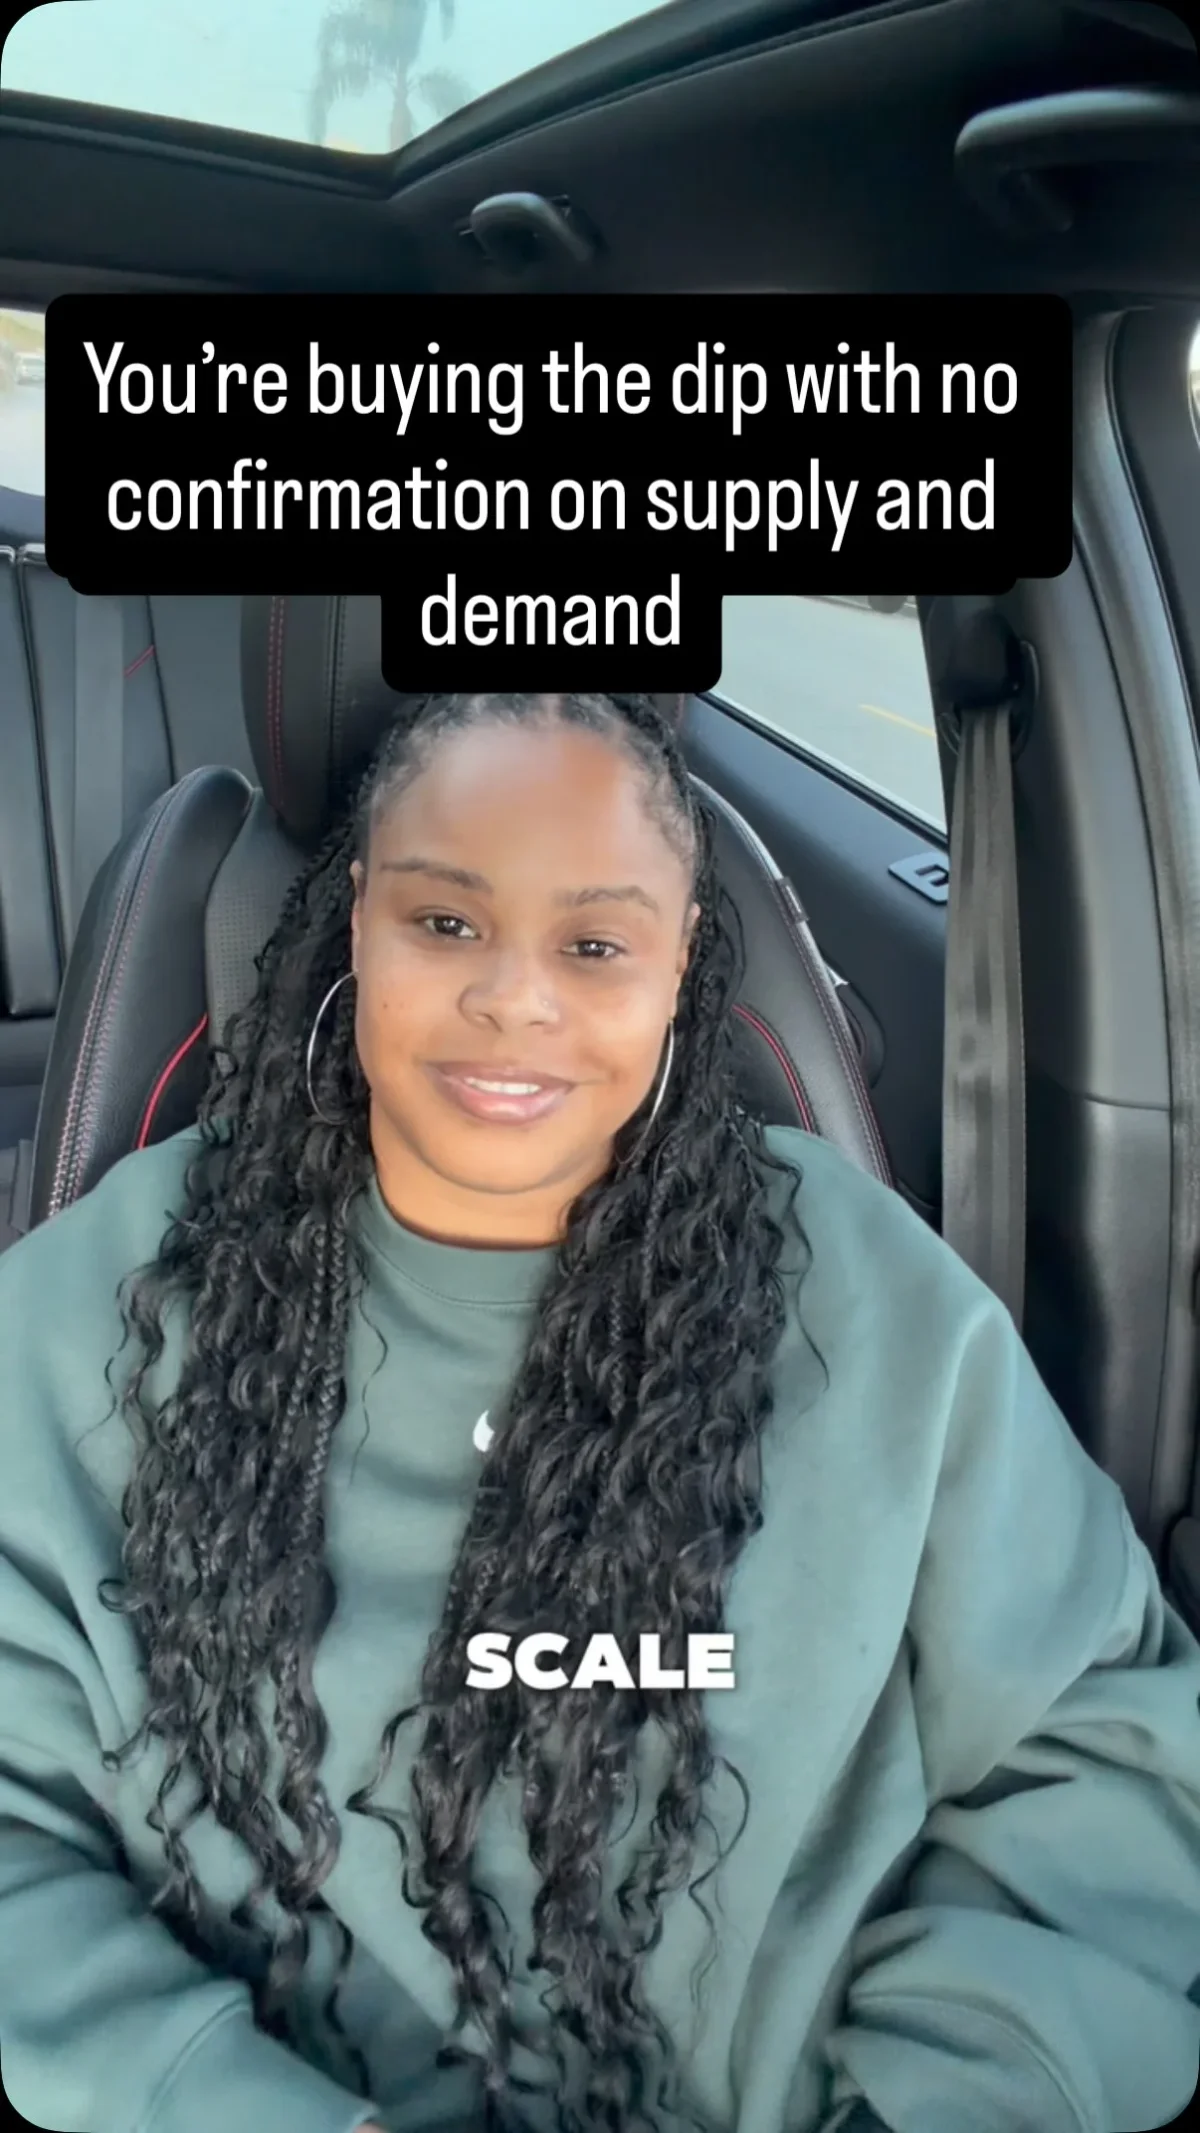
Enter Only at Higher‑Timeframe Demand Zones, Not Random Pullbacks
You keep trying to buy the dip and wondering why it keeps failing. It’s not the market, it’s where you’re entering. Most traders don’t use higher time frame supply and demand, they just buy random pullbacks and hope it holds....
Netflix Trade Aims to Flip $2.50 Loss Into $6 Gain
$NFLX 1/20/26 Earnings Trade, short Aug. 80 puts, long Aug. 100/115 call spreads at $2.50 credit With it back to 200-MA and into next report, can take this off at $6 Turning -2.50 into +6 always nice

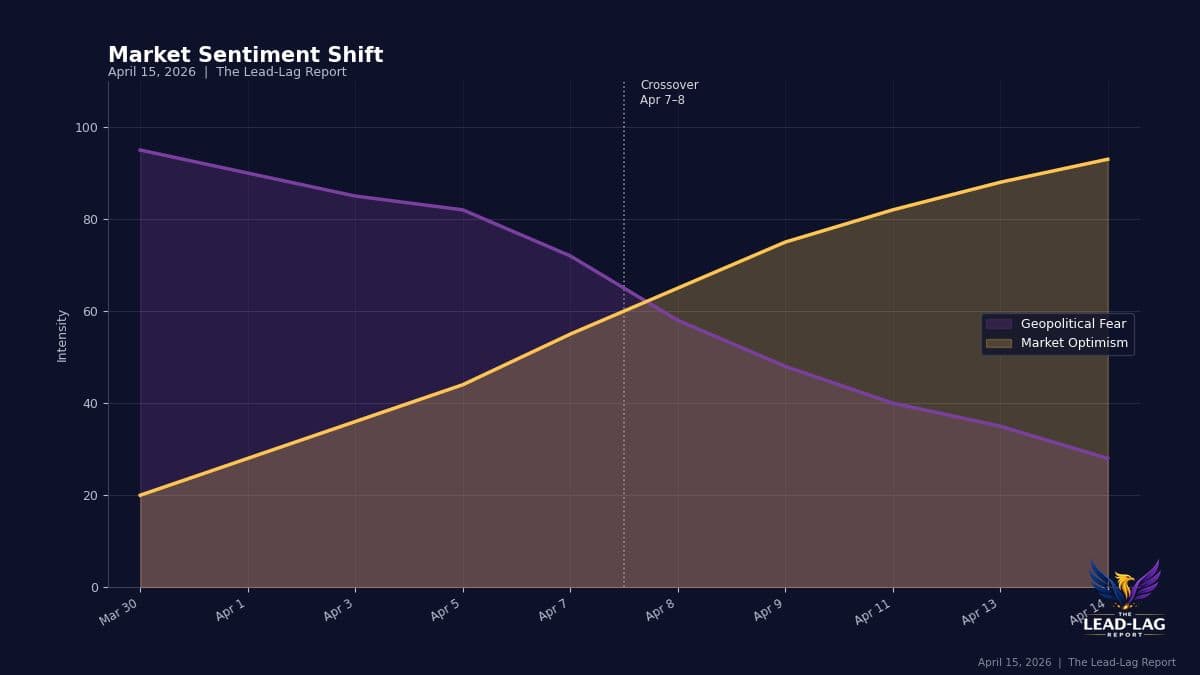
Markets Shift From Fear to Fundamentals, Target Energy, Banks
Market is repricing from extreme fear back to fundamentals. What’s happening? •Unwinding of geopolitical risk built during initial escalation of war. •Talks continuing, probability of extreme outcomes declining—for now. •Stocks rebounding, USD softening, oil down from elevated levels, gold resilient. Opportunities...
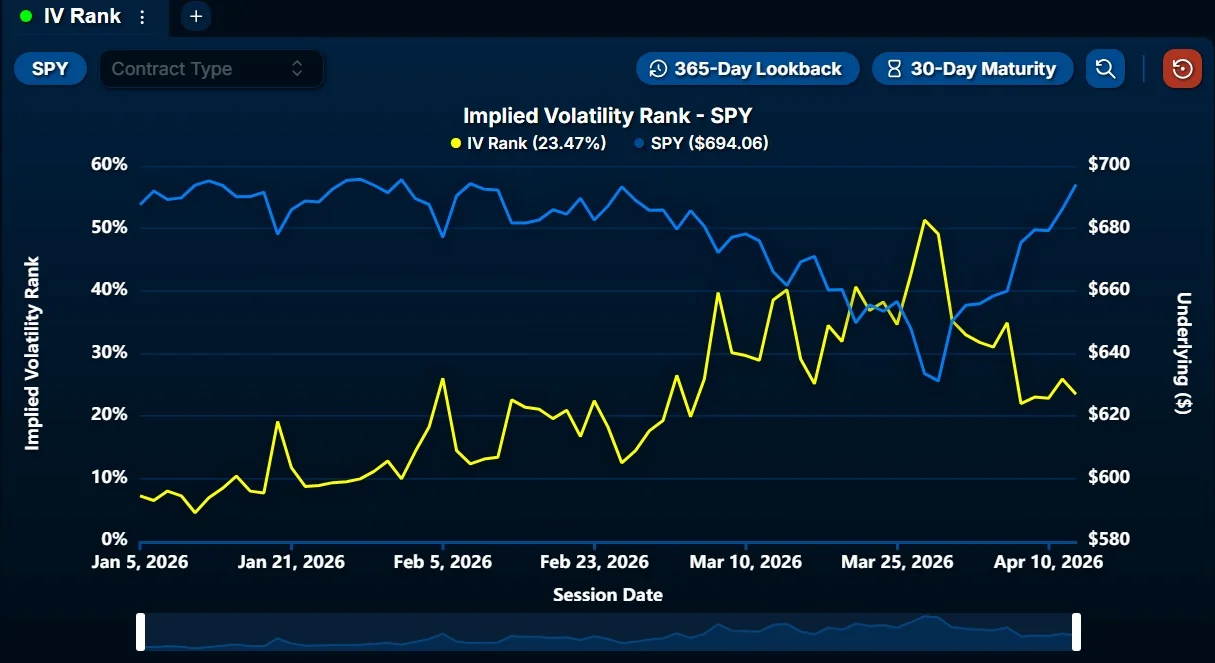
SPY Volatility Near Pre‑war Levels, Gamma Gains Focus
Implied vol on $SPY is practically back to pre-Iran war levels. As vol compresses, exogenous drivers become less dominant, and dealer hedging flows have a greater influence on price action, making gamma exposure increasingly important to monitor.

VT Nears Weekly Highs; Breakout Risky Without Base
$VT weekly (world fund) almost at highs after 3 week bounce on 50sma. Breakout here (>150) stretched has higher chance of failure if no base https://t.co/8AxdZJcF9r
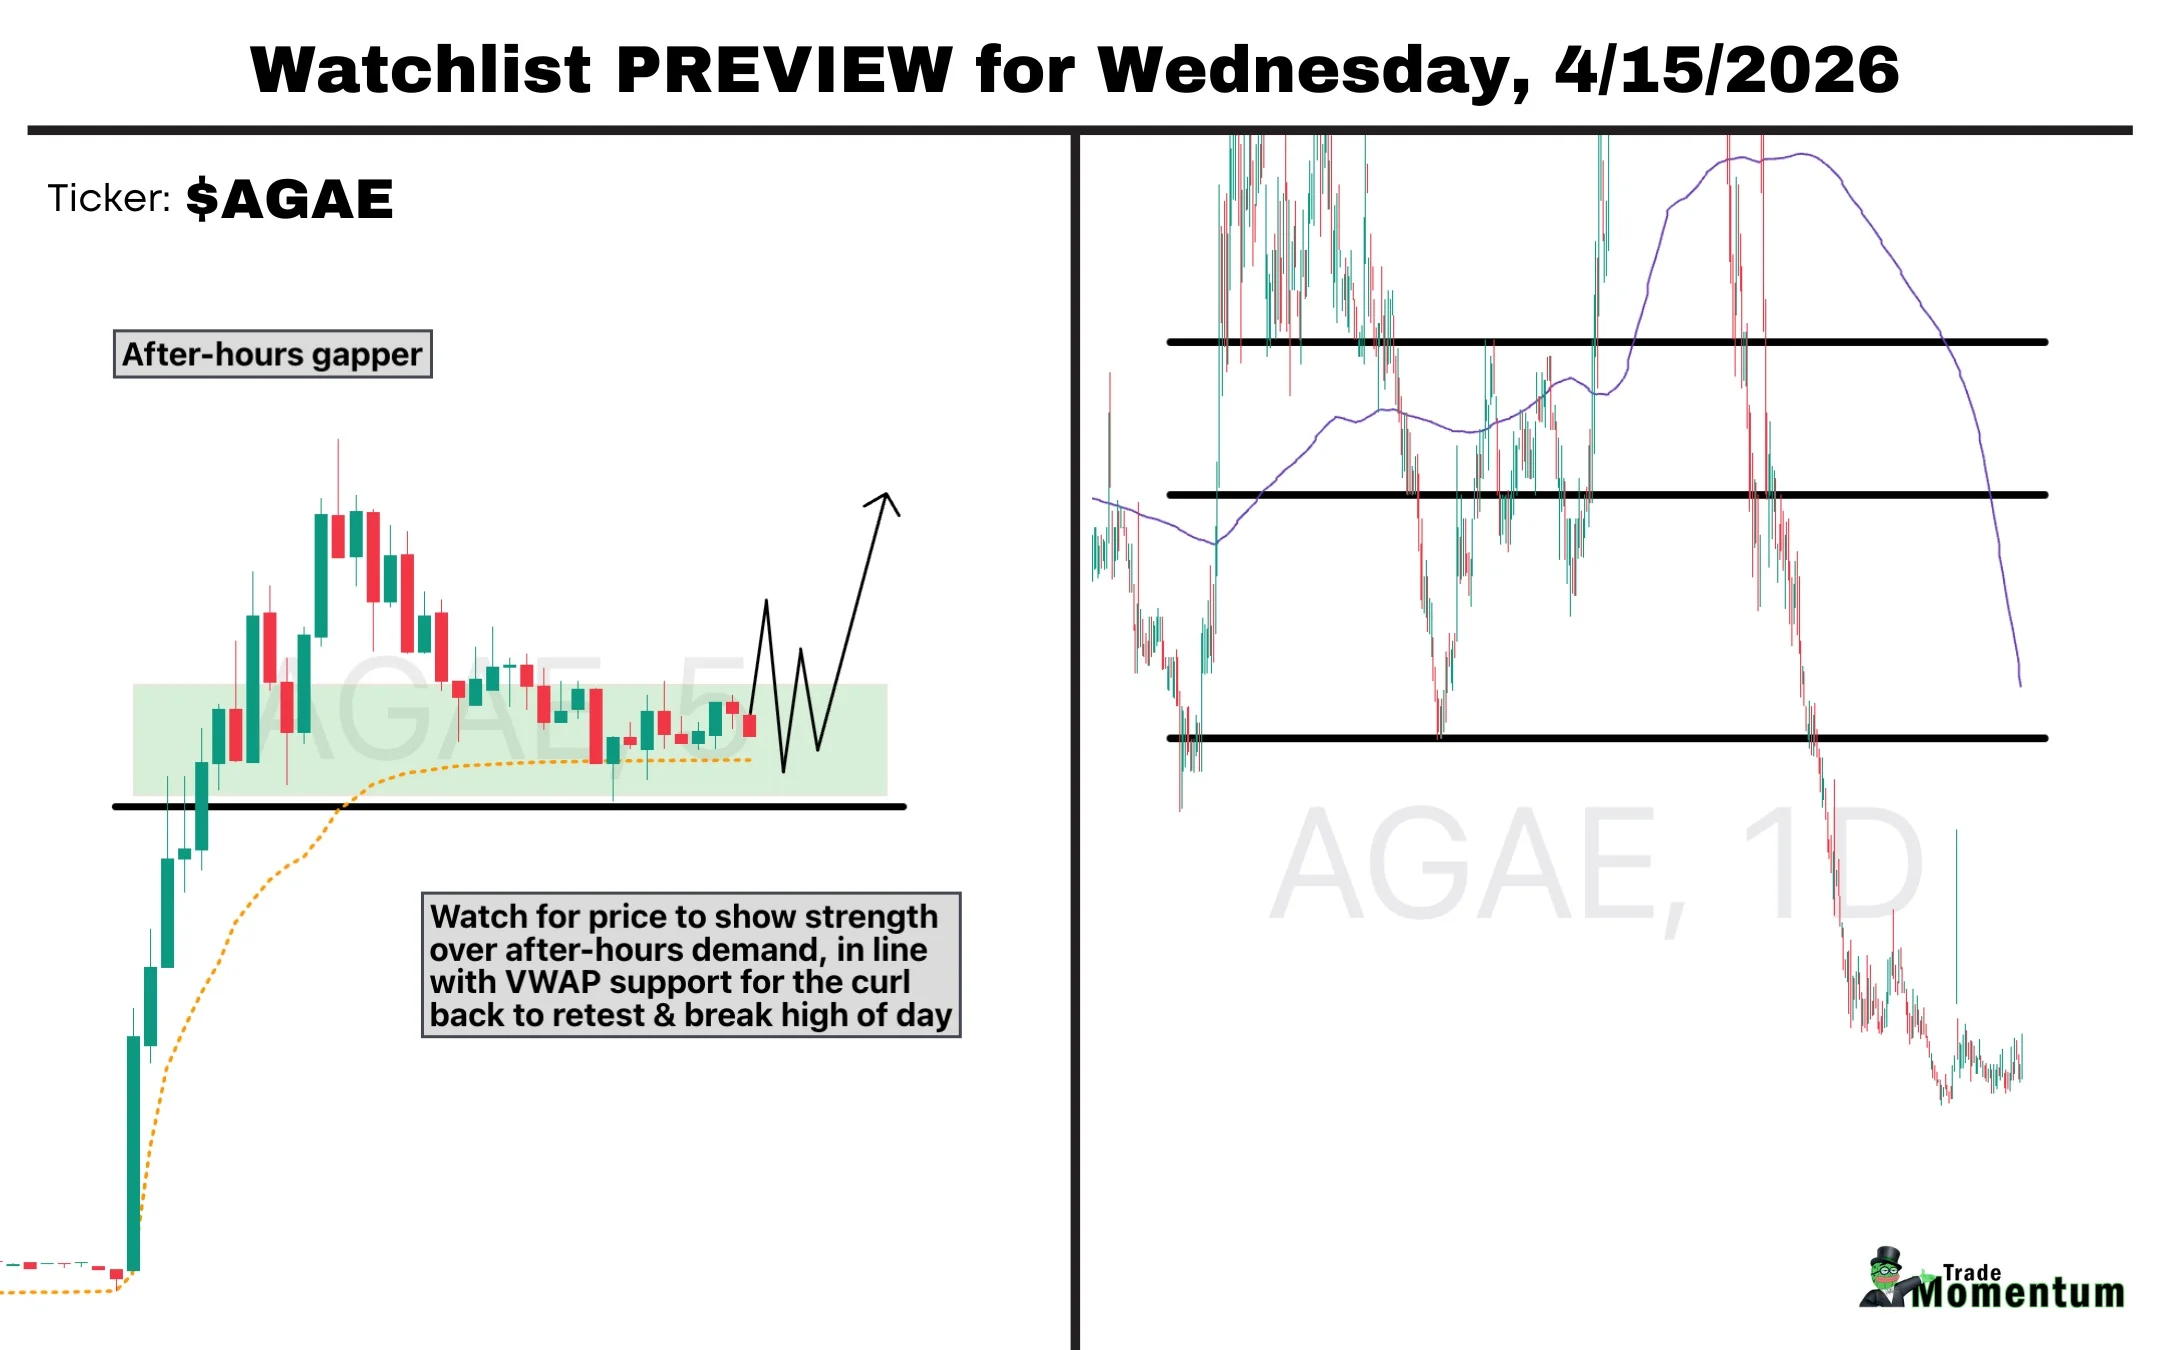
AGAE Settles Litigation, Surges on After‑Hours Volume
$AGAE - "Allied Gaming, Knighted Pastures settle litigation, end all outstanding matters" Over 17x relative volume here in after-hours on $AGAE, as it's testing the pivot over its daily 200MA... making it a definite watch for tomorrow. Will likely update my plan...

Policy Push Sparks V‑Shaped Tech Rally, Risks Lurk
Trading A Policy Intervention V-Shaped Meltup $IGV $SPX $ORCL $MSFT Policy intervention headlines, mechanical flows & short covering triggered a sharp V-shaped rally - led by tech. Momentum is strong, but risks remain that could quickly reverse the move. https://t.co/2MbhKAp47Z

Free Webinar: Spot Market Leaders After Corrections
I'll be hosting a free webinar on how to find market leaders during a new uptrend this Thursday ✅ Finding Market Leaders after Corrections ✅ Best Growth Stock Screens ✅ Technical Criteria to use It will be recorded & sent to everyone who registers👇 https://t.co/FI41AZDYcr

SPX Repeats Rare Back-to-Back 1% Rally After Lows
Odd market stat of the day. In 2025, the $SPX's first back-to-back 1% advances happened after the low: 4/11-4/14/25. In 2026, the $SPX's first back-to-back 1% advances after the low JUST happened the last two days: 4/13-4/14/26....

S&P 500 Posts Biggest 10‑day Rally Since 2020
The S&P 500 is up 9.83% the past 10 trading days, for the best 10 day gain since coming off the COVID lows in March 2020. https://t.co/iPKDHL8E1N

EWY Gap Fill Pending: Pause or Surge to ATH
$EWY South Korea gap fill in play.. will she pause or bust through to ATHs? @stockcharts https://t.co/pLhBGqVXTt https://t.co/ucpng2vOUR
S&P 500
#SP500 Up Candle near ATH 7002. Support 6790, 6740, 6600. RSI 61 not high. 13/21 day EMAs Bullish. Top Bollinger Band 7013. Midpoint Line 6715. Bottom Band 6425.

Portfolio Shifts to Cash, Short US Equities, and Put Spreads
On the close. Raised cash in Beta by 10% of AUM trimming commodities, gold, and US and ROW Equities. Up to 30% Cash. In Alpha went max short US Equities. Two and Six Month Put Spreads totaling 4%...

Take 5% Tiered Profits; Oscillator Signals Exit
Btw it doesn’t mean short the market or I’m calling a top. These are my guidelines on the BOS Account. Carve out at least 5% on each tier. Especially if it only takes a month. Oscillator is +75 and...
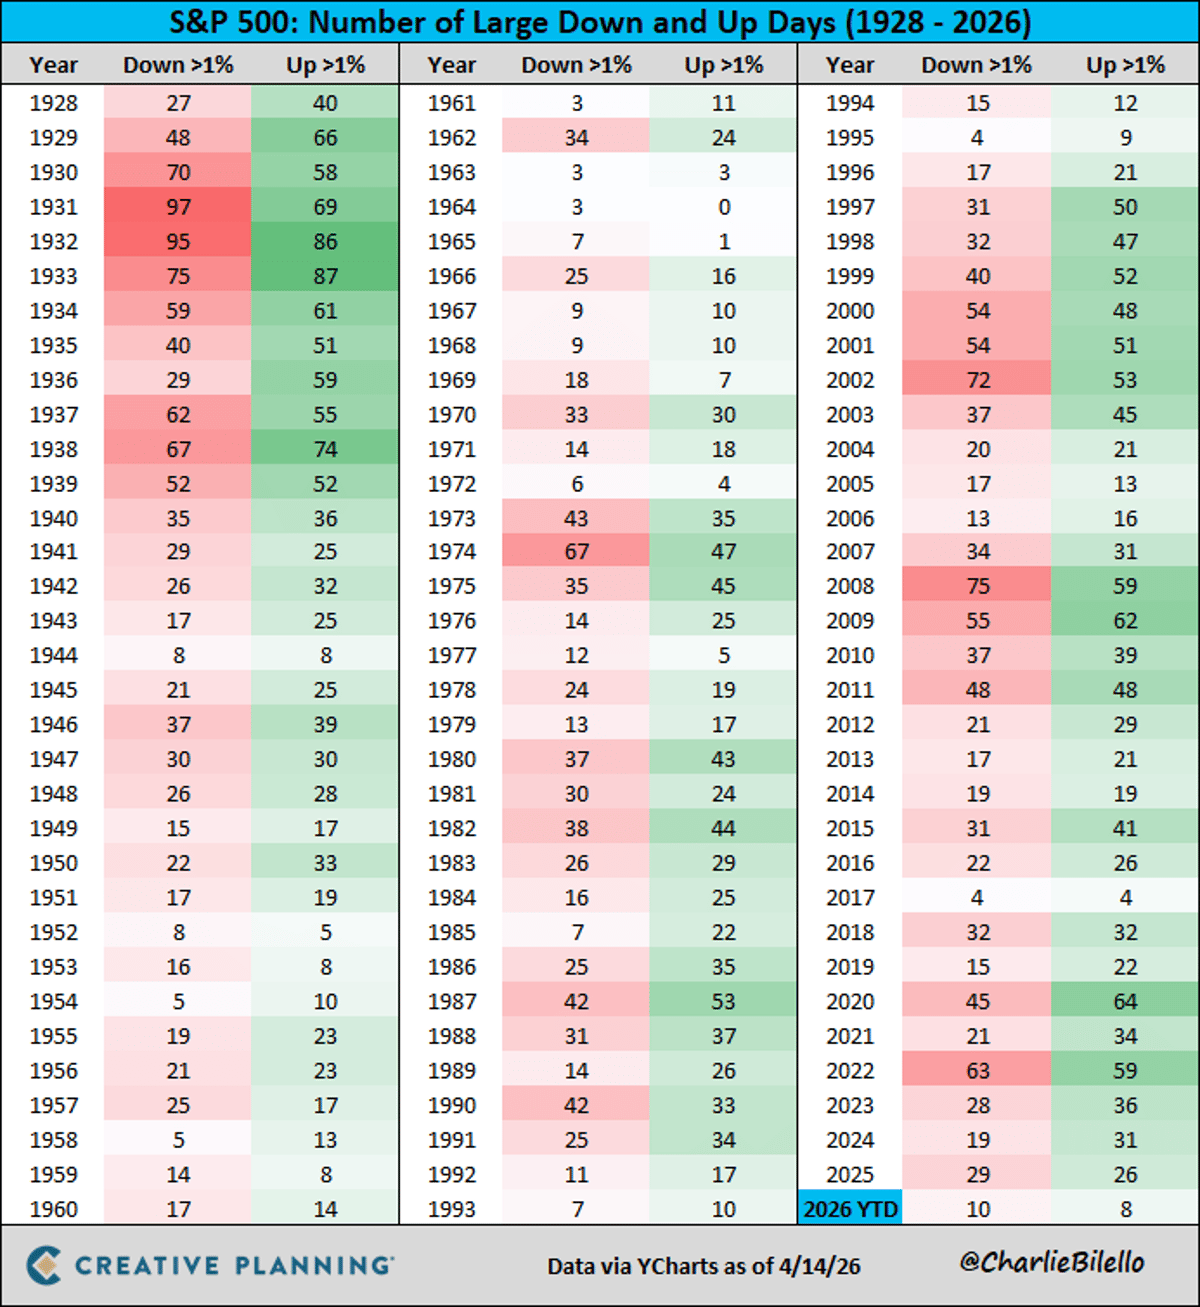
Volatility Clusters: Big Ups Follow Big Downs Near March Low
The S&P 500 rose 1.2% today, its 4th big up day (>1% gain) in the past 2 weeks. The V-shaped recovery off the March low is another reminder for investors: volatility cuts both ways and is not linear over time....

US Momentum Factor Hits 10-Day Rally, MTUM Record
The US momentum factor has also rallied for 10 consecutive days. Could be $MTUM's best streak since its inception.. not sure @augurinfinity https://t.co/LrS9XAM2sB https://t.co/gyhP3tzHnY

QQQ's 10-Day Rally Nearing Pullback Warning
$QQQ - 10th up day in a row. Closed above the 78.6% retracement of the recent downtrend. The next resistance is the ATH at 637. The 5 day RSI closed above 90. This happened only twice in the last 12...

High‑Risk $250 Short on $CAR: Not for Rookies
$CAR there's a $250 per share short trade on the back side. Patience and respect your stops. Not a trade for rookies.