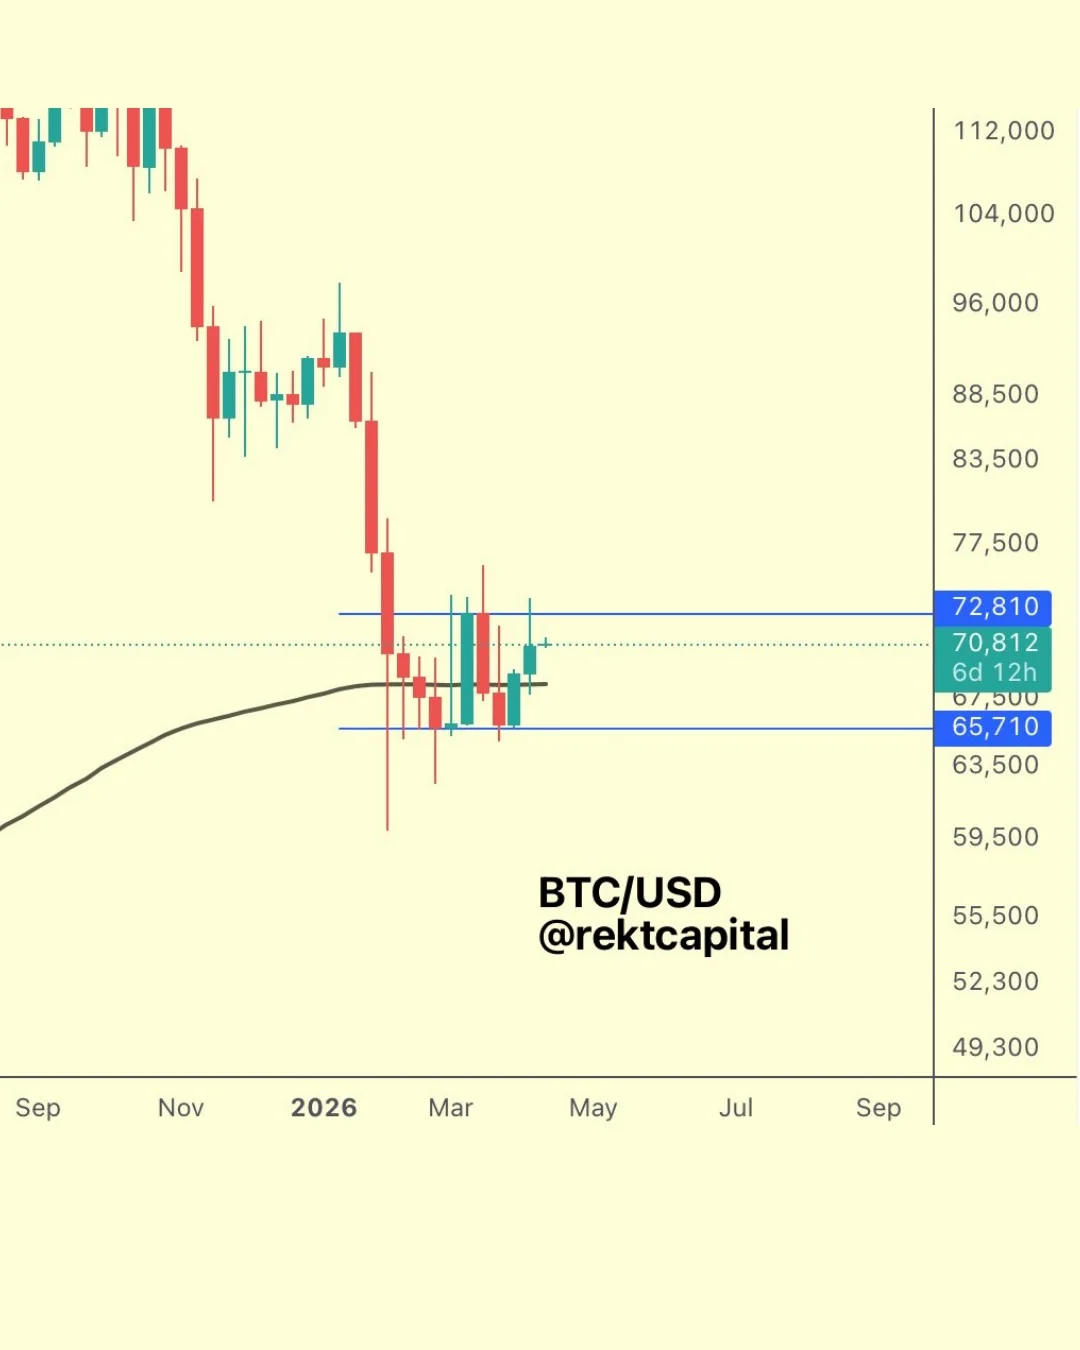
Bitcoin's Double Bottom May Signal False Bullish Breakout
#BTC Bitcoin has built a cluster of price action at these levels and one could even make the argument for a Double Bottom formation here Bitcoin would need to Weekly Close and/or post-breakout retest the top of the Double Bottom (blue $72810) to confirm a breakout However, historically at similar phases in the Bear Market Cycle, Bitcoin has developed seemingly bullish structures only to have them fail and precede additional Macro Downside $BTC #Crypto #Bitcoin

FSLY Faces Steep Decline; Consolidation Needed Near 50‑SMA
$FSLY 50sma and gap AVWAP spot. Decline to it was very steep, may need more time to consolidate https://t.co/QcI9AbZb5t

IONQ Rallies Post‑catalyst Gap, Based in College Park
$IONQ extremely strong follow through after the catalyst gap yesterday. I just realized they are based in College Park MD. https://t.co/gg9uX9E79T

AIM Shares Show Bullish Momentum Near 820 Resistance
#AIM All Share small Up Candle, arguably a doji, but rising. Resistance 820, 837. Support 769, 750, 726. RSI 61.5 not high. 13/21 day EMAs Bullish. Top Bollinger Band 813. Midpoint Line 761. Bottom Band 710.
IONQ Short Interest at 22% Sparks 50% Rally
As of 31 March, the short position was equal to ~22% of $IONQ outstanding shares. The stock has rallied ~50% over the past couple of days, on watch for more short-covering in the days ahead.

Nasdaq Hits New ATH, RSI Suggests Further Upside
#Nasdaq Comp big Up Candle and New ATH (just) 24026. Support 23331, 23000, 22501. RSI 65 not that high so more room for gains. Top Bollinger Band 24150. Midpoint Line 22684. Bottom Band 21245.

SOXX Posts 29% Gain, Best 24‑year Rally
$SOXX +29% last 11 days.. best rally in 24 years More from me on @stockcharts https://t.co/4cER6C7dmo https://t.co/bwzdKb6wNM

QQQ and IGV Diverge Sharply: New Analysis
$QQQ vs. $IGV: The Big Divergence. New free article. Link in reply below. 👇 https://t.co/niTHsllJbH
S&P's 11‑Day V‑Recovery Shows Power of Price Action
While skeptics focus on Trump, the Middle East, and oil prices, the S&P 500 just staged a V-shaped recovery to new highs in only 11 days. After more than 40 years of successful trading, I still don’t rely on gut instinct...

S&P 500 Options Hit Record $15B Positive Delta
S&P500 options registered +$15 billion positive delta today. Highest I've ever seen. That is nuts. https://t.co/gAFHpty8kz
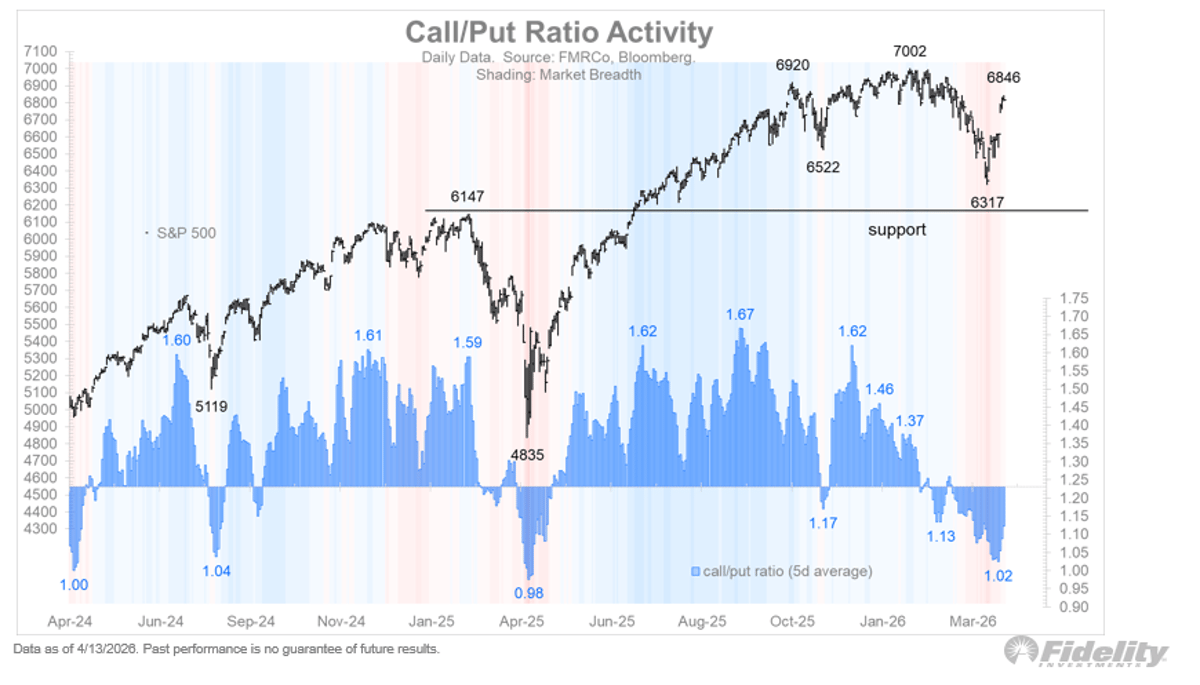
Market Rally Fueled by Call/Put Oversold Reversal
One support behind the market’s surge last week was the reversal in sentiment from an oversold extreme, at least as judged by the call/put ratio. That ratio is still negative. https://t.co/i43C3jXDt6

DAX Doji Near Resistance, Bullish EMA Cross Signals Caution
#DAX doji Candle at 50 and 200 day MA Lines. Resistance 24366, 24897, ATH 25507. Support 23482, 23000, 22677. RSI 54 bit off Neutral. Done 13/21 day EMA Bull Cross. Top Bollinger Band 24522. Midpoint Line 23557. Bottom Band 22593.
Avis Shares Quadruple as Two Owners Hold 108%
Short Squeeze: Avis Stock Has Quadrupled In A Month — Two Owners Control 108% Of The Stock - View from the Wing https://t.co/JFyOZttcKq
Brent Oil Near Neutral, Watch $90 Support, $100 Resistance
#BrentOil Comp Doji Candle and Sideways 6 days. Support $90.4, $84, $73.2. Resistance $100, $103.9, $112.1. RSI 52 near Neutral. 13/21 day EMAs Bullish but Lines converging. Doing 8/21 Bear Cross. Top Bollinger Band $110.7. Midpoint Line $100. Bottom Band...

Extended Style Box Shows Significant Red Sector
Actually quite a bit of red on the @stockcharts Extended Style Box I wrote about it today: https://t.co/4cER6C7dmo https://t.co/wXtiLeDXUh

Tech Rallies, Transport Slumps: Nasdaq’s Best Day Since 2023
After a steep decline, Nasdaq Comp vs Dow Transports is just about having its best day since early 2023... bullish reversal favoring tech at the expense of the 'real' economy? @stockcharts $COMPQ $TRAN https://t.co/3GneL22l5O

Microsoft Dips Below 200‑week Moving Average
$MSFT after watching everyone on this website and CNBC point out it closed below its 200WMA https://t.co/3DCIxOHLVO

Bitcoin's Overnight Outperformance Linked to New ETFs
My chat w/ @DavidANicholas… We discuss: -Bitcoin & Treasuries AfterDark ETF (NGHT) -Drivers of btc’s overnight outperformance -10am slam -Will overnight anomaly be arbitraged away? -Bitcoin Tail ETF (BHDG) -Crypto Income ETF (BLOX) https://t.co/IoacQcr0Mk via @CryptoPrimePod https://t.co/dYmPUzzTVj

V‑Bottom Returns: Stocks Surge While Quality Lags
V-Bottom Strikes Again: Stocks Soar as Quality Lags As the S&P 500 hits a record, I assess how far we've come... and where equities may be headed @stockcharts https://t.co/4cER6C7dmo https://t.co/oo4msWOBBK

RSI Jumps 30‑70 in 15 Days—Rare Historic Signal
RSI has gone from under 30 to over 70 in 15 days just two prior times since 1980: Nov. '16 & Aug. '82. It's not quite there yet but it's very close. $SPX $SPY https://t.co/qhQVEqh9QX

Higher Timeframes Reveal Stretch
If you think many daily charts are stretched check out the H1's/65's Has me sitting but still looking for future opportunity. Stops inched up on all holdings.

Elon’s Hardware 5 Tape‑Out Fuels Tesla’s Biggest Rally
$TSLA up 7.4% today, marking its best daily performance in 9 months. I attribute 20% of today’s move to the market (Nasdaq up 1.4%), along with a UBS upgrade earlier today. I believe 80% of the move is related to Elon’s nocturnal...
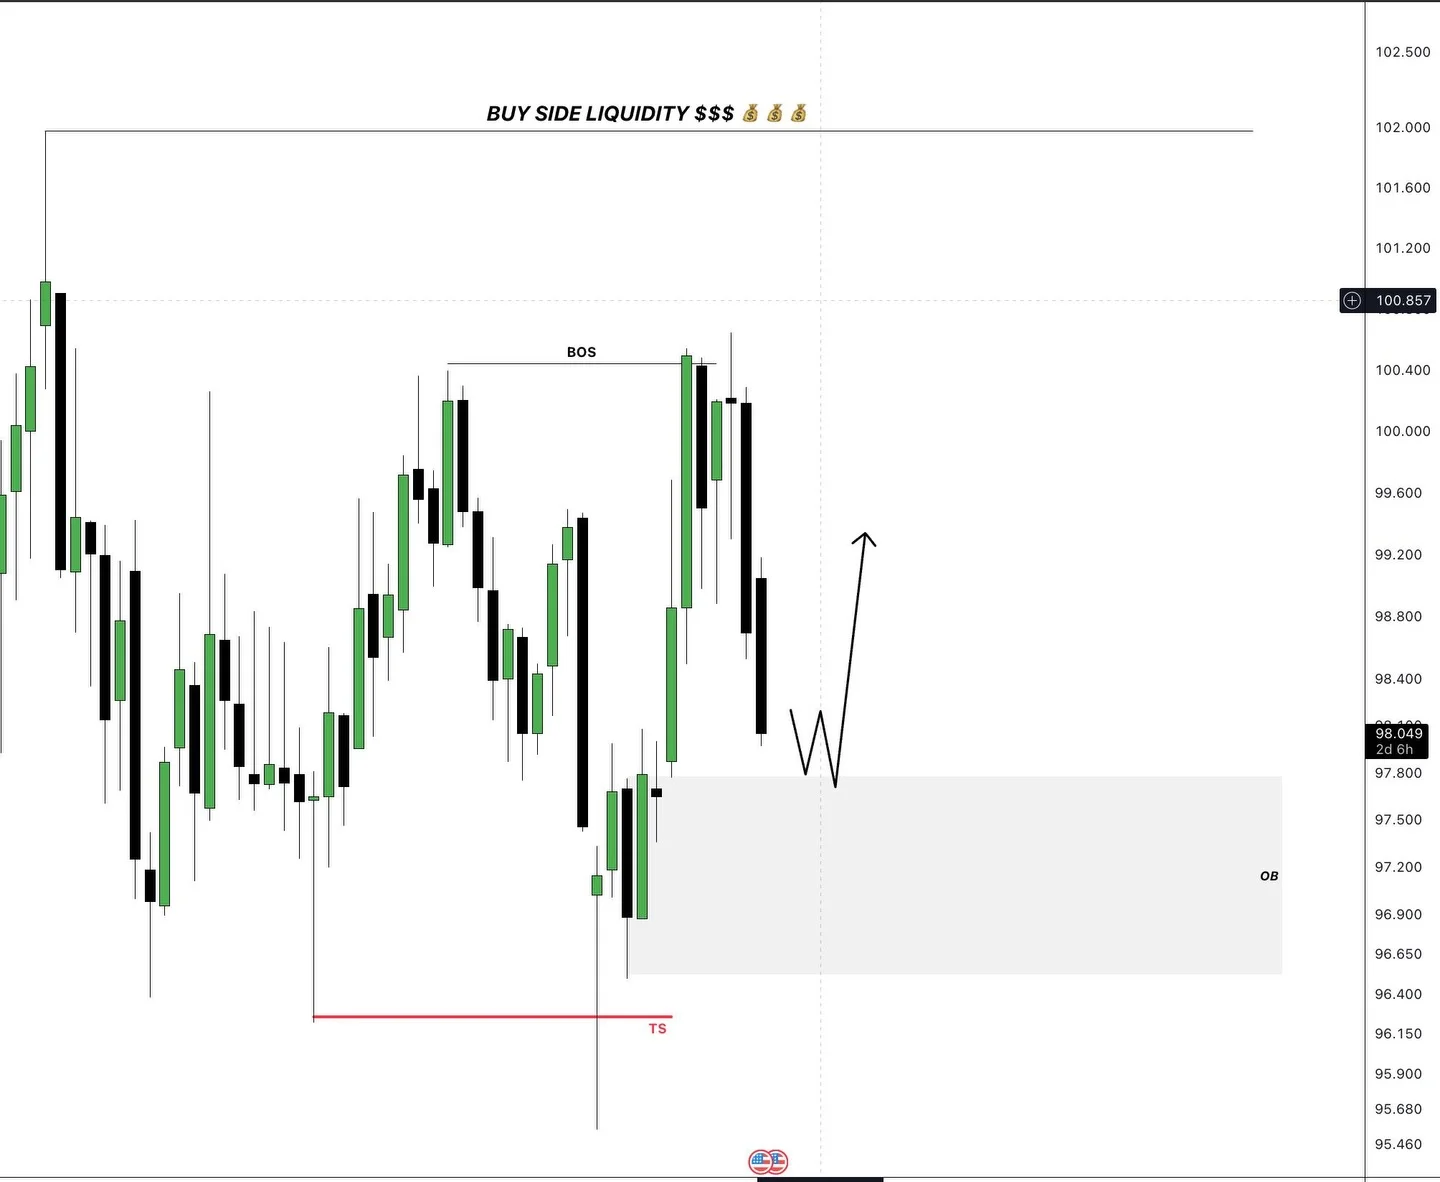
DXY Weekly Order Block Sets Market Direction Cue
📊 Market Plan – Dollar Index Focus 🔎 We are currently waiting for the Dollar Index (DXY) to reach a key Weekly Order Block (OB) 📈 🎯 Plan: • Let the market retest the Weekly OB • Then wait for H4 confirmation (structure shift)...

All‑time High Proves War‑era Bear Trap Persists
Turned out to be indeed a bear trap. It didn't just get higher than before the war started, but it's on all time high.
NDX's 11-Day Rally Falls Short of 1979 Record
The NDX is up 11 days in a row. Not the record. The NDX was up 19 days in a row in August 1979.

SPY Reaches 52‑Week High, EMA Bullish Cross
$SPY hits the highs and in 52 week high list. Weekly chart 8/21ema bull cross
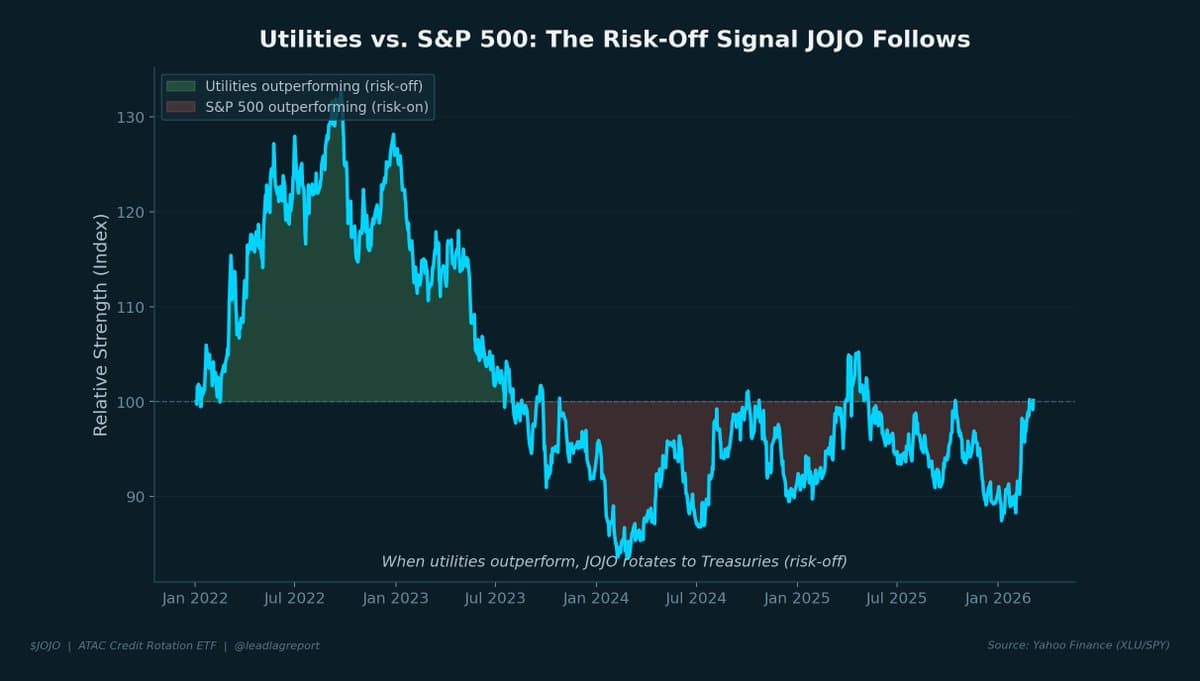
Rising Volatility Signals Risk-Off; Utilities Lead
Volatility is rising. Equities are correcting. Utilities are outperforming. These are textbook risk-off signals. $JOJO was built to read them. https://t.co/7bh6y3XuhR

Tesla Nears $398 Resistance, Stalled Below 50‑Day SMA
Test coming on $TSLA from here to 398 resistance as it stalls on underside of 50sma. https://t.co/G6G1I5h7q6

S&P 500 Hits Record with Just 11 Stocks Topping Year‑highs
I can’t recall a day when the $SPX made a new all-time high with only 11 of its components making new 52-week highs.

NVDA Trade #2 Targets $196 Support Level
trade #2 on the day is here with $NVDA and the support at $196 #trading #stocks @traderTVLIVE @ttvresearch https://t.co/UT8dUFPZ4q https://t.co/XKdPNGtfCi
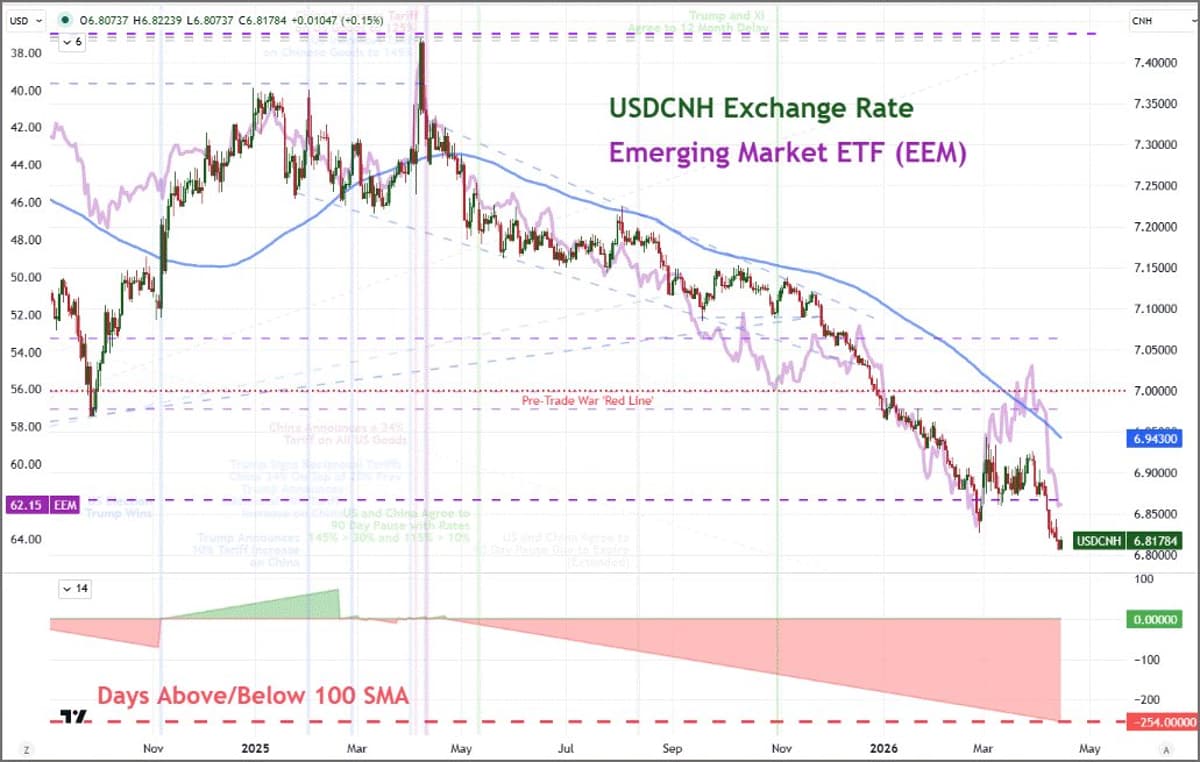
Emerging Markets Surge as Yuan Hits 3‑Year High
While risk appetite has recovered sharply amid the Strait shutdown, emerging markets doing particularly well. While the EEM ETF has climbed (inverted below), the Chinese Yuan has climbed to a 3-yr high vs the Dollar - 254 days USDCNH below...

QQQ Hits Upper Bollinger Band for Two Consecutive Days
Day 6 sweet spot (note two days over standard deviation 2 upper BB) $QQQ https://t.co/AV6sVcMumf

CRWV Nears Gap, Riding Strong Uptrend
$CRWV daily almost making it to a former gap today. Many up days in a row. The chart will need basing soon to unwind. Buying has been big see volume bars. I have just about all...
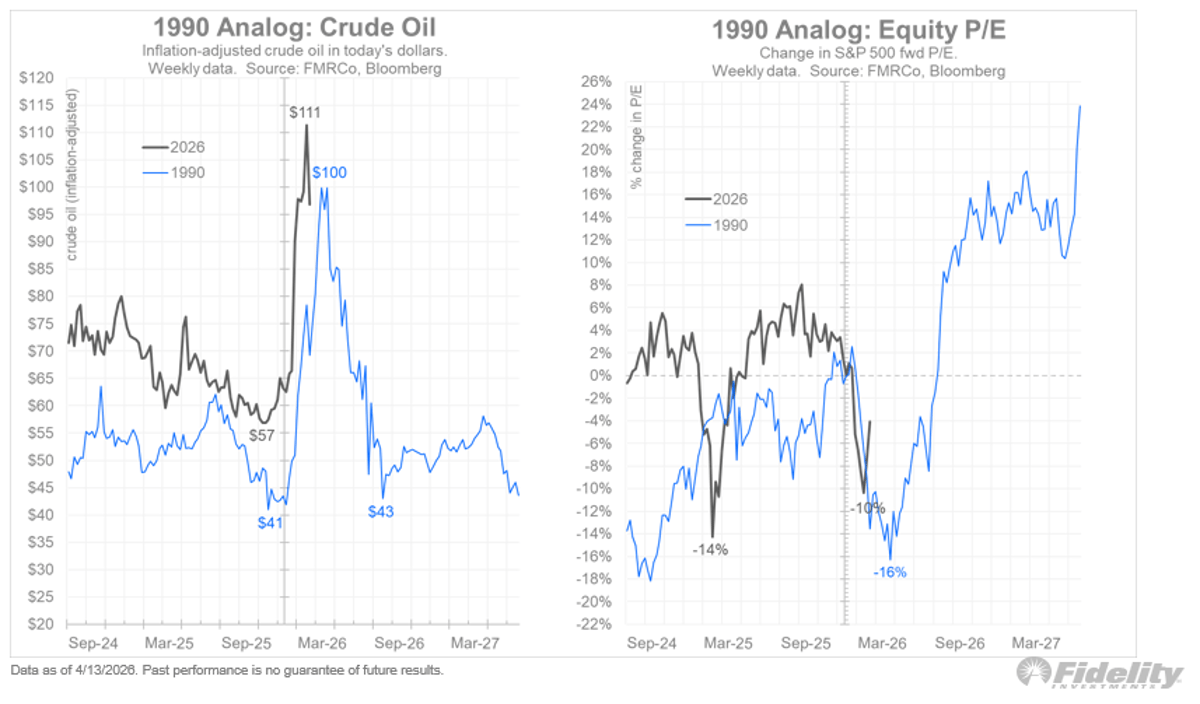
Oil Spikes Trigger Swift P/E Collapses, History Repeats
The markets have been pricing for a quick end, much like what happened during the 1990 Gulf War. The analog below shows that the surge in oil prices to $100 (in today’s terms) was quickly reversed, and with it so...

Liquidity Surge Signals Tech and Crypto Rally Ahead
The Everything Code suggests that over time the NDX has a 97% correlation with GMI Total Global Liquidity. Total Liquidity is at all time highs. NDX is following. We have been long tech stocks in GMI (and RV Pro) since Dec 2022...
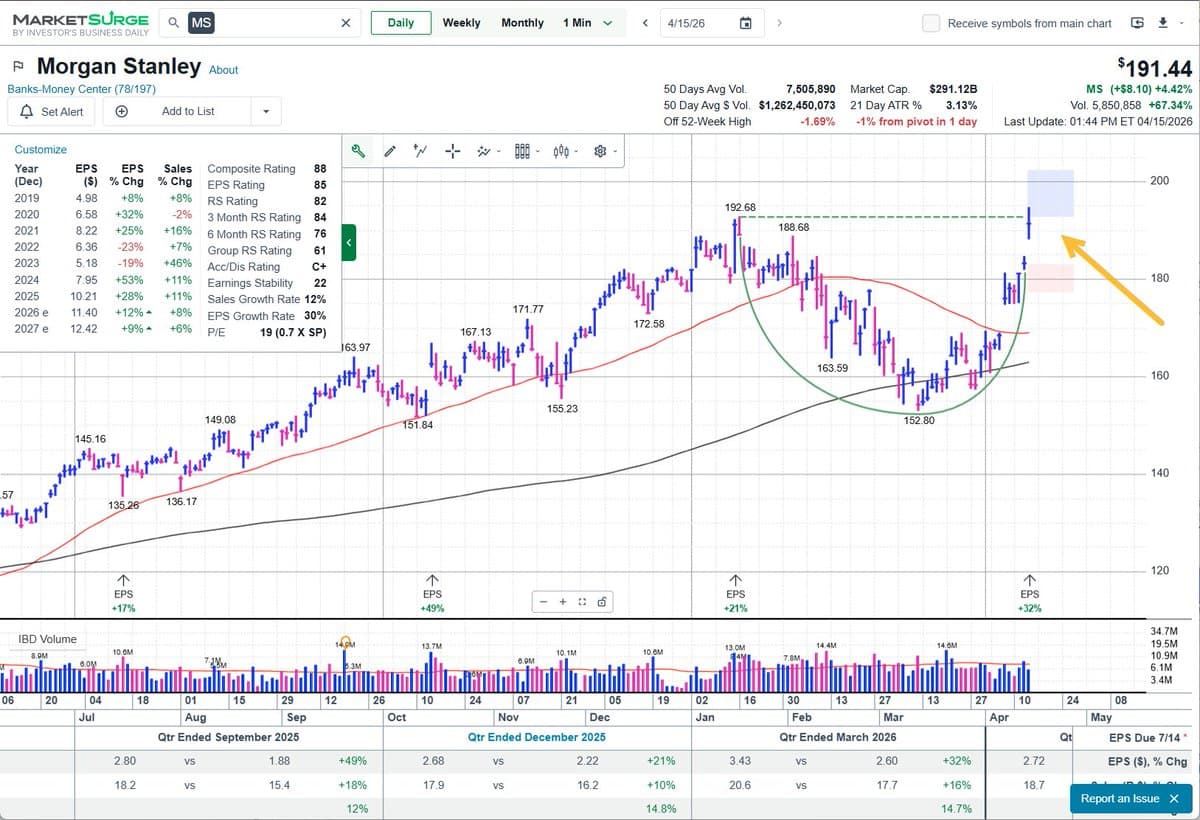
Morgan Stanley Leads XLF, Returns to All‑Time High
Morgan Stanley is a top 5 financial by size in the $XLF ETF and notably the only one back at all-time highs today following Q1 earnings. Chart here from @IBDinvestors MarketSurge $MS #IBDPartner https://t.co/zqLF3gTpro
Let Price Find Levels, Prioritize Stops over Predictions
Stops are most important to me. I let price seek its own level and show me where it wants to go not me tell it.

Scale Out Gradually, Adjust Stops, Preserve Position
Selling does not have to be all at once, consider selling partials into strength and move up stops. Keep some working as price moves in your favor and sell a little to calm the appetite.

IGV Breaks Above 10/21/50 MAs, Watch Stops
$IGV updated Price is back over 10/21/50ma's daily. A hold over 50ma will have me move my stops. Note volume bars. Indicators ready if price wants more. https://t.co/CVoBCIAUqU
Chasing Under‑Owned Growth Stocks Amid Semi Profit‑Takes
I did say the chase for “under-owned” stocks would continue in the growth roation: $IGV names gallore plus profit taking in semi (Software > Hardware) 😉 Plus MAG7 laggards $TSLA $MSFT $ORCL 🚀🚀 #LiveTradingRoom

All My MSFT Swing Shares Now Let‑It‑Ride
$MSFT updated chart. I am putting all of the swing shares into let it ride. I have a variety of stops some wide, some not so much. Love when a name reaches the goal of let it ride....
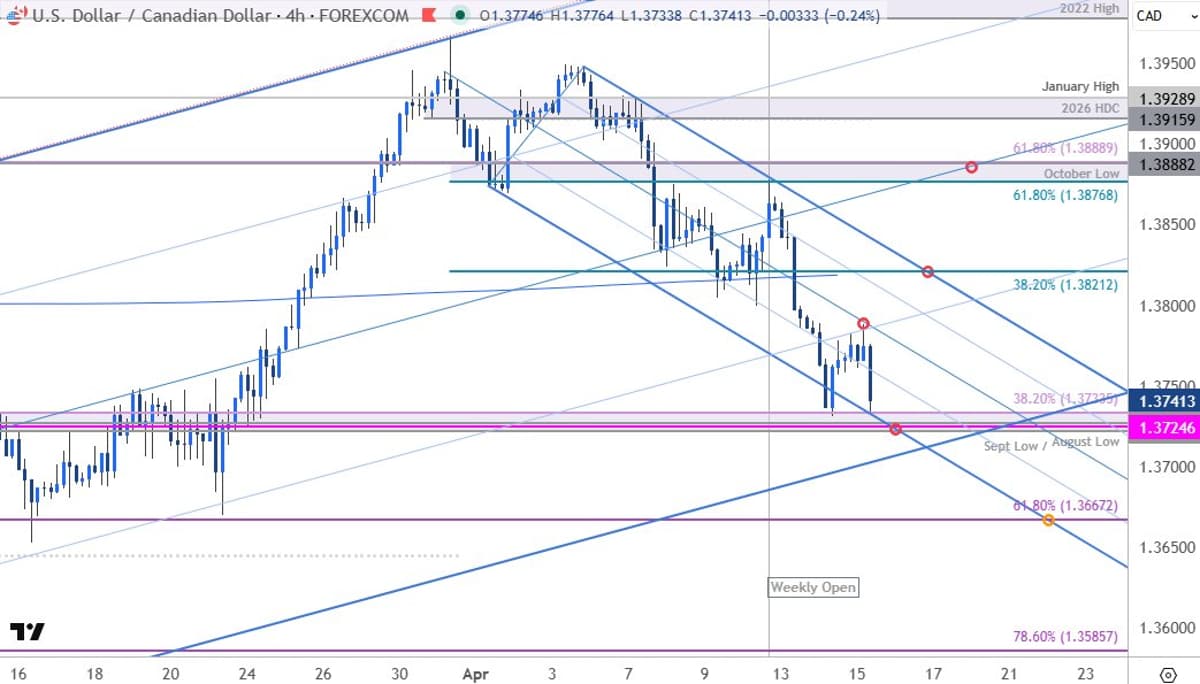
USD/CAD Slides to Critical Support, Breakdown Looms
Canadian Dollar Short-term Outlook: USD/CAD Plunges to Key Support– Breakdown Risk Builds https://t.co/YpAbMCCFBj $USDCAD Daily & 240min Charts https://t.co/gLC6rvxsBF
Patience and Focus Unlock Smart‑money Trading Success
FOCUS LOST = SETUP LOST. This is a perfect example of how smart money operates. Liquidity gets taken, price moves into premium, and then the real move begins. Most traders miss it — not because they don’t know… But because they don’t wait. If you...

Tesla Trade Nears 5% Mark, Target 385.99
👀👀 last 5% of this $TSLA trade, target out 385.99 break down. #trading #stocks #stickynote https://t.co/H7p5v936cp
AMD Eyes Base Zone at $236‑$257 After 10 Up
$AMD daily with 10 up days finally starting to base. Daily indicators elevated a move back to the 10ema and gap for basing levels would not be disaster. 236-257 area for basing
Cover Part, Learn Rebound, Then Plan Phase Two
You're welcome - I risked down into the flush just to be safe. As I wrote in post may just be a gut check may vs. mega fade, but I have no problem re sizing back in however the last...
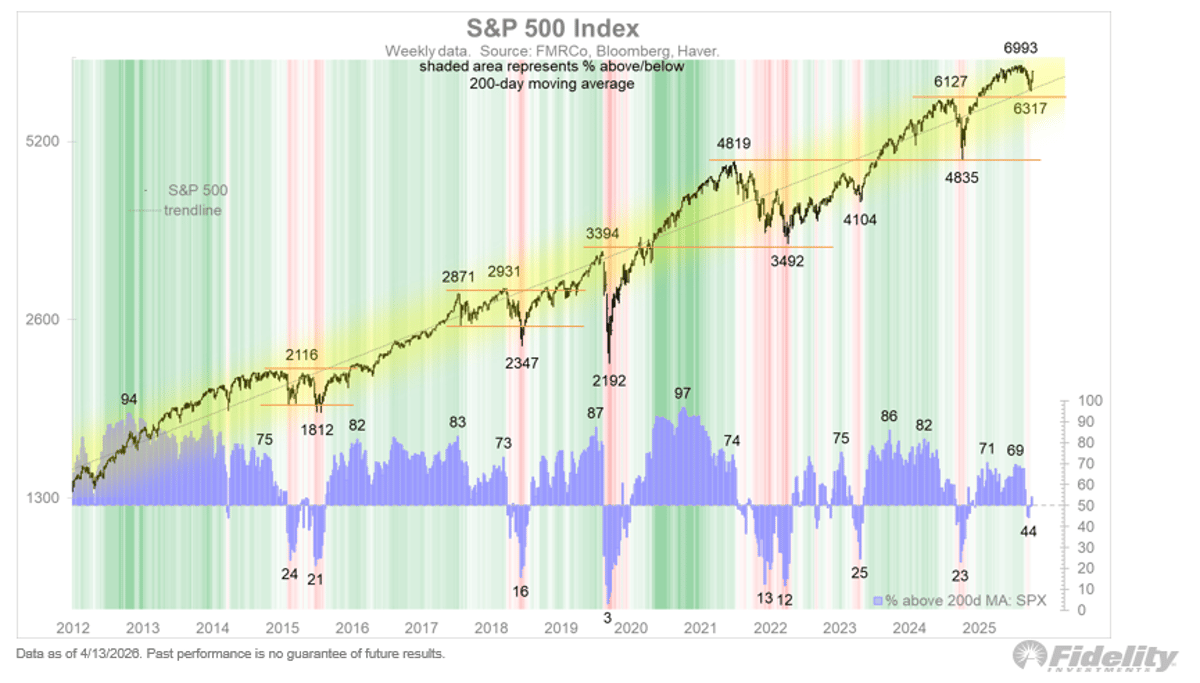
S&P 500 Missed Oversold Low; Further Dip Needed
The weekly chart below shows that the S&P 500 index stopped short of an oversold extreme at its March 30 low of 6317. We never got that juicy entry point. We’ll see how the market reacts as the headlines continue...

Focus on Bounce Timing, Not Extreme Bearishness
And again, I think you learn the most on how things bounce -- never good to be crazy bearish but it's all about how/when things bounce - thin swipes back up? or rebound stays heavy. That's the only thing that...
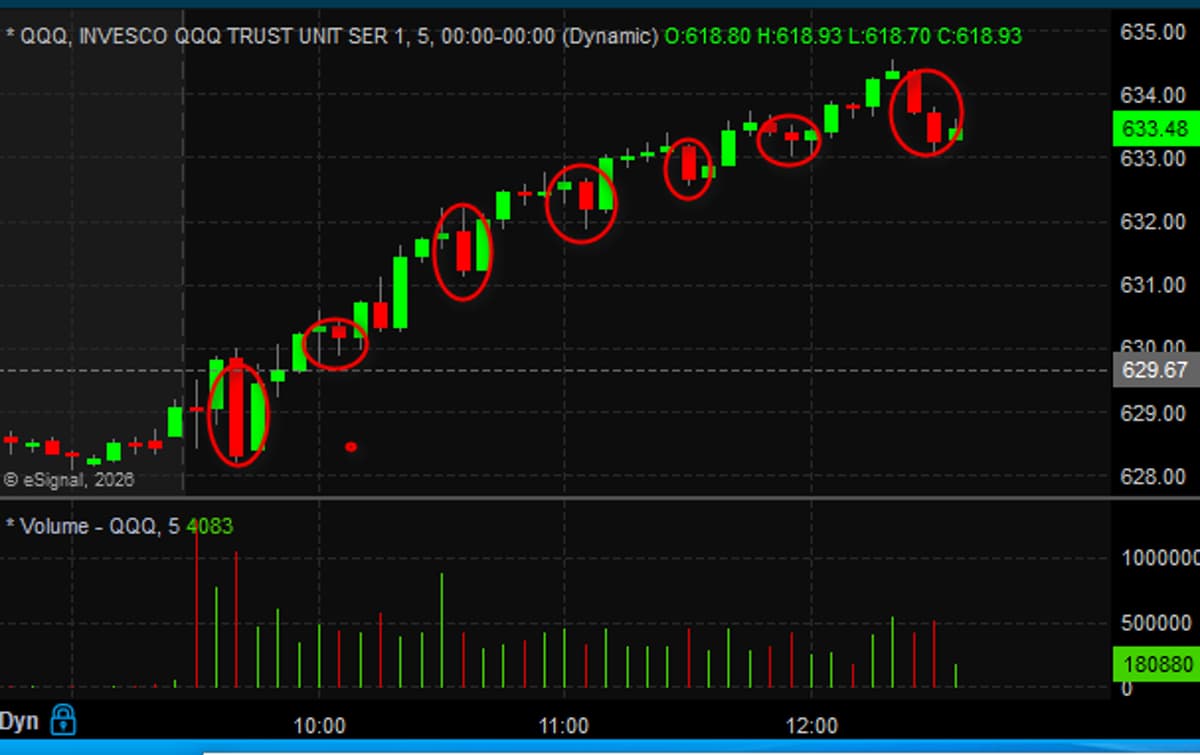
Selling Pressure Sparks Fresh Intraday QQQ Highs
every instance of selling pressure today has been followed by a new intraday high. 🤔$QQQ https://t.co/nJ8Ad7tkNo
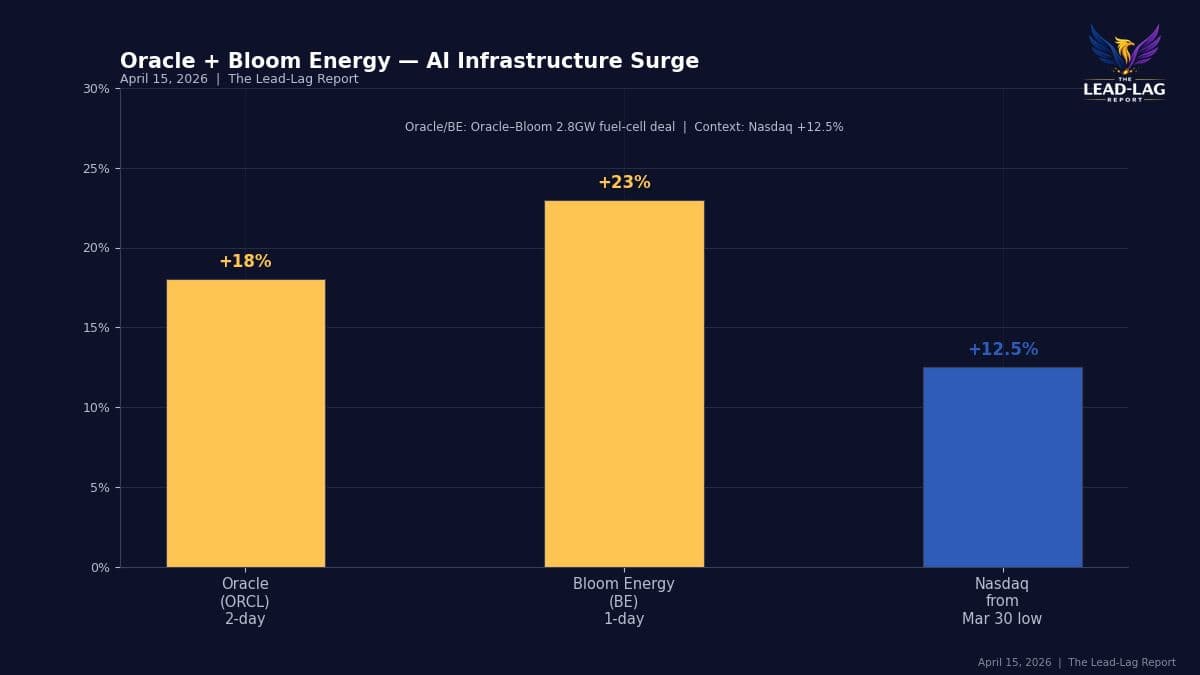
AI Infrastructure Drives Energy Demand, Sparking New Investment Theme
$ORCL up ~18% in two days. $BE surged 23% on a 2.8GW fuel cell deal with Oracle. AI infrastructure is the new arms race — and the energy required to run it is creating a second-order investment theme that most...