
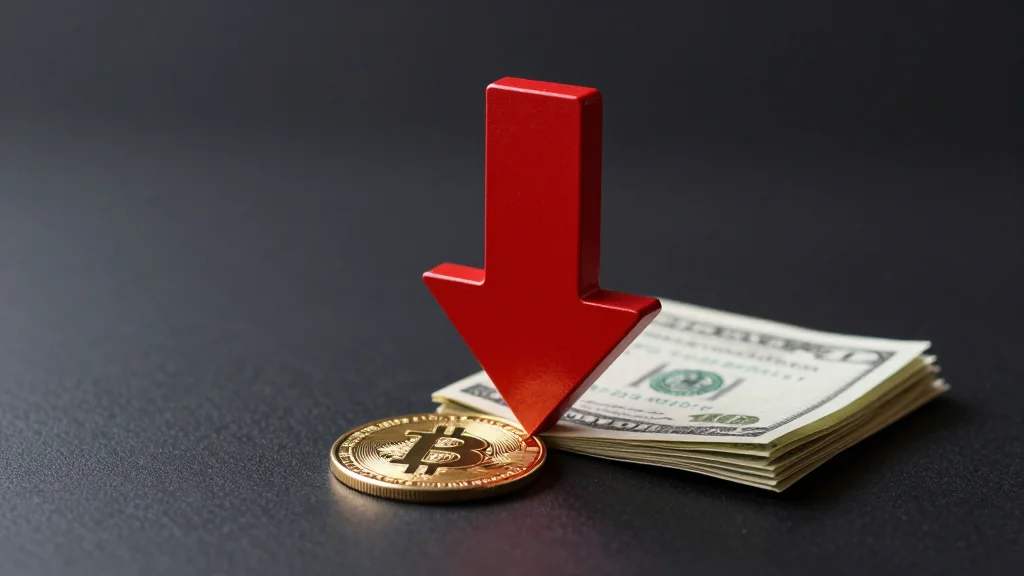
40‑Day, 5% Pullback Guarantees No Bear Market
Very interesting stat from @StovallCFRA on @CNBCTheExchange with @LesliePicker today. When it takes >40 days for the S&P 500 to have a mild 5% pullback, it has never moved into a bear market. https://t.co/9Yjk8jEYOD

Big Tech Endures Historic Three-Day Intraday Decline
Big tech suffered at least a 1% intraday loss for 3 days in a row. That's the fourth such streak in a month. This is tied for the most ever and hasn't happened since the GFC. It's been either really, really good...
S&P Could Drop $6,000 to Liberation Day Lows
"The downside can be around $6,000 in the S&P. That would take you to 'Liberation Day' lows." @ramahluwalia https://t.co/6eQLOwwmn9
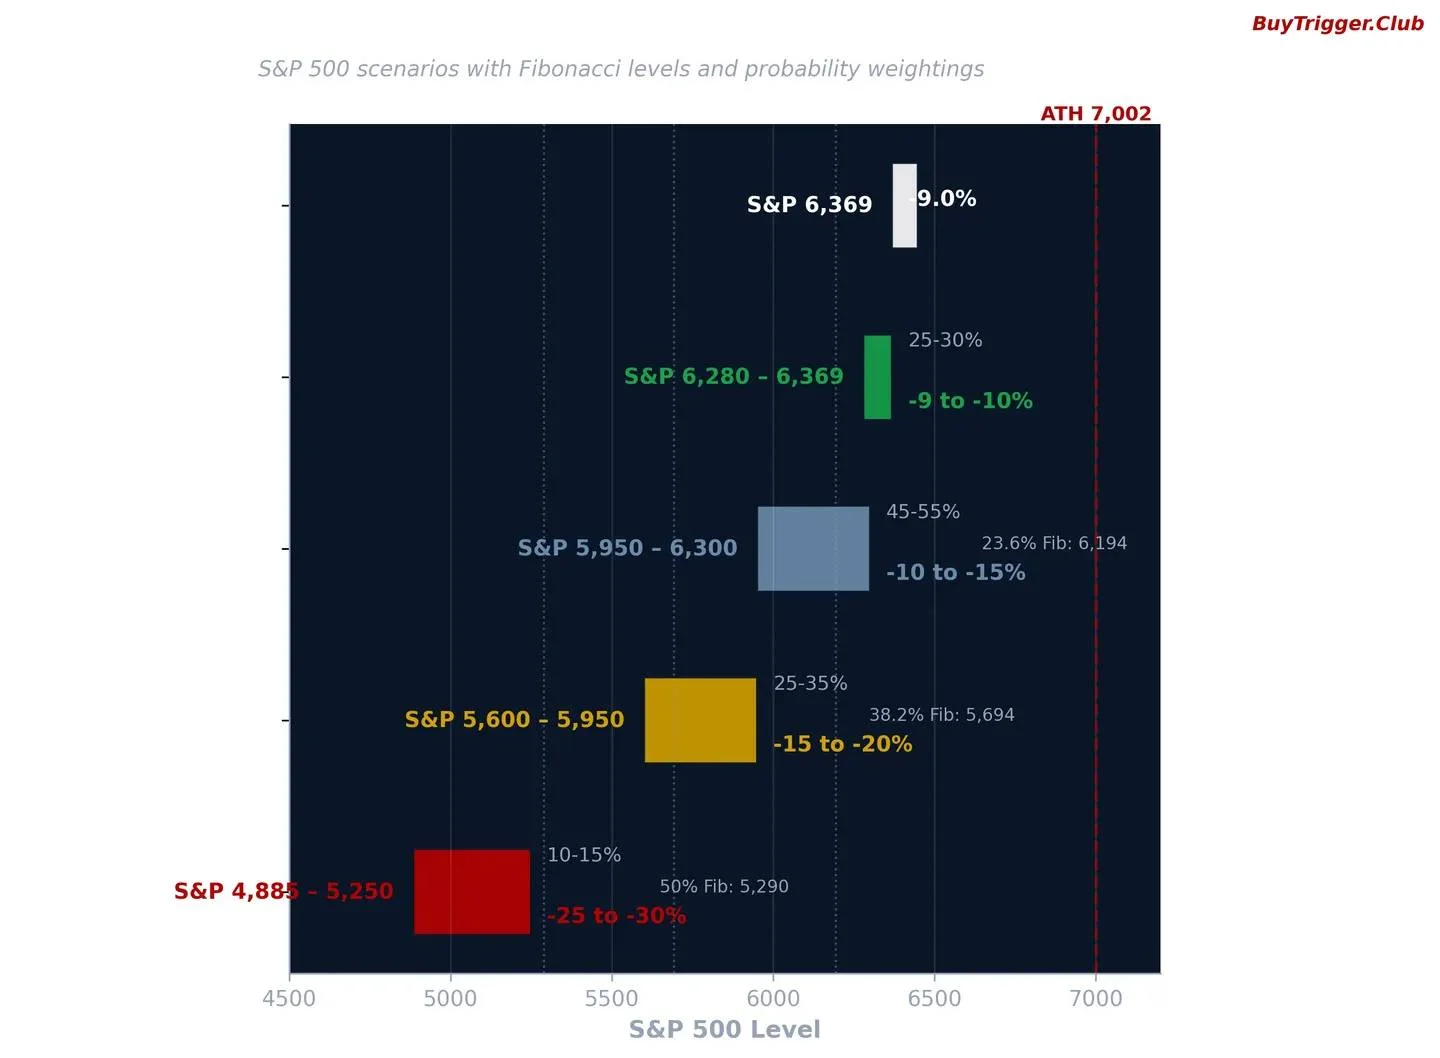
Extended Scenario Shows Most Likely S&P Low
How low can we go? I built three scenarios. Bull: S&P 6,300+ (25-30%) Base: S&P 5,950-6,300 (45-55%) Extended: S&P 5,600-5,950 (25-35%) Bear: S&P 4,885-5,250 (10-15%) Fibonacci levels. Probability weightings. Historical parallels. The extended case is where I'm spending the most time. https://open.substack.com/pub/dralexkoh/p/how-low-can-we-go

SPY Closes After Morning Strength Sale, New Reference Point Set
$spy post close as the morning strength was sold. We did get a new point of reference https://t.co/1rDzWM0HtZ
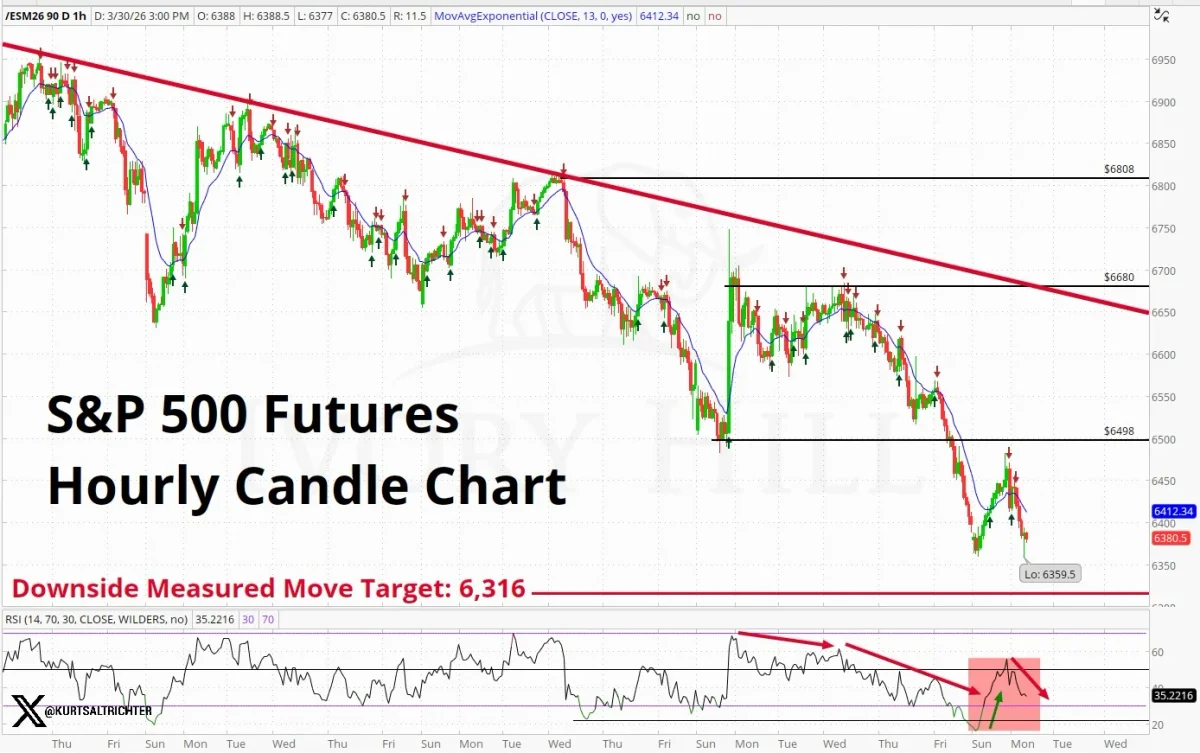
S&P Futures Stuck Below Downtrend, Target 6,316
S&P 500 futures can't get out from under the downtrend line. Every bounce gets sold. Measured move target: 6,316. Next stop lower until something changes structurally.

Gold Outperforms, Silver Spikes; Distinct Regimes Emerging
I'd say this is worth revisiting, not bc macro is end all but can't deny gold outperf for year +, then silver spike. Obv tail end was robinhood type but the ROC would have still triggered. Low N but uniquely...

Data Shows Downside Risk Despite Bottom‑Seeking Optimism
$SPY - With data - you find what you look for...many are looking for "the bottom is close" and "this is capitulation" so they are finding it (SHOCKING). But PLENTY of data is saying we have plenty of room to...

Not Every Bottom Fits the Trendy V Shape
I’m old enough to remember not every bottom being a “V” bottom. This just doesn’t smell like a “tweet and rip” bottom. *would love to be wrong*

Big Tech Slide Drags S&P 500 Down 16% YTD
Mag 7 Malaise: What Big Tech’s Slide Means for the S&P 500 $SPY My Monday $MAGS musings on @stockcharts ... which is now -16.4% YTD https://t.co/hrMFx68w4r https://t.co/5qnmDHeO0y

QQQ Trends Follow 21‑EMA Direction
Downtrends occur when the $QQQ is below the @mwebster1971 21ema Uptrends occur when we sustain above the 21 https://t.co/cqNcFqfp8R

Goldman Sachs Momentum Basket Slides over 7%, Near Yearly Low
MORE LIKE NOMENTUM Goldman Sachs’ high beta momentum long basket down >7% today, poised for its 4th worst session in the past year https://t.co/s1Xac2PsMI

Only Top Short Sellers Embrace Gap‑up in Oversold Tape
Unless ur a fantastic short. This is why most traders don’t like a gap up in an oversold broken tape.

Chart Looks Grim; Sub‑$100 Possible Despite $154 Rebound
$PLTR This chart looks awful and potentially headed back sub $100 Reclaim $154 and bearish bias invalidated https://t.co/Z4m4iiIbox

Palantir's Price Surge Proves It's a False Breakout
$PLTR is a picture perfect example of a fake breakout. See quoted tweet for full explanation. https://t.co/7qrxDK9Uao

Failure of MU May Turn Level Into Resistance
If $MU does not hold here then likely will overshoot and this level will become resistance. Big level here for bull/bear. https://t.co/LfA8JF7wLu

Bull Markets Sabotage Breakdowns, Bears Sabotage Breakouts
During healthy bull markets you see breakdowns failing all the time. During the bear markets it's the breakouts that fail quite often.

Q1 Pump‑Then‑Dump Sets Potential Peaks for Metals
Gold, Silver, Copper 1Q Pump-Then-Dump Pattern Might Define 2026 - Signs of high-price cures, common in more elastic commodities, emerged in the metals sector in 1Q. My analysis suggests pump-then-dump patterns to record highs in gold, silver and copper could...
High‑Upside Short‑Term Picks Ready for Fast Momentum
Next week’s short-term watchlist: • $MSFT — expected upside: 63% • $PANW — expected upside: 33% • $CRWD — expected upside: 30% • $HOOD — expected upside: 79% • $META — expected upside: 57% I’m not looking for random hype. I’m looking for liquidity, strong themes, and...

Small‑cap Rally Ends with Sharp IWM Bearish Reversal
$IWM Quarterly. Another quarterly candle of note (completed tomorrow at the bell). Small caps were THE rotation pick for many into this year. Massive bearish reversal here after holding up for a while https://t.co/P2FBiYFT0c

SMH Downside Targets Using Measured Moves, Not Fib
This is $SMH showing two downside targets I do NOT use Fib and never have I am a Edwards and Magee/Schabacker measured moves guy https://t.co/6LWeuk1wnA
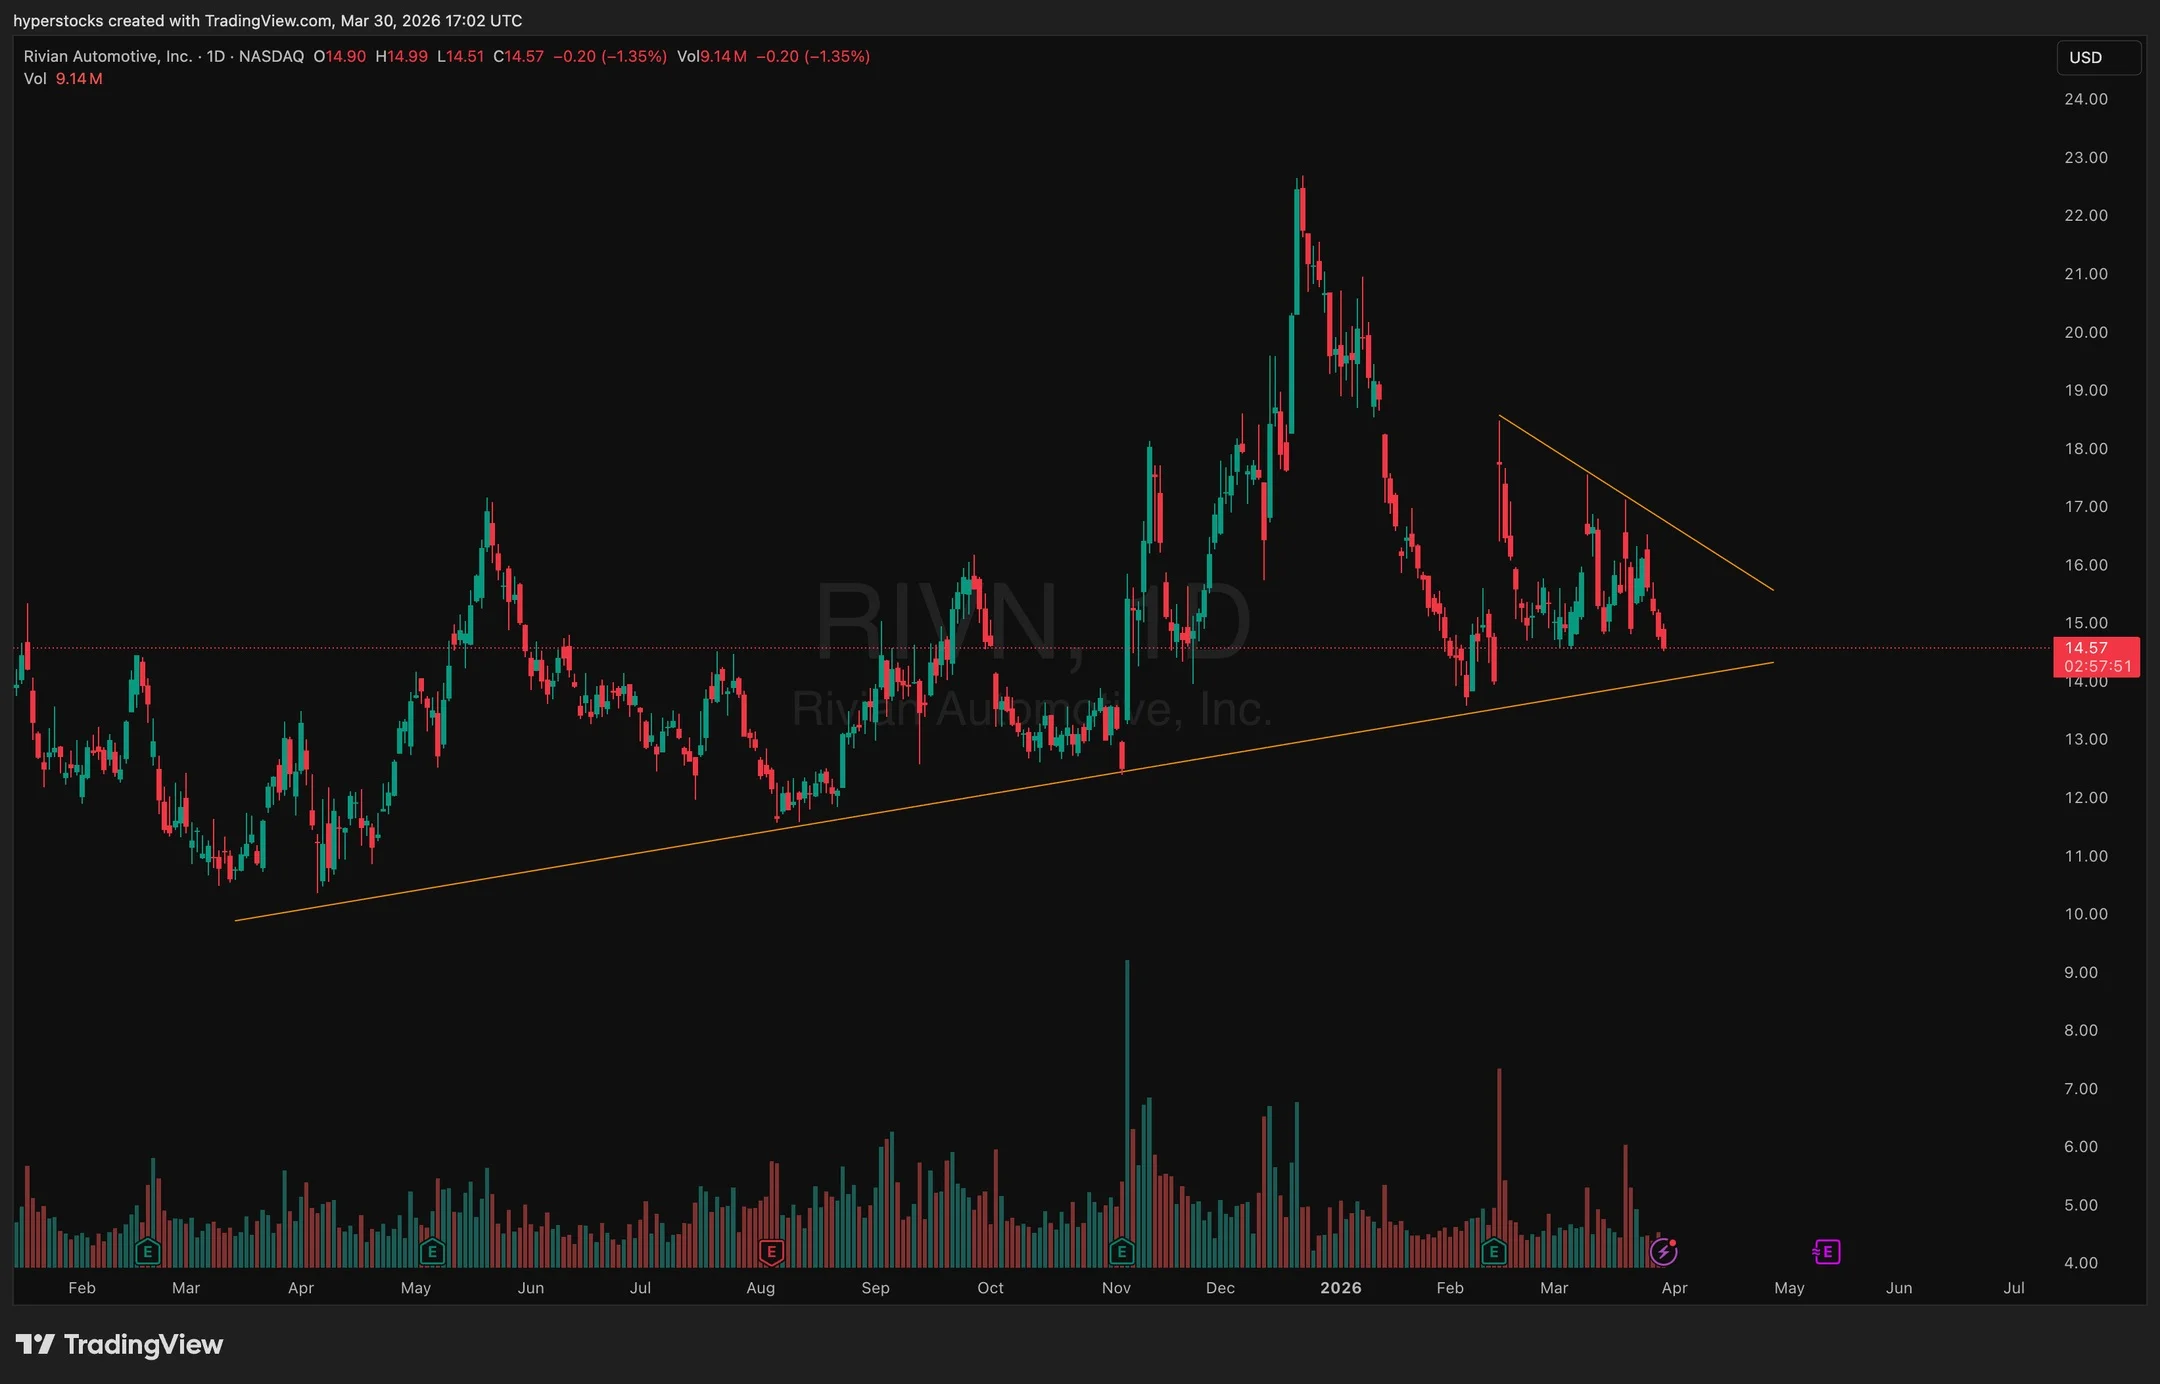
RIVN Nears 12‑Month Trendline, Bounce Back Possible
$RIVN getting close to retesting a 12 month trendline. Looks like a deal with Uber wasn't enough to sustain buyers, but worth watching for a bounce back when market confidence returns.

Historical VIX Crash Signals Calm Markets Ahead
The VIX Crash Signal: What History Tells Us About The Next Three Months | Trading Zone Ep. 97 https://t.co/70bw4fddbk
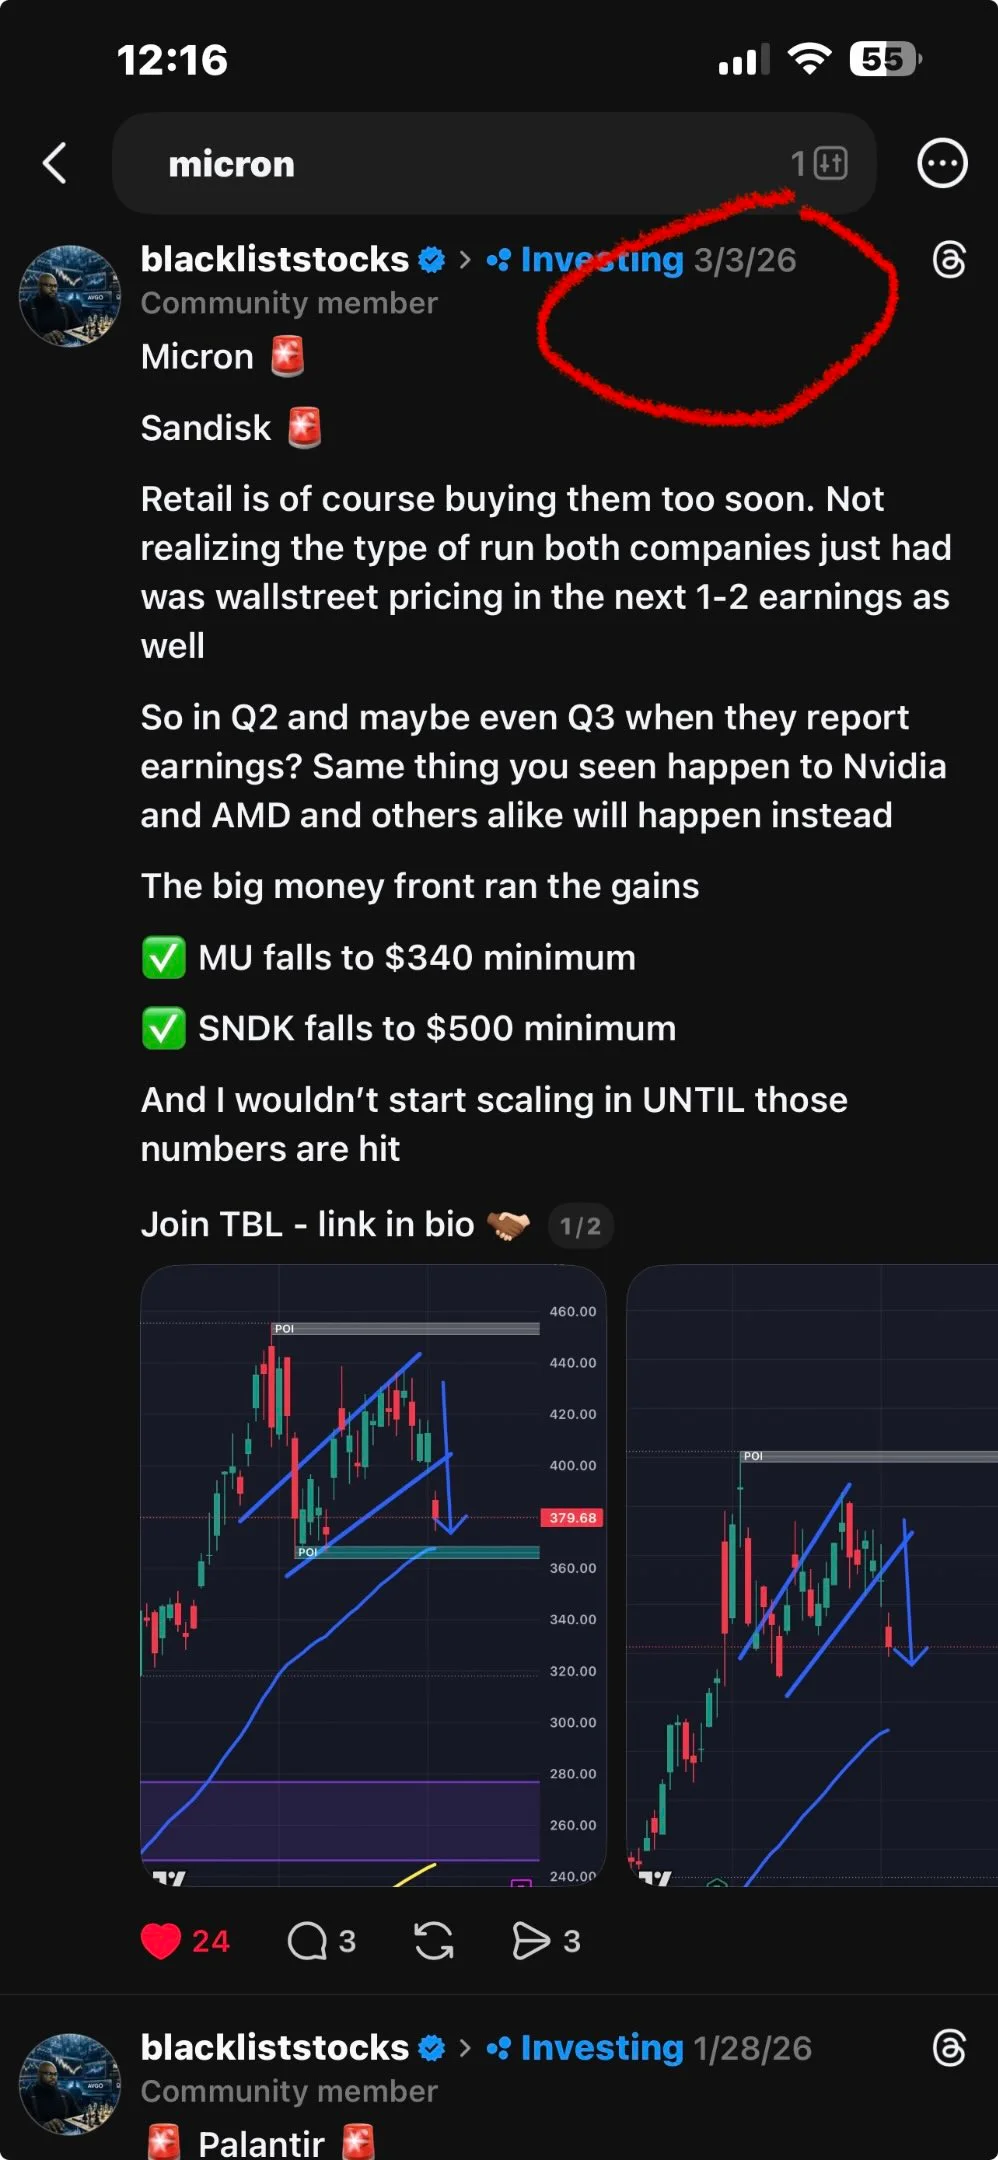
Micron and Sandisk Set for Sharp Price Decline
Very few are calling plays as specific as I am as of recent I told yall at the start of this month micron falls to $340 minimum The amount of people who called me “crazy” The amount of people who...

Murphy USA Leads Consumer Discretionary Gains in March
#gasprices Murphy USA is the best performing consumer discretionary stock in March $MUSA @seekingalpha https://t.co/mTVwrMbUa0

Dollar Poised to Surge Toward 105.50 Target
Dollar seems like it wants to rip... 105.50 target if so $USD $UUP $DXY @stockcharts https://t.co/UiwZRpV53z

Tier‑1 BOS Account Delivers Reliable $SPY Weekly Levels
Some asked for the $spy weekly glance with some levels to write down in the weeks and months ahead potentially BOS account is only Tier#1 and I have a system that works https://t.co/zRTYQKtRMF
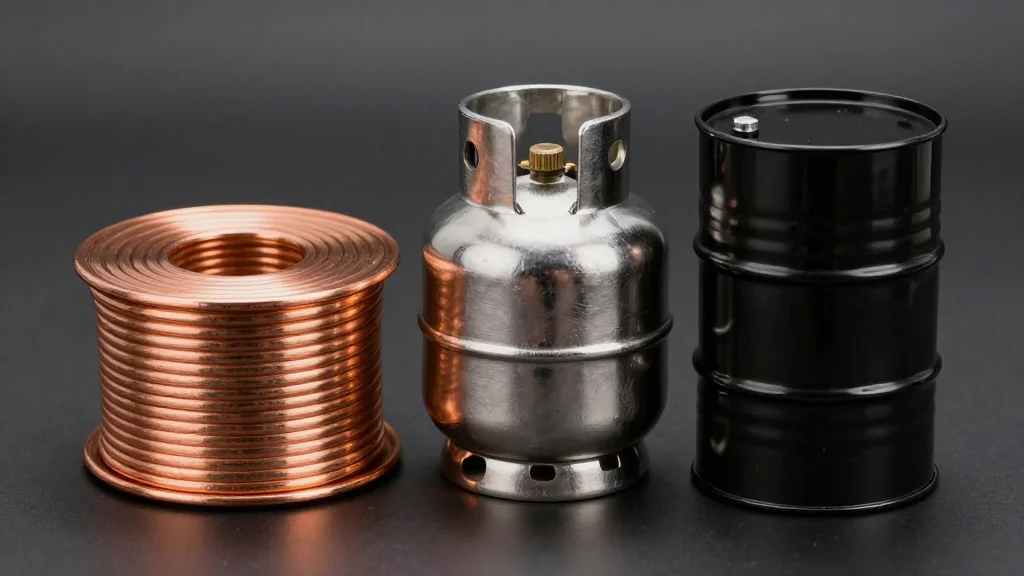
Commodities Now Trading Across Daily, Weekly, Monthly Timeframes
Pick your timeframe Copper, natural gas, and oil (Brent / WTI) markets are now trading across daily, weekly, and monthly Commodities have entered the chat ↓ https://t.co/dxPGVrURQL

NYA Bull Trend Holds, Testing Rising Channel Top
Bull trend remains in play for the $NYA index Testing the top of its rising channel with RSI a little lofty. $SPY $QQQ $TLT https://t.co/toEmLdxINB

Opening SPY Strength Sold Off; Mixed, Unconvincing Market
$spy morning glance as opening strength was sold in first 30 minutes. Very mixed stock action. Not very compelling https://t.co/YdmQWdWFF2

Calling for Short Trade Amid Rally,
Need this guy to go short today for a rally Aka the new Cramer https://t.co/zf7l5xKmaB

Liquidity, Not Valuation, Drives SPY's Downward Moves
$SPY can be ‘cheap’ and still go lower. Valuation isn’t a catalyst. Liquidity is. And liquidity doesn’t care about your spreadsheet. https://t.co/pbRg1YLM5V

Semis Dragging Down, Targeting Low‑Mid 300s
Semiconductors are leading the downside to kick off the week. Wouldn't hate seeing low-to-mid 300s for some longer-term adds. $SMH https://t.co/Ucxvgogf5w

AVGO Holds Above 299 Pivot; Below Triggers 245 Target
$AVGO - So far in this downtrend it has held above the support of the yearly pivot at 299.60. If it closes the week below 299 the next downside target would be the 100 week MA that is currently at...

Mid‑Cap Shooting Star Signals Buyer Exhaustion, Potential Pullback
$MDY Quarterly. Pending tomorrow's close, the overlooked mid-caps on track for doozy of a shooting star reversal quarterly candlestick, indicative of buyer exhaustion. Late-2024 saw similar before correction https://t.co/TkUDiNdcYh

London Sets Direction, NY Session to Confirm Moves
This is the part in the game where you identify the correct move London showed us a direction With little to no pullbacks and or retest at all Now we’ve got to watch NY session for continuation It just gave us...

S&P 500 Bullish Streak Ends After 43 Weeks
it's been 43-weeks since the S&P 500 $SPX turned 13/34-week bullish on the weekly chart... https://t.co/tzY8LM46AG

9-Year Strategy Captures Reversals Better Than Anything
I've traded for 9 years and this strategy has caught me more reversals anything else ↓ https://t.co/IGs5LpCXmH
Nvidia Fails to Hit $170, Price Drops; More Puts Sold
Nvda didn’t even test $170 and is red now. Sold a few more puts from last week
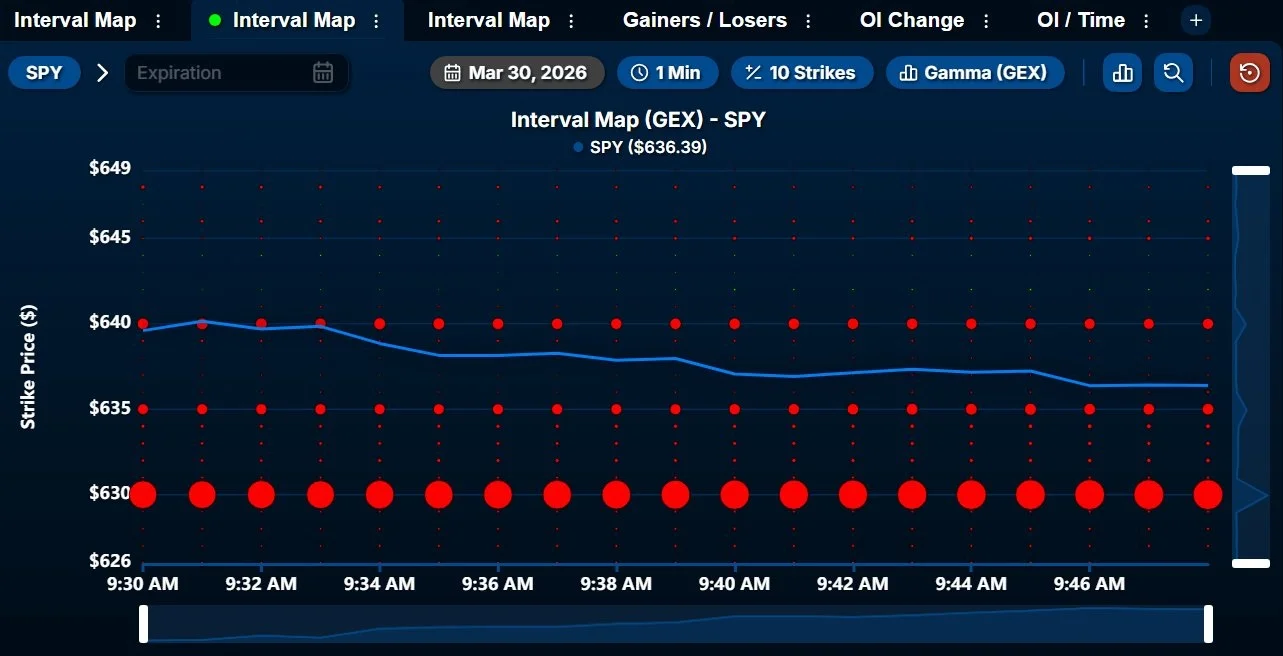
SPY Faces Negative Gamma Near 635, Watch 640 Resistance
Net Gamma Exposure for $SPY shows elevated negative exposure at $634-$635. I have resistance currently at $640, where positive exposure is slightly building. Be cautious of catalysts, Trump claims to be "close" to a deal.

Rio Silver Jumps
Rio Silver $RYO.V $RYOOF. +9.88% Bolting higher at the open and still not far from where Eric Sprott bought in! https://t.co/iJWIPdLj2q

S&P 500’s War‑Era Sell‑Off Remains Surprisingly Orderly
This feels like the most orderly sell-off of all time These are the daily moves in the S&P 500 since the start of the war No big down days yet at all https://t.co/atbg2iids3

Investors Favor Nuclear Miners, Shun Capital‑Heavy Space Tech
ListingTrack Weekly Theme Recap (Week Ending 03/27/26) This week, Nuclear strength concentrated in uranium miners and integrated nuclear utilities, while SMR developers and safety/fuel‑tech names faced renewed selling. New Space, by contrast, traded lower overall: Satellogic delivered a standout move on...

ATR Model Flags First Bearish S&P Signal Since 2025
my S&P 500 $SPX ATR model turned upwards last week, creating the first bearish equity signal since early 2025... #DCATR https://t.co/d12cVeyvwP

Expect SPY to Rebound From $633 to $650
The last oversold $spy bounce went from $647 to $661ish If this does the same. It can go from $633 to $650ish. We will go day by day. Map out levels. And we’ll see how certain stocks and groups...
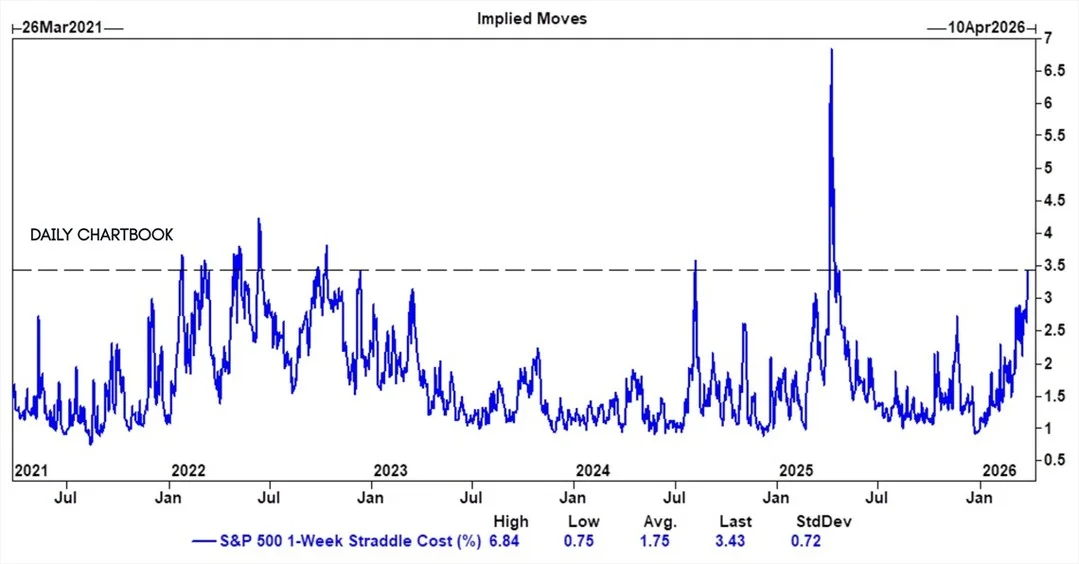
Options Signal Over 3.4% One‑Week SPX Move
"Despite the shortened week, the options market is implying over a 3.4% move for SPX. Not quite as extreme as we saw last year, but still one of the largest 1-week implied moves we have had over the last five...

New Signals Boost Momentum & Mean-Reversion Strategy
Bonus momentum and mean-reversion switching strategy update with new signals. $TLT $GLD $TLT Link in reply below. 👇 https://t.co/f6qo530Cv7

CTAs Near Max Short, Set to Become Buyers
CTAs Near Max Short From GS via BBG: - CTA sold $190B this month and are now short $50B of global equities - Cullen Morgan: “The systematic community is running out of steam” “Asymmetry lives to the upside — over the next month,...

Weekly Safety Checklist Review for New Buyers
a weekly glance at our "Is It Safe for New Buying?" checklist... $TSX $QQQ $SPX $IWM https://t.co/DvO5LGSfDQ

When BTFD Flips to STFR, Gamblers Stay Indifferent
Which begs the question, what happens when BTFD becomes STFR - "Sell The F'ing Rip?" Before you say, "They'd never," remember that the nihilist gambler plays to win. He's agnostic to market direction.