Protection Costs Surge Despite Modest S&P Gains
Wow. The cost for protection is nearly off the charts. Feels extreme given S&P 500 is about 4% from new ATHs. Nice one from @MacroCharts
MEG Shut-In Hurts Tankers, Fuels Oil Rally, SPY Overbought
Full shut-in of the MEG (AG) is obviously bearish for short- mid-term #tanker markers. The tanker stocks are betting this lasts *months*. Oil is partially reflecting, but $SPY is wildly bloated. Trade: -Bullish oil firms: $KOS -Mega bearish $SPY -Holding key tankers: $DHT $STNG

Oil Likely Tops Soon; Expect Retracement to $98‑$110
$USOIL - As I've already stated I think that a major top is already in, but whenever a commodity goes parabolic, it usually doesn't collapse in a straight line, but retraces a significant portion of the initial decline. The upside...

DKS Gaps Up on Earnings, Pullback Still Above Yesterday
$DKS gap up and pullback now well over yesterday close on ER. New here on the pullback

Watch 10 AM Gap‑
Intraday breadth levels --10:05 AM. At 10:00 AM is typically when you get gap down bounces. Let's see how this plays out. https://t.co/KEBy6nTMTA

Market Walkdown Signals Impending Sprint to Exit
How wild would it be if everyone who called for Black Monday last weekend was just a week early? The market is being consistently walked down and eventually people come to their senses as to what's going on and the walk...
SPY Slides Below $669, Hits Weekly Low
$spy failed it reclaim $673 and now below $669.50. See if it stays below. Fast tape. $662ish is low of the week

Semiconductor Index Shows Head‑Shoulders Failure
$SOX Daily. Heckuva spot for semiconductors to fail: potential head & shoulders top & lower high. $NVDA has been negatively diverging from sector for months https://t.co/LiA0UEyDIL
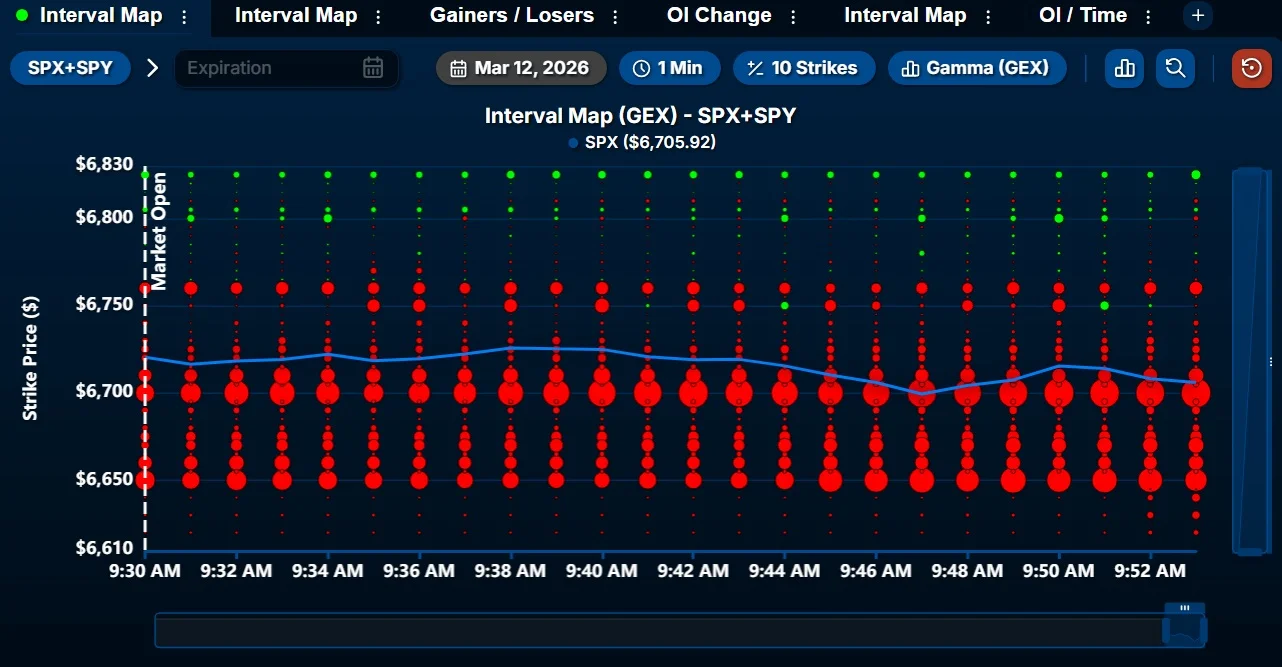
Negative Gamma Pushes SPX/SPY Toward 6700 Support
Gamma exposure for the combined $SPX + $SPY view shows mostly negative exposure under spot. $6700 is a key support level; if it breaks, we could see a move towards $6650 pretty quickly. The range we are currently in is...
NVDA Short Offers 4:1 Risk‑reward,
With a stop loss at $192, where $NVDA has not been able to break out above, the risk is $10 from here with $40 upside (short) down to $142. Great risk / reward. Oh by the way, $NVDA is 7.7%...

Gap Fill Levels Test December Low Support
Another day… another downside gap at the opening… and another test of the support at the December low. $SPY would have to rally to 673.34 and $QQQ to 605.03 to fill today’s gaps. How quickly they get filled -- if...

Lennar Shares Plunge over 50%, Hitting Multi-Year Lows
Lennar $LEN - reporting today... currently more than -50% from highs... and a contestant on the 52-week new lows list (and multi-year new lows list)... https://t.co/gPTOqr0qj4

Dollar, VIX, and Yields Surge Past 20‑Day EMA
U.S. dollar $DXY, volatility $VIX and yields $TNX all rising in tandem > 20-day EMA... https://t.co/Dv49pGJIRC

Open Text Slides Below 50-Day Moving Average
Open Text Stock Price Crosses Below 50-Day Moving Average. Here's What Happened. (MarketBeat) #OTEX #Technology #Stocks #Valuations #JVGpost https://t.co/brHJMM3wep https://t.co/zKbPrCs6RV

Futures Struggle at WTD AVWAP; Overnight Low Break Risks Trouble
Futures are struggling with the WTD AVWAP, a break of the overnight lows could be troublesome $ES_F $NQ_F https://t.co/pQGwLxlyHR

Corn Rises, Soy Falls: Money Flow Drives Momentum Trade
#Corn story seems to be getting more and more bullish and the #soybean story seems to be getting much more negative. This isn't a production issue for soybeans such as hot and dry weather cutting the crop. The...

Weakening Breadth Signals Deteriorating Market Momentum
Ok...let's do some thinking this morning. The "Bull Case" was breadth being strong. The "Bear Case" was Momentum, Risk On vs. Risk Off, Credit Spreads, Defensive Leadership.... Now breadth has weakened and the other variables have only gotten worse.....

Use Order Flow to Spot Momentum and Mean‑Reversion Trades
Order Flow Trading Momentum trades: - Check for thin book ahead (less resistance in the direction of the move) - Check for aggressive volume bubbles (green for longs, red for shorts) - Check for trailing limit orders (support/resistance building behind the move) Mean reversion trades: -...

ALFA Climbs 9% Despite AI Fears and Dividend Cut
#ALFA hit 9% although the FY Results read very well. ShareScope has fwd p/e 19.4 RISING to 19.8 and fwd Divvy 2.6% FALLING to 0.9%, BEFORE drop today. I guess AI fears are hurting but ALFA claim AI will help...

21‑Day MA Support Signals Bitcoin Momentum, Altcoins Gain
This is what you'd like to see. Consolidating within this range, and in the meantime, more strength is going towards the #Altcoins. As long as the 21-Day MA holds as support, I would suggest we'll see more momentum coming into the...
Buy Silver Above $90, Target $95‑105
Silver near $85.7; VC PMI & Square-of-9 point to $93–95 then $105. Risk: break $90, target $95–105 🔺 — Viktor Kopylov, PhD, CFA. More insights: t.me/si14Kopylov

Oil and 10‑Year Yield Rise Together, Signaling Possible Bailout
Oil (white) and the 10yr treasury yield (green) are going in the wrong direction ... up! Wen bailout? https://t.co/BCYqJRrZpQ

Gas Oil Retests Support, Poised for Further Upside
Gas Oil has retest support and should now push higher, although one more retest is possible https://t.co/NI5aQRpZPM

Buy Norwegian Stocks Each Time Bodo / Glimt Scores
claude, buy norwegian equities every time Bodo/Glimt scores a goal. don’t hedge the FX. make no mistakes

FTSE100 Stalls in Sideways
#FTSE100 doji Candle and Sideways. Support 10082, 9630. Resistance 10636, ATH 10935. RSI 48.5 near Neutral. Doing 13/21 day EMA Bear Cross. Bottom Bollinger Band 10075. Midpoint Line 10530. Top Band 10978.

DAX Slides Into Gap, Bearish Signals Dominate
#DAX doji Candle and dropped back into the Gap from yesterday. Support 23342, 22927. Resistance 24061, 24367. RSI 40 not low. 13/21 day EMAs Bearish. Bottom Bollinger Band 22852. Midpoint Line 24170. Top Band 25470.

Brent Oil Stalls Near $95 Resistance, RSI Overbought
#BrentOil Comp Doji Candle and Sideways. Support $84.1, $80, $73.2, $66.8. Resistance $95, $100, $108.2. RSI 70 Overbought. Top Bollinger Band $105.6. Midpoint Line $85.3. Bottom Band $64.9.

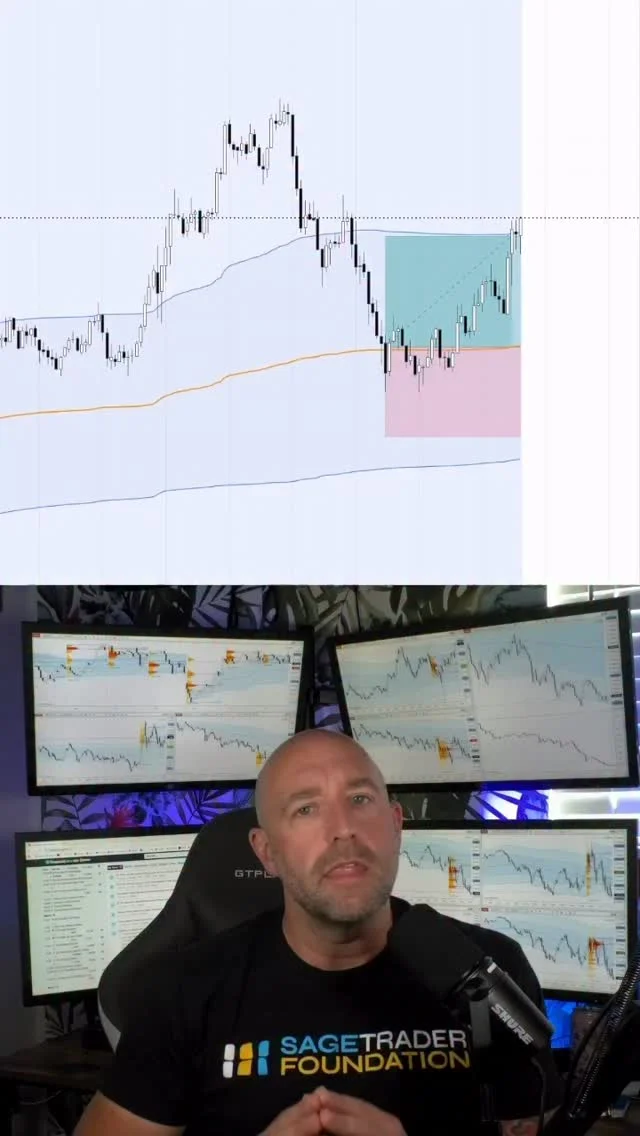
Avoid Trades when Long and Short MAs Hug
Most traders get chopped alive in Asia and London sessions. Not because they're bad traders. Because they ignore one simple signal. When your long-term MA and short-term MA are hugging each other, the market has no conviction. No conviction = no trade. The...

SPX Forms Multi‑Week Descending Channel Amid Bull Trend
What would you say the prevailing trend is for the $SPX? That is a question of time frame of course, but there is a multi-week descending trend channel tentatively forming against the larger bull trend from last April's Liberation Day tariff...

AMC's $1.10 Level Marks a Soul‑saving Battle
My first tweet predicting $1.10 would be a level. At the time $AMC was barcoding $1.50. I told you that this level was where $AMC would fight for its soul.

Key Chart Sparks Discussion Among Factor Community
This could be an important chart. Discussing it today with members of the Factor community at https://t.co/gDeM5nTRIY $FGBL1! https://t.co/4KCxWZ88fE

S&P 500 Stalls
$SPX -0.08% and closes smack-dab in the middle of its intra-day range. Was it a failure to go up or an inability to go down?

QQQ Needs 100‑Day MA Close to Confirm Low
$QQQ - The bullish engulfing candle on Monday didn't have follow through in the last 2 days. It has to close above the 100 day MA to in order to confirm an intermediate term low. The odds favor that it...

Bull Markets Gain More Than They Lose
Wave 2 retraces 50–61% of the length of Wave 1. Wave 4 retraces only 38% of the length of Wave 3, and then you get Wave 5, which is typically the same length as Wave 1. What does all this mean? It means...

Soybeans Hit 11‑Session Overbought Streak, RSI 85
📈CBOT November soybeans pushed higher on Wednesday, ending at $11.63-1/4 per bushel and marking their 11th consecutive session in overbought territory (RSI of 70+). Relative strength index has reached 85. Last time new-crop bean RSI was 85+ in year of expiry?...

Market Still Trendless—Avoid Overtrading in the Chop
Your daily reminder that we’re still in a trendless market at the index level. Don’t spin your tires too fast trying to force trades within the chop fest. https://t.co/T9j49HfLtq

Mag7 Support Break Could Trigger 10% Market Correction
If the markdowns continue for equities, then the Mag7 will likely break support (below). That could be enough to turn what so far has been a 4% SPX drawdown into a more bona fide 10% correction. We can see from the...

Consumer Staples Face Pullback, Premium Erodes
Consumer staples getting some of that premium knocked out of them over the past week. If you wanted a pullback you're getting it. $XLP https://t.co/ro0tAusmFy
VWAP Acts as Dynamic Support in Strong Trends
Oil volatility is back 🔥 One VWAP Bounce this morning paid before 8AM. In strong trends, VWAP becomes dynamic support, not mean reversion. Most traders fade it… Professionals buy the pullback. Comment VWAP and I’ll send the free guide + Discord. #trading #futures #vwap

Spotting Single-Print Cave Fill on Market Profile
This is how the single print cave fill area looks on Damon's market profile charts where he is working this live... @DamonPavlatos https://t.co/mGAgEsHYQ4 https://t.co/zoRmbEuifu
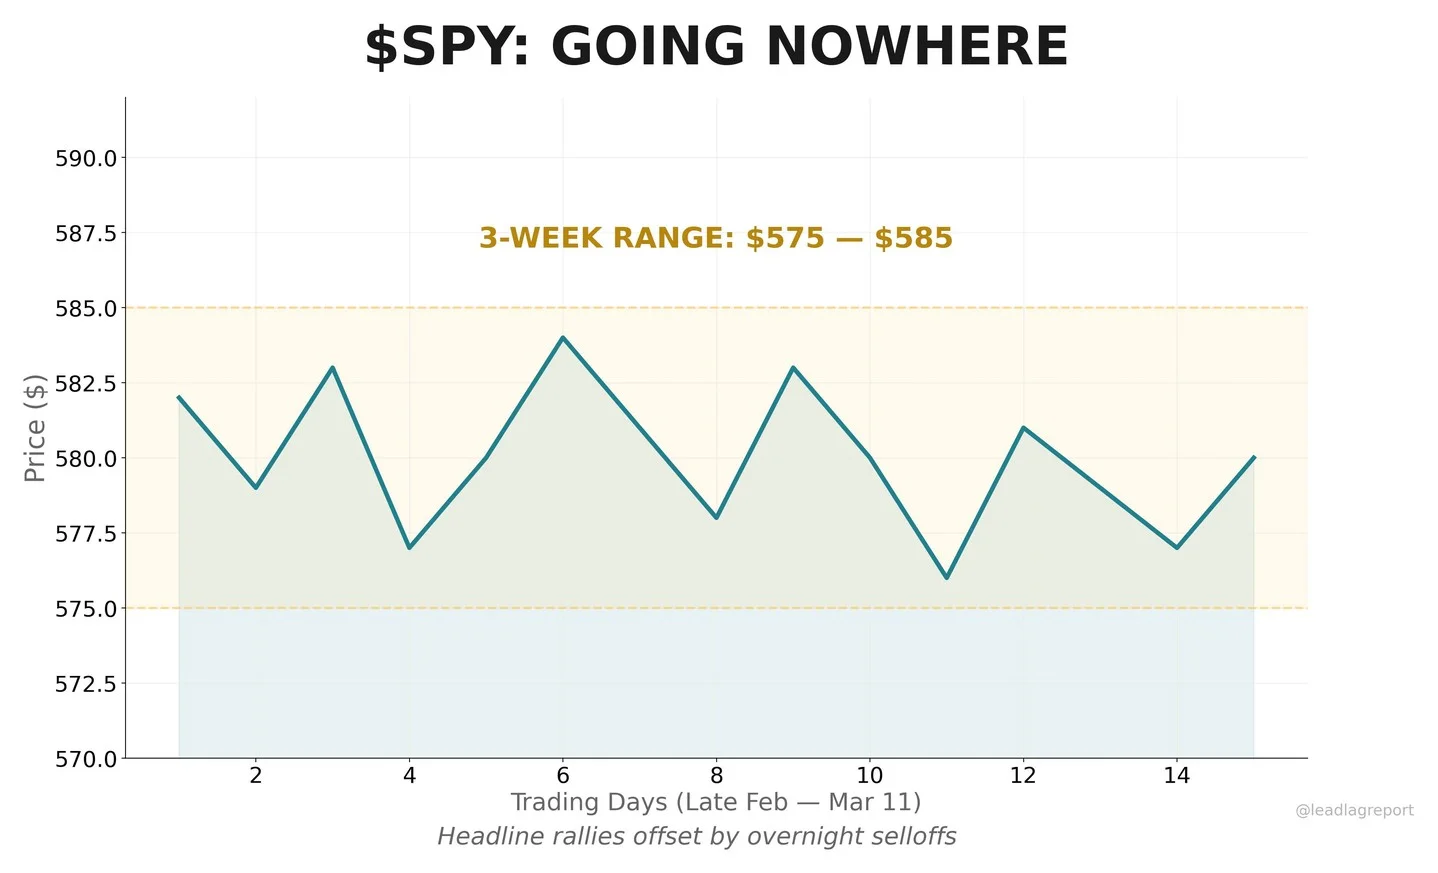
Flat SPY Signals Indecision, Not Stability, Ahead
$SPY has gone nowhere in 3 weeks. Stuck between headline rallies and overnight selloffs. Range-bound markets after a shock aren't stability. They're indecision before the next leg.

AUD/USD Bulls Target 7200 as Resistance Falters
Australian Dollar Forecast: AUD/USD Resistance Under Siege – Bulls Eye 7200 https://t.co/Z4xmadvNgr $AUDUSD Weekly Chart https://t.co/GZy1mBhw92

Prioritize Index Trend Before Making Trades
The index trend matters first. Understand the trend and make trades based on that trend.

QQQ Faces Resistance at 615, Support Near 572
$QQQ resistance on underside of 20sma, so needs to get over 615. Support near 572. Tons of noise in between. https://t.co/pyLqnAyrf6

Short-Term Bearish Bias Targets SPY’s 200‑
Until that supply and trendline taken out bias short term with bears towards 200sma $SPY https://t.co/C6tM7zhQhj

SMH Holds Above 20‑Week SMA, Bullish Outlook
So far so good $SMH against 20sma weekly support. Fantastic tell going forward even if you don't trade SMH https://t.co/Q73Q72lzBz
Top Traders Use Five Setups to Manage Risk
These are the setups of the best traders I’ve interviewed: Catalyst Gaps Base Breakouts Mean Reversion Long Mean Reversion Short Pullback/Undercut & Rally They allow you to manage risk versus a key level/turning point where you can expect significant expansion from your entry

Broadcom Undervalued AI Play Targets $460
Check in – Broadcom Inc. (AVGO) Recommendation: STRONG BUY Price: $342.58 Intrinsic Fair Value: ~$450 (anchored on 25–27x 2026E EPS ~$17.51) 12-Month Price Target: $440–$460 (Base, +28–34%) Current Signal: TACTICAL BUY Entry Zone: $325–$335 (50-DMA support pullback) Fair Pricing: AVGO trades at 19.7x forward EPS amid 57% guided...

TSMC Strong Buy: Target $430, Entry $340‑355
Check in – Taiwan Semiconductor Manufacturing Co. (TSM) Recommendation: STRONG BUY Price: $352.59 Intrinsic Fair Value: $428.00 (Based on consensus & AI-driven growth models) 12-Month Price Target: $430.00 (Base case aligned with analyst avg ~$418–$470) Current Signal: TACTICAL BUY Entry Zone: $340.00 – $355.00 (Near 50-DMA...

Nasdaq up 6%; Shift From Small‑cap to Big‑tech Shorts
Nasdaq outperforming Russel by +6% since this. Would start to exit the small cap underperformance theme and rotate back to the big tech short theme, although both probably struggle together from here. https://t.co/H7964lBBpH