
S&P 500 Slides to Three‑month Low, Quarter of Stocks Follow
first three-month low in the SP 500 since April '25 with 25% of stocks also hitting a three-month low as well. $SPX $SPY https://t.co/NwLD3rcyjO

Cocoa Slides After Downward Spike, Consider Exiting
Cocoa: Easter Bunny came early this year...after a large STD move to downside, Wyckoff automatic rally up, now secondary test down for higher low or continue to base. Time to walk away... https://t.co/RHZIpfSdak
SPY Needs Positive Spark Amid Sideways Stagnation
$SPY needs to show me something positive today because yesterday's daily close was not good. Internally conflicted because charts say down more but then when have we done anything other than chop sideways for the last 4 months

Price Returns to Upper Range After V‑Test Rejection
$ back to upper end of range....bit of a V test reject above this level last night. https://t.co/BV67dxBemK

BTC Rises Amid Panic as Gappers Surge
Focus last few days in @IUTraders Gappers ✅ $IBIT nice gap over $41 $COIN over $200s $MSTR $143s Notable relative strength - while market was in panic $BTC has continued to build as bombs fly. https://t.co/akFdaHFIYy

Trader Leads as QQQ Jumps $6 Pre‑Market
here we go again... trader getting a headstart on the day $QQQ already up $6 from pre-market low. https://t.co/oIsC4P3rox

XLF Tops Jan, Slides Below Yearly Pivot, Eyes 41.93
$XLF is the 1st sector to confirm that it made a major top in January. The reason for that is that XLF has already closed below its yearly pivot at 50.96. The 1st yearly support is at 46 but it...

Market Outlook Turns Grim for New Entries.
My "Pre-flight Checklist" (which was developed years ago w/ the help of my good friends and fellow CMTs @DKellerCMT & @DavidCoxRJ) helps me get a quick, but comprehensive look at the markets each day... ...and it's looking pretty ugly right now...

S&P Rebounds From Low, Eyes 6740 Resistance Amid Hawkish Fed
$SPX hit a 6636 low Monday and bounced to 6670, and now we’ll see if early strength holds or fades with 6740ish as resistance. #FOMC is the next move as the Fed turned more hawkish with inflation and higher...

Fibonacci Extensions Converge, Stalling S&P 500 Near 7,000
If you're wondering why all the congestion in the S&P500 below 7000, there's a series of Fibonacci Extensions clustering together all around the same prices: 6958 = 161.8% 2025 Tariff Tantrum 6965 = 261.8% 2022 Bear Market 6899 = 685.4% 2007-2009 GFC https://t.co/9SPYN6lg6A

Volatility Signals Potential Crypto Peak Amid Market Rollovers
Just Getting Started, If Volatility Is a Guide - Whether volatility can stay buried may be the key question as the Nasdaq-100's (NDX) 50-day moving average rolls over alongside Bitcoin. A low-price-cure cycle common in autocorrelated commodities may be afflicting...

Hedgeye Stays Short as IDX Falls 13% Monthly
Macro Pros @Hedgeye remain short Indonesia in $IDX terms Down another -3.0% overnight, collapsing -13.1% in the last month alone #GoAnywhere https://t.co/Ny66xrqpv3

30 Years of Market Secrets: Master the RMI Strategy
🚨 WEBINAR ALERT 🚨 - 30 Years of Market Secrets: Rohit Srivastava Reveals the RMI Strategy to Buy and Sell Stocks. Markets go through cycles — bubbles, crashes, panic, and powerful rallies. Over the last 30 years, Rohit Srivastava has navigated all...

Nifty Slides Below 24,600, Targeting 22,700
Nifty Analysis And Prediction For Today 13 March 2026 By Rohit Srivastava | Indiacharts The breakdown of the head and shoulders pattern below 24,600 has led to a sharp drop, with a downside target of 22,700. A long-term trendline from...

SPX Gaps Lower, Bullish Rally Needed to Halt Decline
$SPX closed below the Dec low and today's gap, unlike others recently, wasn't closed during the day. This isn't fatal yet (the Jan 20 one [dashed line] wasn't closed until the following day) but the bullish forces need to pull...

Current ES_F
Not for nothing but any other time in say the last 8 years of Fintwit the current broadening $ES_F chart would have hundreds of 07-08 analogs on it.

Oil, Dollar Index, and Emerging Market Retest Strategies
This was a lot of fun. Check out my poolside chat with @stephenweitzel from yesterday We talk about the action in crude oil and energy, the intermarket implications of a big level for the US dollar index, and how to play...

CF Industries Leads SPX, Bet on 2026 Food Prices
CF Industries $CF was the strongest outperformer today within $SPX and it continues to be right to favor Agriculture & food prices in 2026 @IBDinvestors @marketsurge I added one of its competitors to UPTICKS for my early March addition and while...

McClellan Oscillator Signals Imminent Stock Market Bottom
Here's an indicator which points to an imminent low for stocks. The $SPX McClellan oscillator closed at -95 and is extremely oversold. It's more oversold now than it was at last April's low when it bottomed at -87. https://t.co/pICqvPPG02
S&P 500 Drops 1.5%, Erasing $1 Trillion; Crypto Steadies
NEW: The S&P 500 fell 1.5% today, erasing nearly $1 trillion in value Crypto held mostly unchanged

S&P Dips Below Dec Low: Historically Weak Returns
The S&P 500 just closed beneath the December low in the Q1. 38 times this happened and 38 times it didn't. When it breaks (like this year) the avg full yr return is 0.2% and up only 50% of time versus 18.9%...
S&P 500 Dips Below 170‑day Average, First Since May
The S&P 500 closed below its 170-day moving average for the first time since May.

Equal-Weight Materials Eye Breakout at Historic Highs
Equal-Weight Materials backtesting the breakout from the 2022 & 2024 highs. That level mattered then, matters now. $RSPM $XLB https://t.co/4V8doWcsR4

S&P
$SPX - We are getting a lower low after all. Going back to the April low, we've had a ~80 trading day cycle. Due to many holidays in this cycle, I expect this cycle to be shorter in trading days...

S&P 500 Hits Year’s Worst Close, Down 4.5%
S&P 500's worst close of the year... lowest since late November -4.5% from the January record high https://t.co/kASRYfc9MR

XHB Endures Sharpest 9‑Day Drop Since 2022
Homebuilders $XHB worst 9-day selloff since June 2022 -13% since the first of the month. The housing market sucks. @stockcharts https://t.co/wJDyxPUMdv

Upcoming $LE Stub Valuation Offers Pre‑Earnings Tender Opportunity
What's the Land's End $LE stub worth? I guess we'll know next week. If there's any interest I'll write it up, still an opportunity to enter & tender ahead of next Thursday's earnings (where I expect a clean PF bridge...

SPX Extends 7-Day Run Below Trading Box
$SPX has traded below the latest trading box for 7 straight days. Only closed below it twice. Today would be the 3rd. https://t.co/gYeIND2TmK

Quarter of US Stocks Hit 52‑week Highs Today
There's actually a pretty decent list of S&P 500 52wk highs... bunch of food/ag, chemicals, refiners @stockcharts 1-in-4ish US stocks are up today https://t.co/ebgPXxwKyU

Rate‑Hike Pricing Hits S&P, Small‑Caps
As the front part of the curve moves closer toward pricing in Fed rate hikes, SPX is down just 1.2%... and the Russell 2000 isn't getting killed $SPY $IWM https://t.co/ITSA3q3sjN
BROS Turns Red, Stop Hit; Modest Profit Remains
$BROS no green to red stop hit all out made OK money on the remaining shares.

Tesla's 20‑day vs 200‑day SMA: Breakout Imminent
Do or die $TSLA downsloping 20sma holding it down, 200sma holding it up. One will break soon. Place your bets. https://t.co/csbOJugLZu

QQQ Stalls Below 21‑EMA, Seeking Higher Low
$QQQ. We've been unable to break above and hold the 21ema Was expecting expansion given the tight closes and we expanded to the downside. Can we finally form a higher low? https://t.co/CDUK1fALp5

Methanex Surges 9% as Buyers Snap up $65 Calls
Methanex (MEOH) up over 9% now with buyers 2850 April $65 calls $2.10 to $2.45 The research works .. https://t.co/MV0sW89wl4

S&P 500 Historically Bottoms Each March 12
Over the past past 20 years, the S&P 500 has bottomed for the year on March 12th. Today is March 12. https://t.co/1JGQH2gnm2
Testing $200 DKS Roll: Will It Hold?
$DKS for the $200 roll lets see if it sticks/holds over this time. Still own full + paydays

Air
$APD Daily. Air Products another chemicals play, besides $DOW $LYB charts we noted yesterday, thriving given supply constrains in Middle East. Falling channel breakout https://t.co/aeAMmA94lv
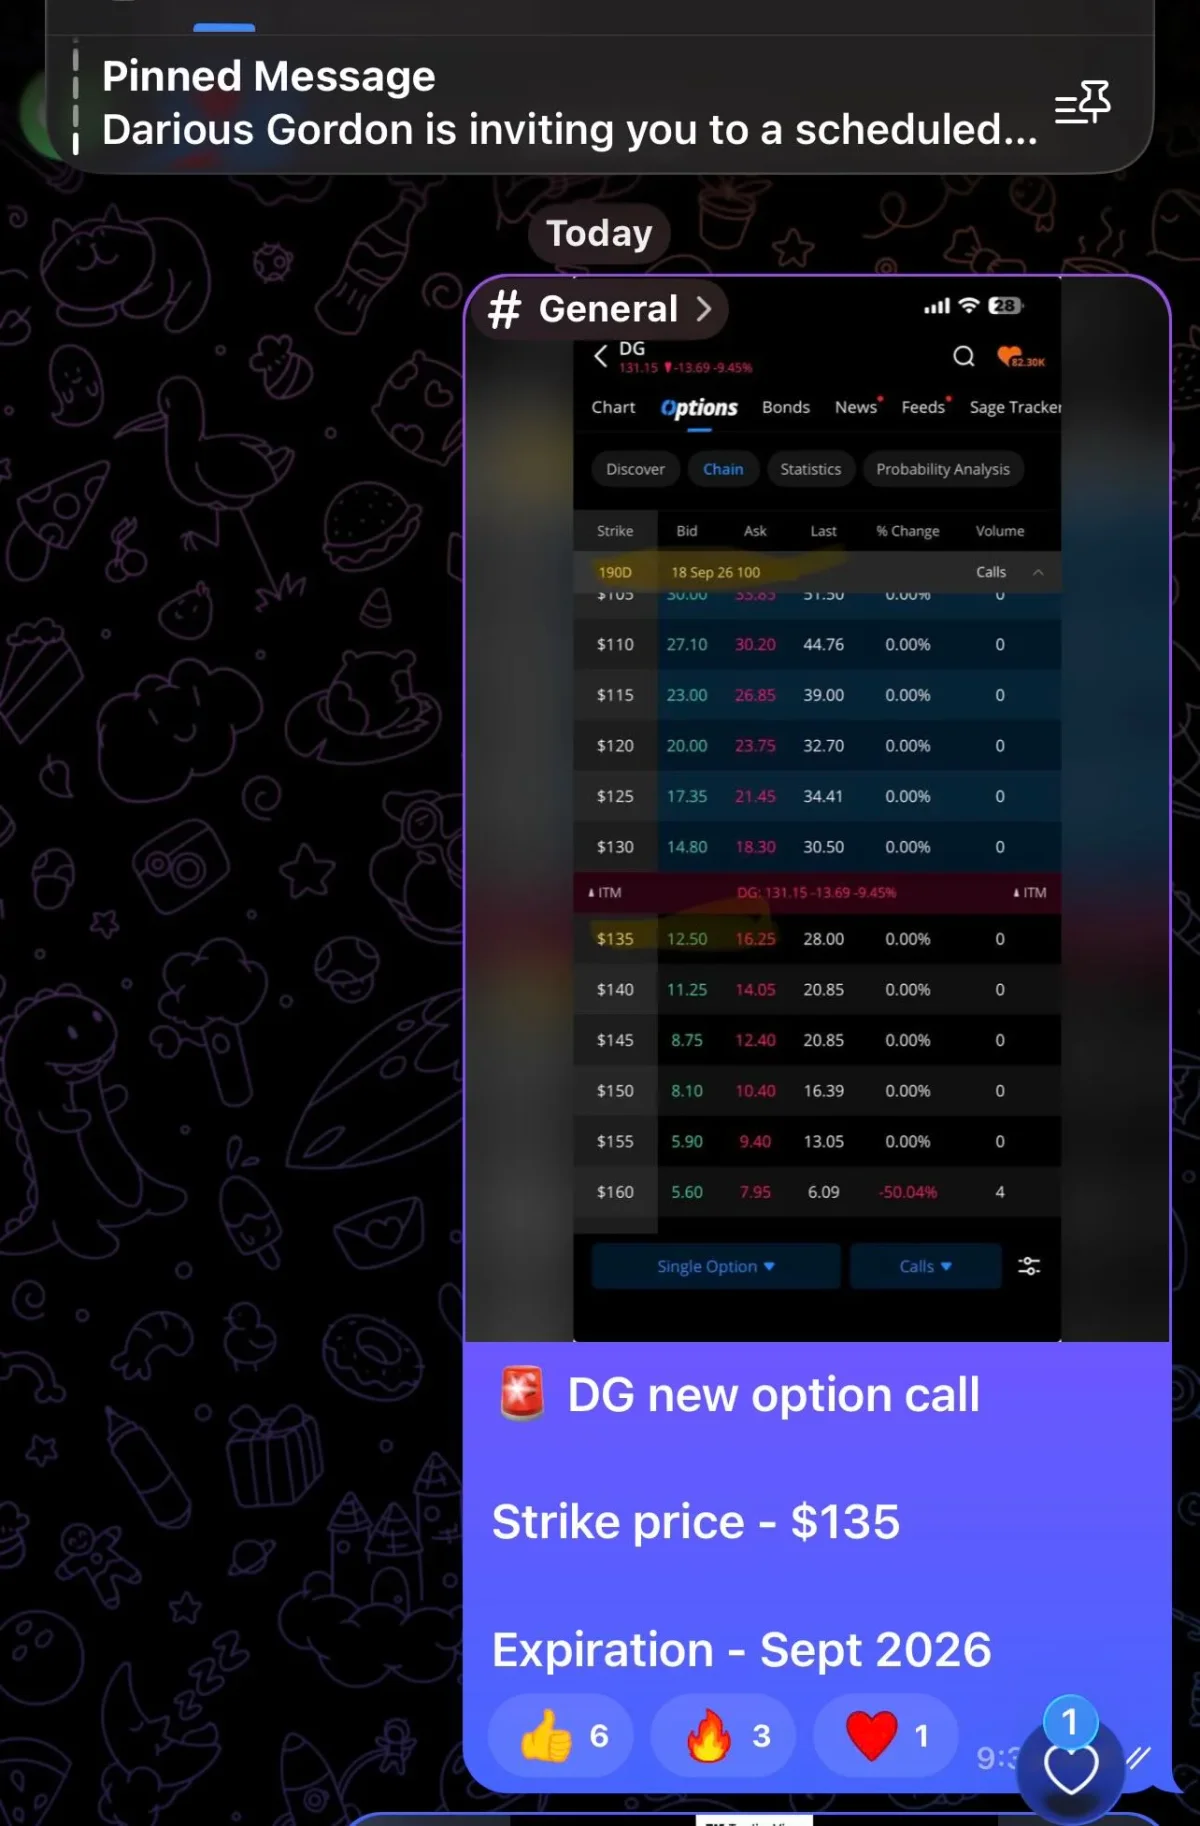
Dollar General's Earnings Beat Sparks 20% Two‑Hour Surge
🚨DG (dollar general)🚨 This was one of the quicker trades we’ve taken lately (20-25% in 2 hours and closed) The reason why I knew to scale in? ✅ company just double beat on earnings this morning ✅ company has a projection price target of...

Nasdaq 100 Approaches 200‑Day SMA, 2nd Small
The Nasdaq 100 is staring down its 200-day SMA just like the Dow and S&P 500. Notably, the index is sporting its 2nd smallest 6-month range (as a percentage of spot) on record: https://t.co/D3FuDpSJFh
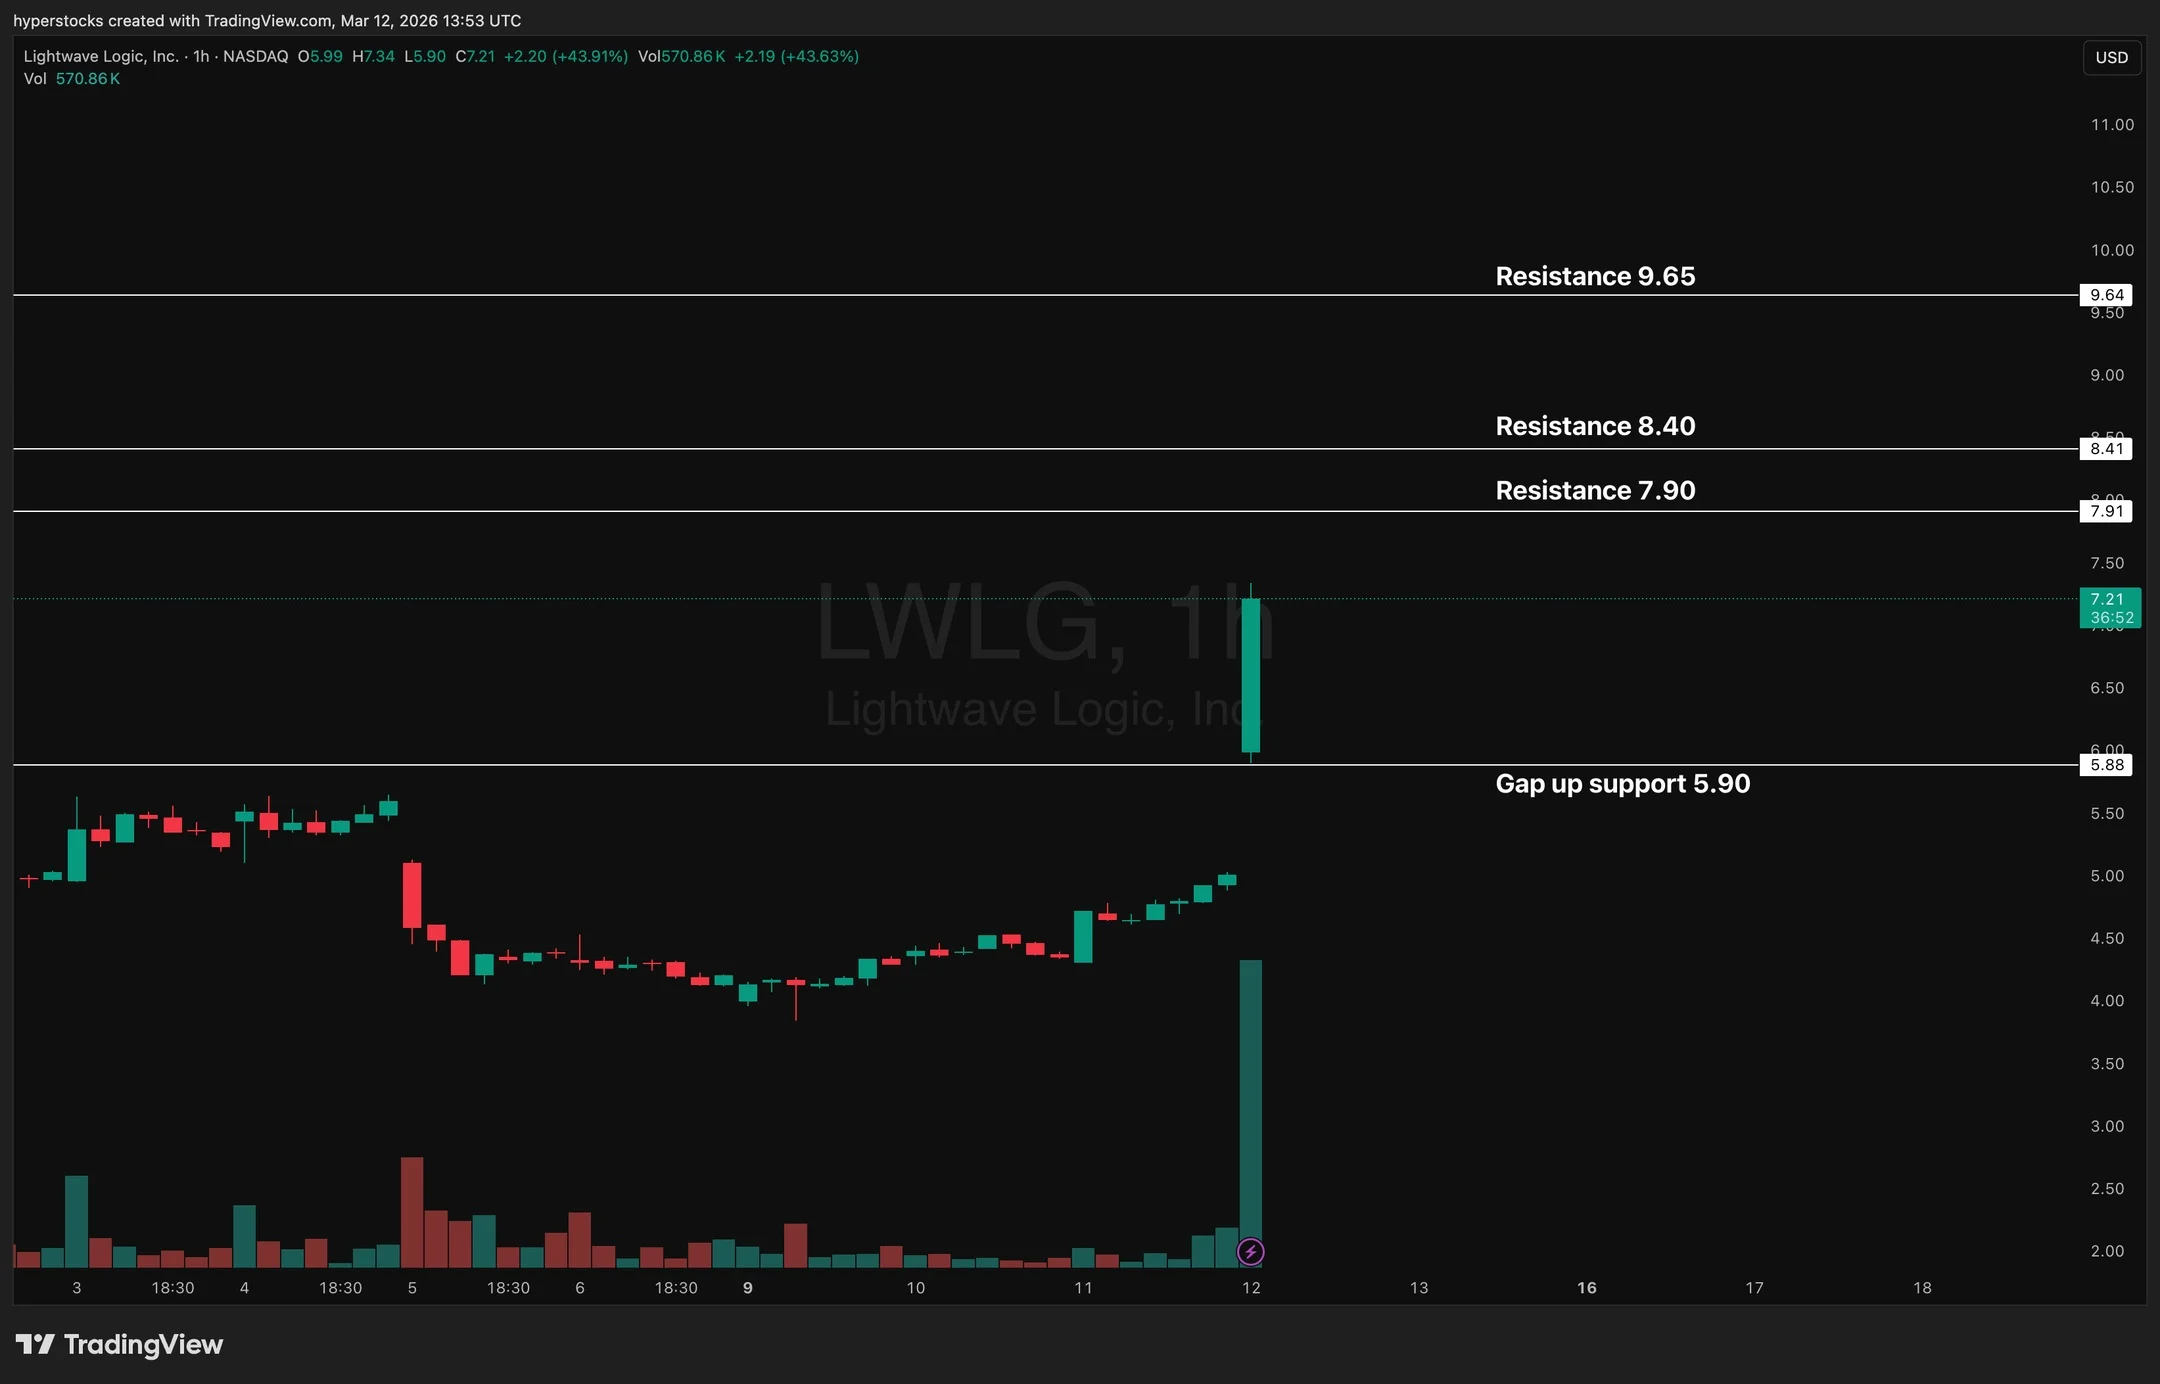
LWLG's New Deal Sparks Bullish Sentiment, Potential Short Squeeze
$LWLG having itself a day after inking a new agreement. Still a young company with a ton of execution risk, but near-term sentiment is bullish. 8% short float..could trigger a mini short squeeze if volume increases.
Industry Flow Boosts Mosaic Calls, Buying Momentum
Mosaic (MOS) 9100 April $37.5 calls buy 1.05 as these names keep going The power of industry-wide flow trends

Avoid Chasing Soaring Stocks; Volatility Erodes Quick Gains
Chasing stocks that are soaring can be tempting — but those gains can vanish quickly amid market volatility. https://t.co/sMK6GH12Xx

GBP/USD Bears Test Key Support for Seventh Time
British Pound Short-term Outlook: GBP/USD Bears Charge Pivotal Support for a Seventh Time https://t.co/S0r6Spt5dp $GBPUSD Daily & 240min Charts https://t.co/HERuBmlZ9Y

Circle ($CRCL) Stands Out Green Amid Red Momentum Portfolio
It's a sea of red across the momentum portfolio today, one of the few green standouts is Circle hanging tough $CRCL https://t.co/2fGzV4CD5u

66% Downside Day at 11:00 Holds No Significance
A mere 66% downside day at 11:00. Has no significance. DVOL/(UVOL+DVOL); Lowry’s definition. Data per https://t.co/iX5L1DJIjD. See https://t.co/7TpOm9eA5A for explanation.
USO's IV30 Spikes 15%, Contrary to Expectations
$USO leads everything today in IV30 rise, +15%, the exact opposite of what we want to see

Historic Rally Marks 161.8% Bear Market Retracement
After a historic rally from the Liberation Day lows, I don't think the pause around here that we've seen for months is all that surprising. This is also a 161.8% retracement of the bear market from last year. Random? Maybe, but...

Expect a 4‑Hour Market Stall After Rapid Move
Those who smoke brisket can relate. In big move days the move happens rapidly till about now. Then the combination of 0DTE and leveraged ETF rebalance flows causes a 4 hour stall. Wrap the meat. Leave...

SPY Holds Underside Resistance, May Slip to 650
Break last week, follow through down this week thus far $SPY as underside resistance held. Drift down to next support would not surprise us (650s) https://t.co/DqWUufZwgu

AAPL Misses Expectations, Slides to $254 Key Level
I thought $aapl would act better this morning. It didn’t. Hurt a bit. $254 a key level now