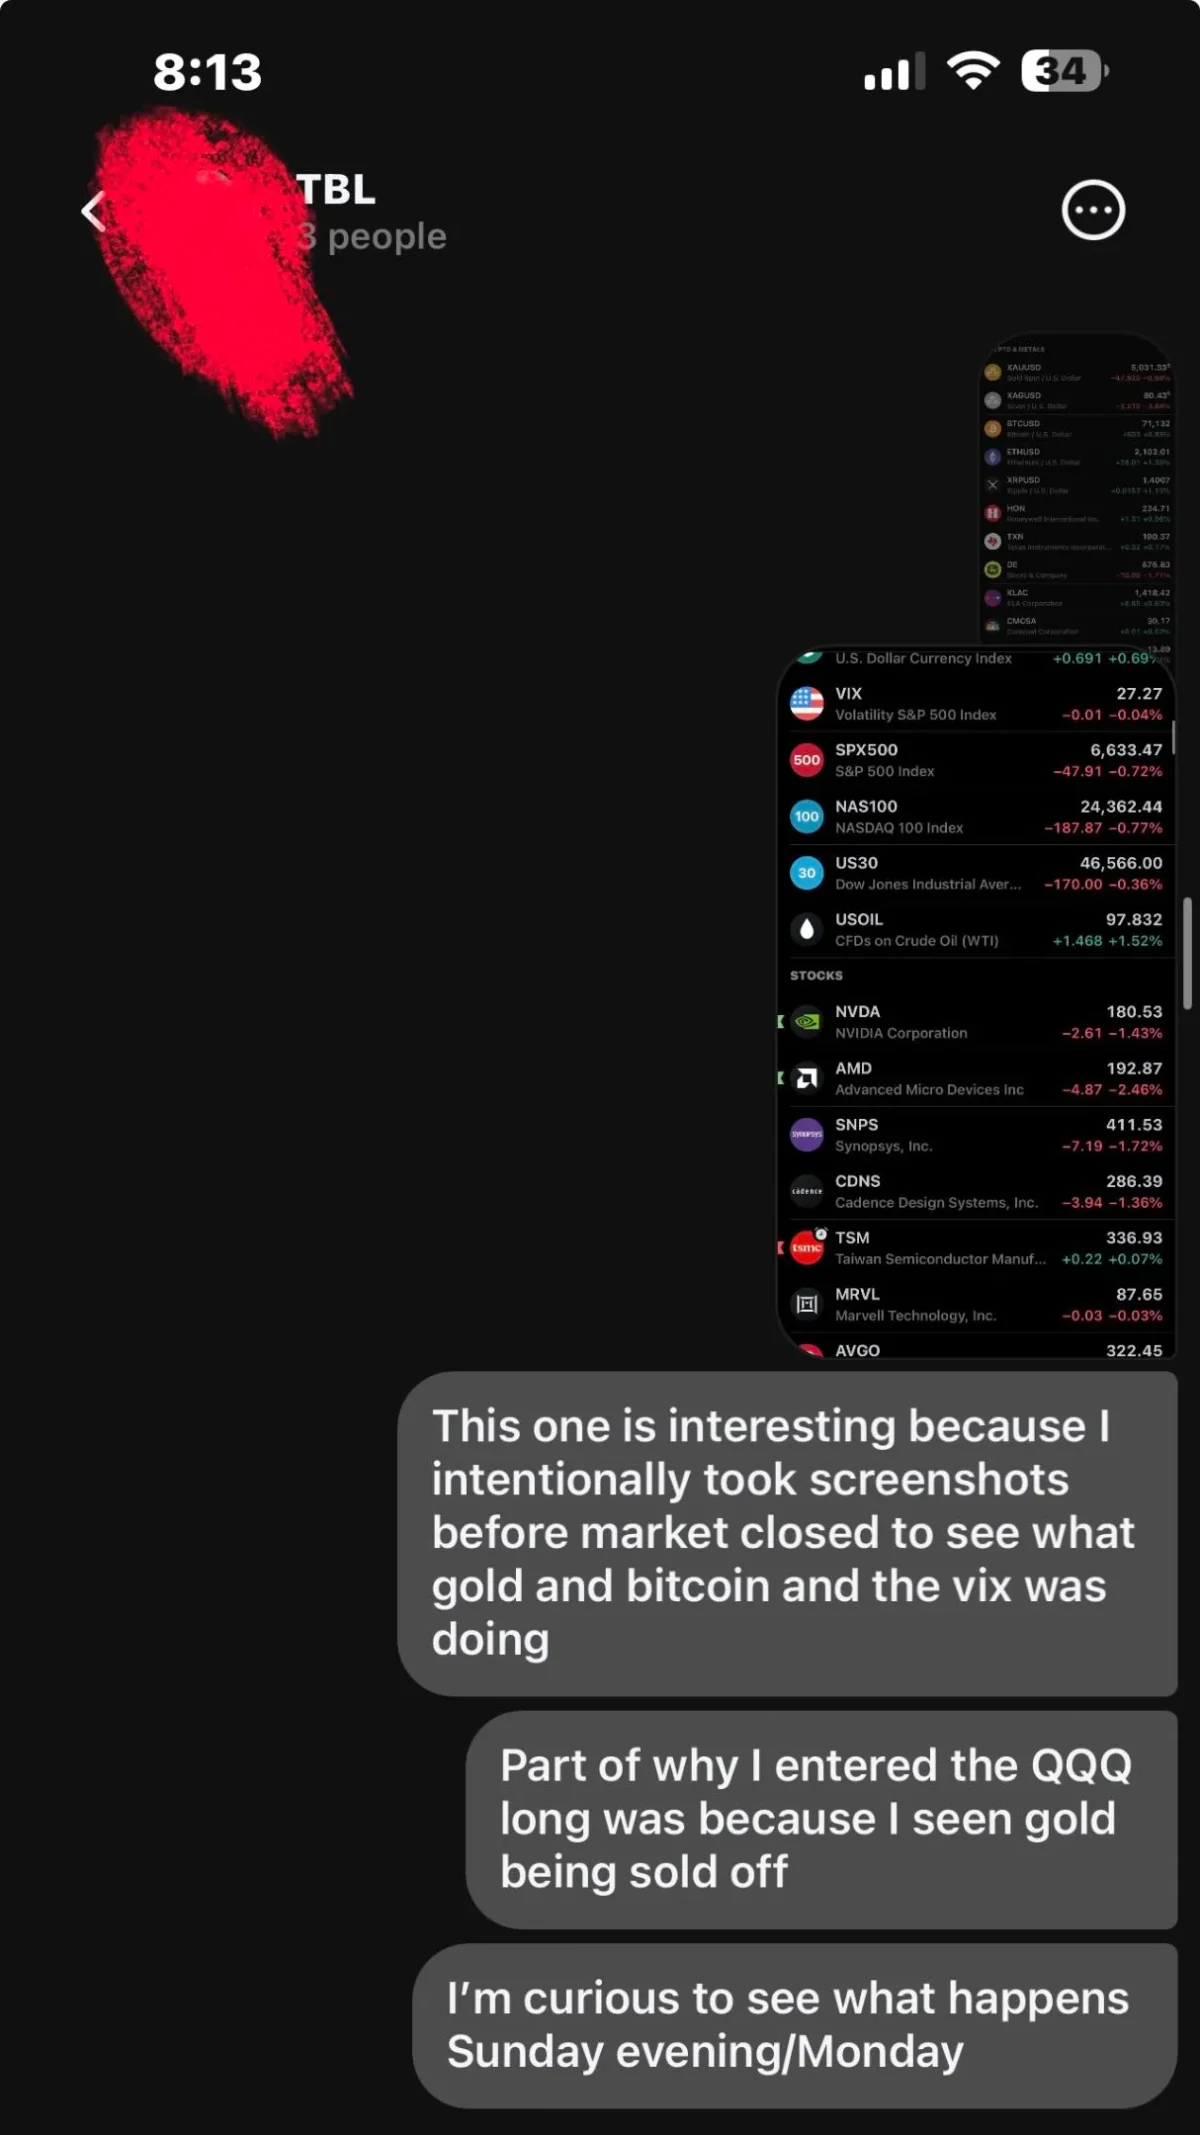
Data-Driven Insight Predicted Green Market, Long QQQ Wins
Market is green who is surprised 🤔 Tell you this much I’m not Don’t believe me? Look at the screenshots yourself On Friday TBL team and I seen an imbalance forming Bitcoin red? Gold red? Vix red? I knew something was lying And when you have as much data as we have? You can literally see the QQQ success rate WEEKLY historically for the month of March lol This trading thing becomes easier the more data you compound Naturally I went long QQQ Friday I’ll see some of you inside TBL 📈
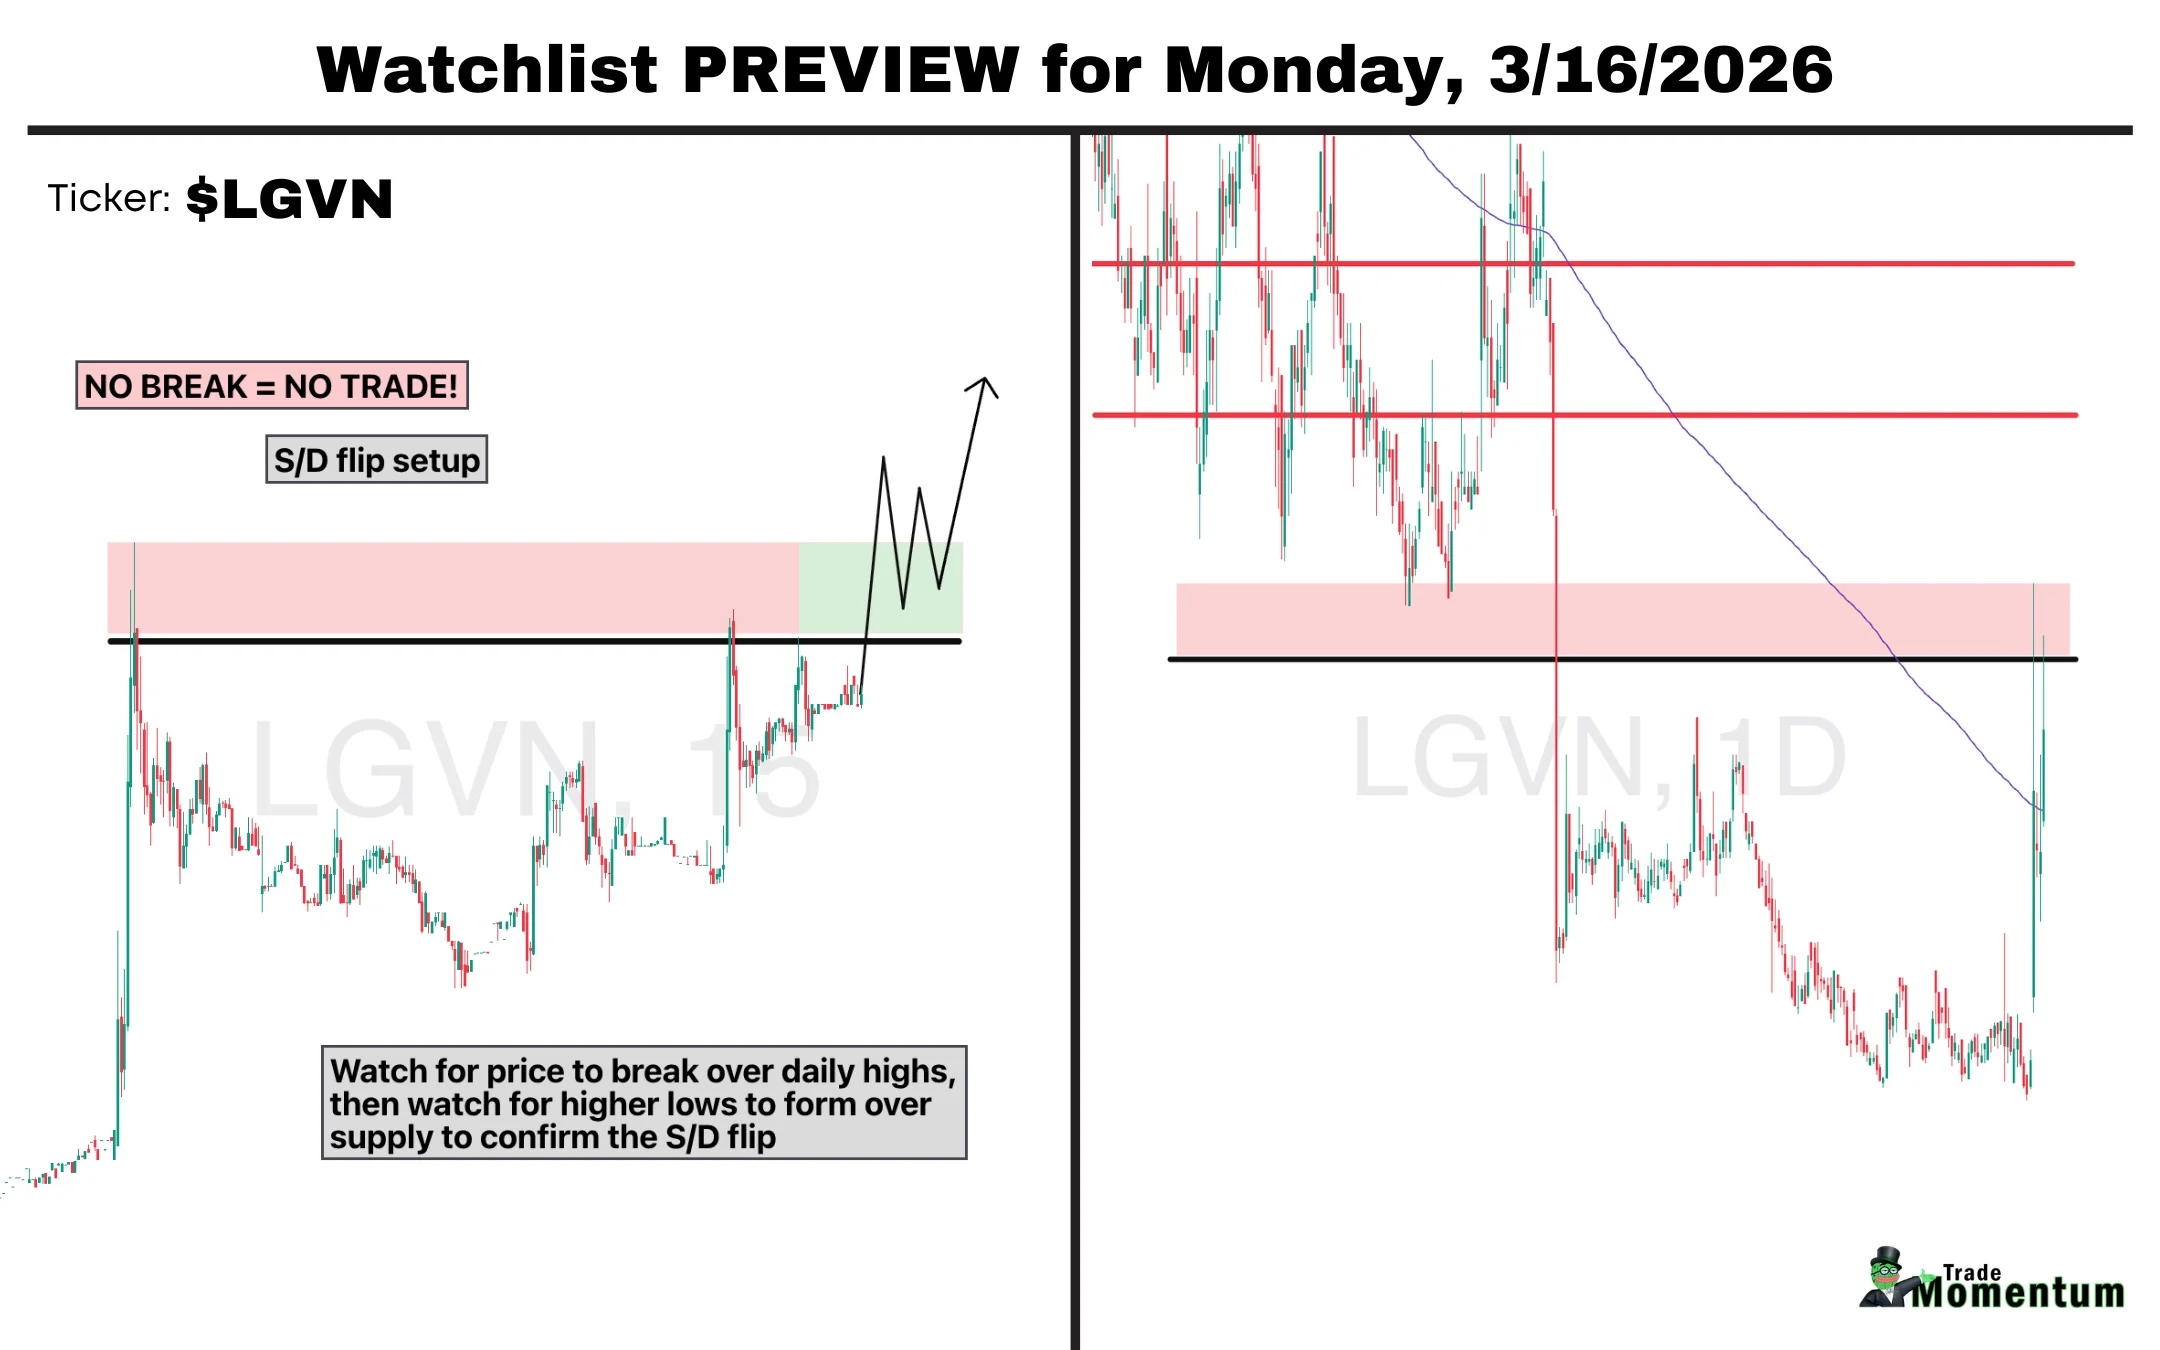
Longeveron Primed for Breakout Post‑placement
$LGVN - "Longeveron closes USD 15 million private placement of shares" Over 50x relative volume on its initial breakout last week over its 200MA, followed by multiple days of low relative vol consolidation... now, I'll be looking for continuation on the...
Sunday Stalk List: Spotting the Market Bounce
The Sunday Stalk List | Ep. 40 This Week’s Theme: The "Bounce" Check out the charts I'm Stalking 👇 https://t.co/F52ws0GUdA

FTSE Small-Cap Faces Bearish Pressure, Testing Support
#FTSEsmallcap small Down Candle. Support 7354, 7155, 7102. RSI 32 low but not Oversold. 13/21 day EMAs Bearish. Down Candle on Weekly. Top Bollinger Band 7918. Midpoint Line 7675. Bottom Band 7432.

Nasdaq Tests Key Support Amid Bearish Indicators
#Nasdaq Comp Down Candle and testing Support. Support 20906, 20560, 20000. RSI 41 not low. 13/21 day EMAs Bearish. Inverted Hammer on Weekly, but really a doji. Top Bollinger Band 23030. Midpoint Line 22572. Bottom Band 22122.

Markets Hunt Exit Strategy in Weekly Report
Weekly Market Report: In Search of an Off-Ramp. Everything you need to know, almost. Link in reply below. 👇 $SPY $GLD $VEU $UUP $TLT $DBC $IEF https://t.co/5P0NWyluhR

Monday Trade Picks: Energy, Crypto, Cloud, and More
Dragonfly Capital - Trade Ideas for Monday: Peabody, Coinbase, Devon, H&P and Cloudfare https://t.co/nGJcG76Dlp $BTU $COIN $DVN $GP $NET

S&P 500 Logs 32nd 5% Pullback Since 2009
The S&P 500 is down 5.4% from its Jan 28 peak, the 32nd pullback >5% since the March 2009 low. Video: https://t.co/P29a0c5vMR

Crude Oil's 48% Surge Marks Second‑Largest 2‑Week Jump
Crude Oil Futures started trading in 1983. The 48% spike over the past 2 weeks was the 2nd biggest 2-week % increase in history. From $67/barrel to $99/barrel... Video: https://t.co/P29a0c5vMR

Volatility Confounds Bears; Navigate With Clear Criteria
The Weekly Compass is Live: Volatility has dominated over the last weeks confusing even the bears, despite the clear bearish resolution. I break down the essential criteria and the specific levels you need to navigate this environment without getting caught in...
Master Institutional VWAP: 4‑Step Framework for Traders
VWAP is the #1 indicator institutions watch — but most retail traders use it wrong. 🏦 In this video I break down the 4-step VWAP framework I use every session: Trend ➝ Pullback ➝ Reaction ➝ Execute. 📊 Comment VWAP and I’ll send...

S&P 500 Poised to Retest Feb 2025 Highs
S&P 500 Index feeling a tad top heavy, if a couple of nearby lines of support get captured, it could set up a move back toward the the February 2025 highs (6,147) prior to the puke that took out...

Equities Near Bottom, Expect Weakness Then Reversal
Positioning suggests equities likely near a bottom... Weakness early next week followed by a reversal? Chart @SubuTrade https://t.co/u7fpaG36eG

Stocks Typically Bottom Five Months Before GDP Rebounds
As recession fears mount, remember that stocks bottom ~5 months before GDP inflects. JPMAM https://t.co/R8swcw5iFp

High AAII Bearish Sentiment Signals Strong Future Returns
AAII bearish sentiment at 46.4%. Historically, readings above 40% have preceded some of the strongest 6-month forward returns. The crowd is a gift if you fade it. https://t.co/mif2wA7u7k

Consider Buying NVIDIA if It Slides Below $170
Not exactly willing to chase or overpay for large-cap tech right now, but I wouldn’t be mad about an undercut of the 170 lows to pick up some cheap NVIDIA. Discussed more in this week’s video: https://t.co/ov4LwpAgW0 $SPY $QQQ $VIX...
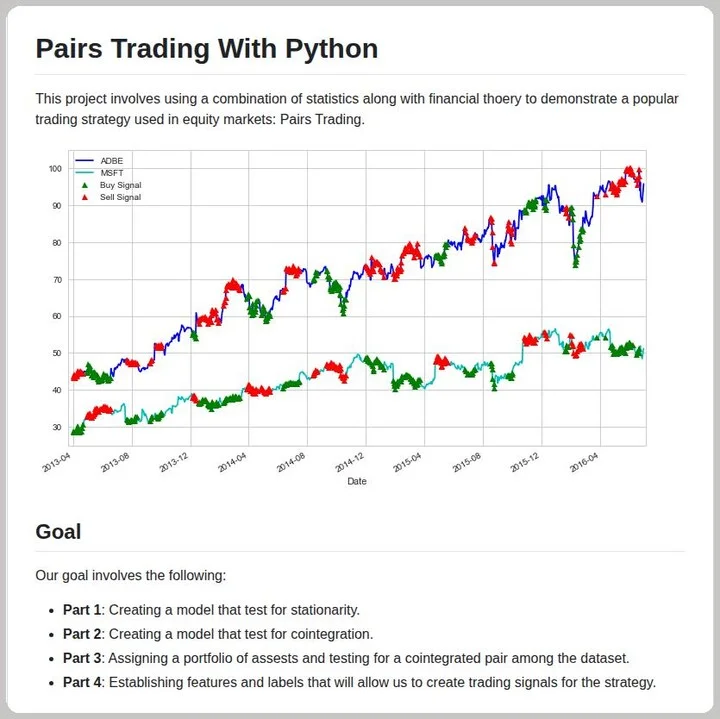
Free Deep Pairs Trading Strategy Threatens Hedge Funds
Hedge funds are worried. Stat arb is now available to the masses. Some guy just published the most in-depth pairs trading strategy I've ever seen. 100% free
Ge
Here it comes. Covering : - US Strike on Iran's Kharg Island - Impact on USOIL & trade idea with targets - Why Gold ( XAUUSD ) isn't moving higher & whats next for it - Stagflation update & its impact - US Indexes update &...
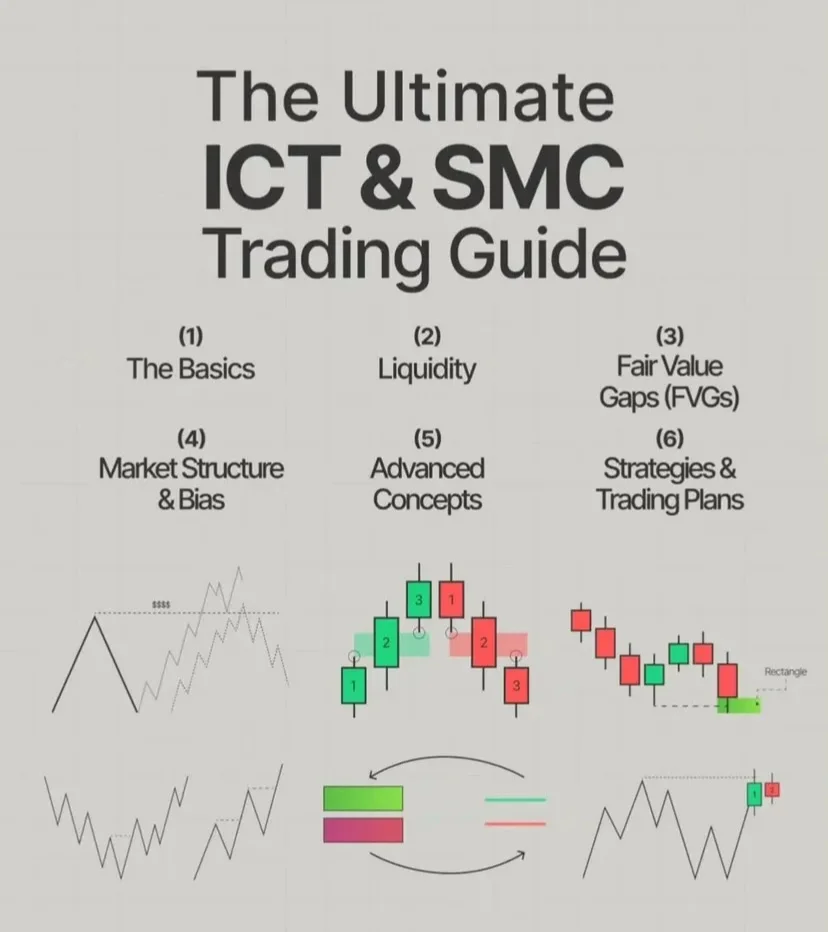
Free 12‑Hour ICT & SMC Trading Masterclass
The Ultimate ICT & SMC Trading Guide📊 12 Hours Free Course 📊 Liquidity📊 Market Structure📊 Fair Value Gaps📊 3 Structures 📊
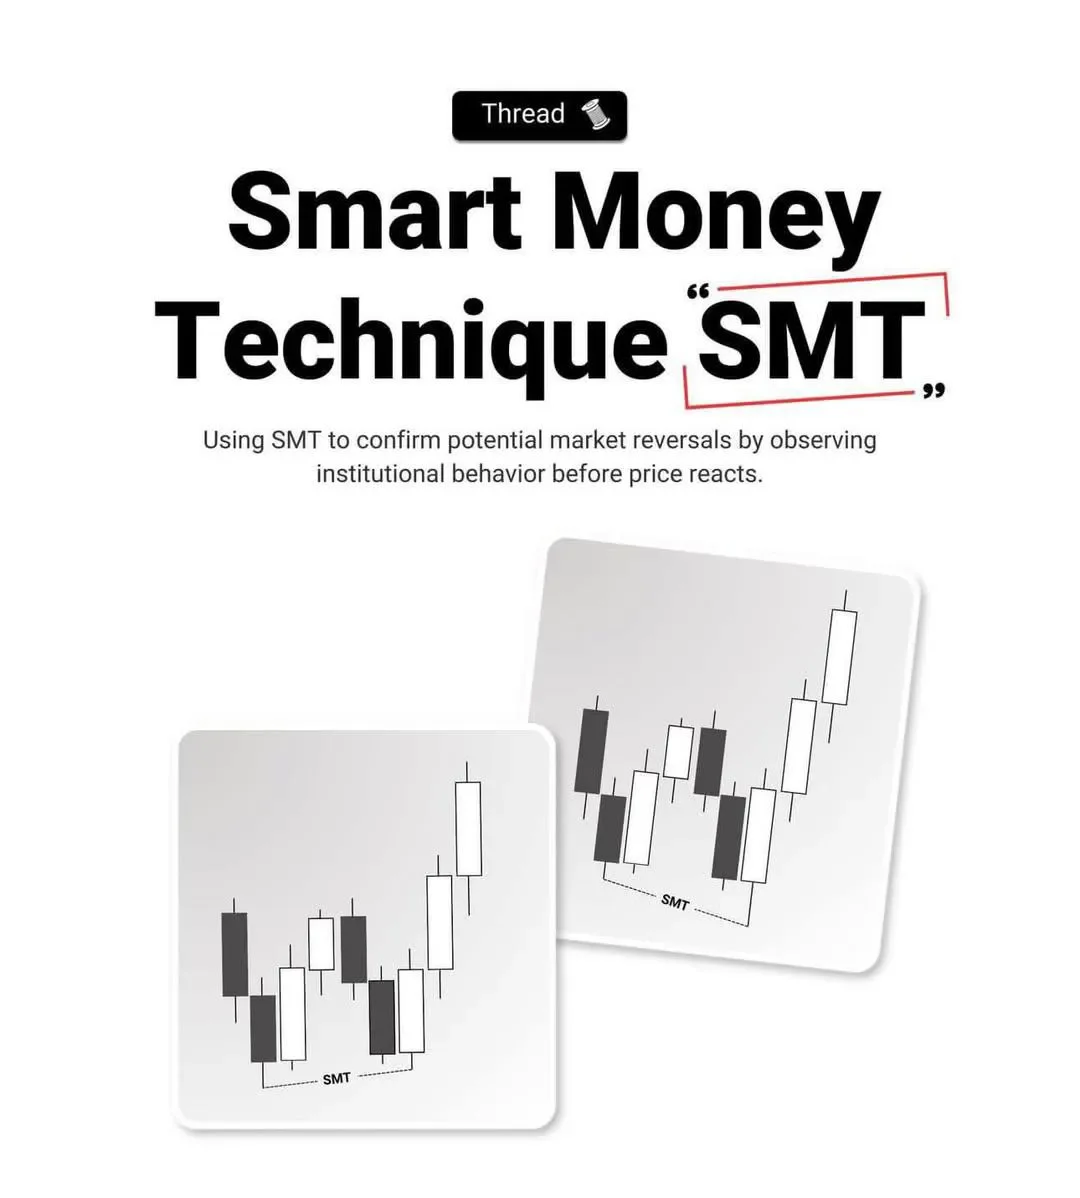
Smart Money Technique: Using Correlated Assets for Confirmation
Smart Money Technique SMT 📊 What is smt📊 Correlated Assets 📊 Types of smt📊 (1) Bearish SMT📊 SMT as confirmation Tool 📊

Rohit Srivastava Unveils 30-Year RMI Stock Strategy
30 Years of Market Secrets: Rohit Srivastava Reveals the RMI Strategy to Buy and Sell Stocks. https://t.co/PYmQeXXVFG
Follow Simple Rules, Not Genius, to Win Markets
The person who wins in the stock market isn’t the smartest one, but the one who follows the rules. 1 Morning surge → Sell all 2 Afternoon surge → Don’t chase 3 Morning plunge → Don’t sell 4 Afternoon plunge → Buying opportunity tomorrow 5...

Bitcoin Spikes in War, Crashes in Peace
$BTCUSD: -45% on no war $BTCUSD: +4.3% on war: The chaos hedge is working perfectly https://t.co/xUYlRbhtuw

Ensemble Gains 1.8% YTD, Outperforming S&P
Weekly Market Signals update. The ensemble is up 1.8% YTD, vs. -3.1% for $SPX. Read the free section for details. Link in reply below 👇 https://t.co/QvYPX44Oyr

EUR/USD Plummets 5% to Seven‑Month Low, Tests Support
Euro Technical Forecast: EUR/USD Crashes to Seven-Month Lows- 5% Drop Exposes Pivotal Support https://t.co/xPrn5Ir44G $EURUSD Monthly & Weekly Charts https://t.co/G3WNmBzkgW

Five Essential Moves for Traders During Corrections
Here are 5 Things Traders Should Do During a Correction ✅ Study Previous Market Leaders ✅ Review trades ✅ Update Rules ✅ Do a study ✅ Monitor RS & Markets I wrote a full article on this for 5,000+ traders Sign up here to get it today...
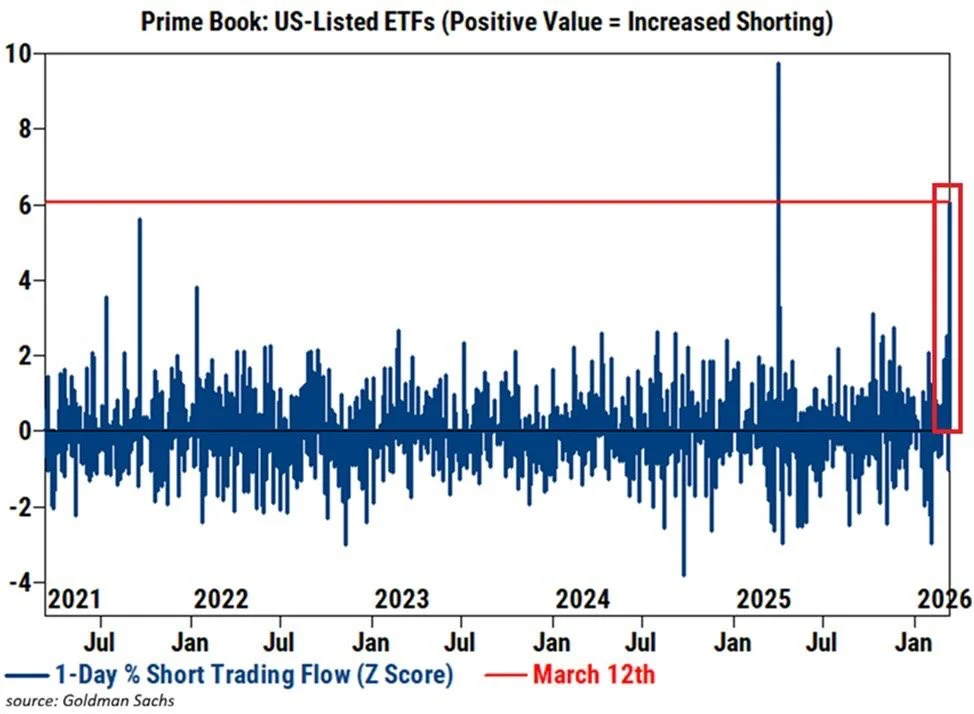
Record Hedge Fund Shorts Signal Imminent Squeeze
Bearish hedge fund positioning is extreme: Shorts in US-listed ETFs +10% Thursday—2nd-biggest daily jump since 2016 (only topped by +16% on April 2, 2025 “Liberation Day”). ETF shorts +12% this week (after +8% last), +23% in last month. US macro shorts (incl. index...

Underweight High Short‑Interest Stocks Generates Consistent Alpha
Short squeezes make headlines. But systematically underweighting stocks with elevated short interest (in a sector-neutral portfolio) continues to generate alpha. Notably, only ~4% of stocks across Wall Street carry a SELL rating. https://t.co/MI1AzbmeRF

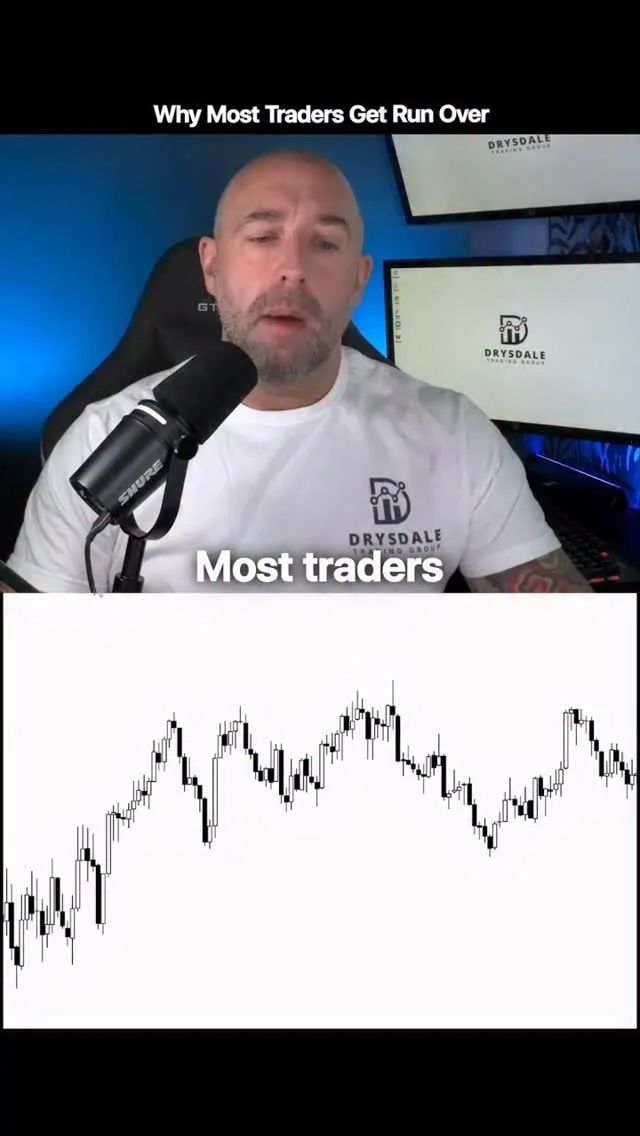
Micro Futures Simplify Trade Management Across Cleaner Markets
Most traders only trade Nasdaq or gold. But markets like Dow Jones, Russell, crude oil, and natural gas often move with cleaner trends. The futures ticker you trade, the volatility, and your position size all impact your results. Using micro futures and choosing...

S&P Breadth Drops Below 50%, Warning of Market Weakness
The S&P 500 is losing its breadth at both the stock and sector level, suggesting that the minor drop in the index year to date may be masking emerging weakness. The percent of stocks on the index that remain above their...
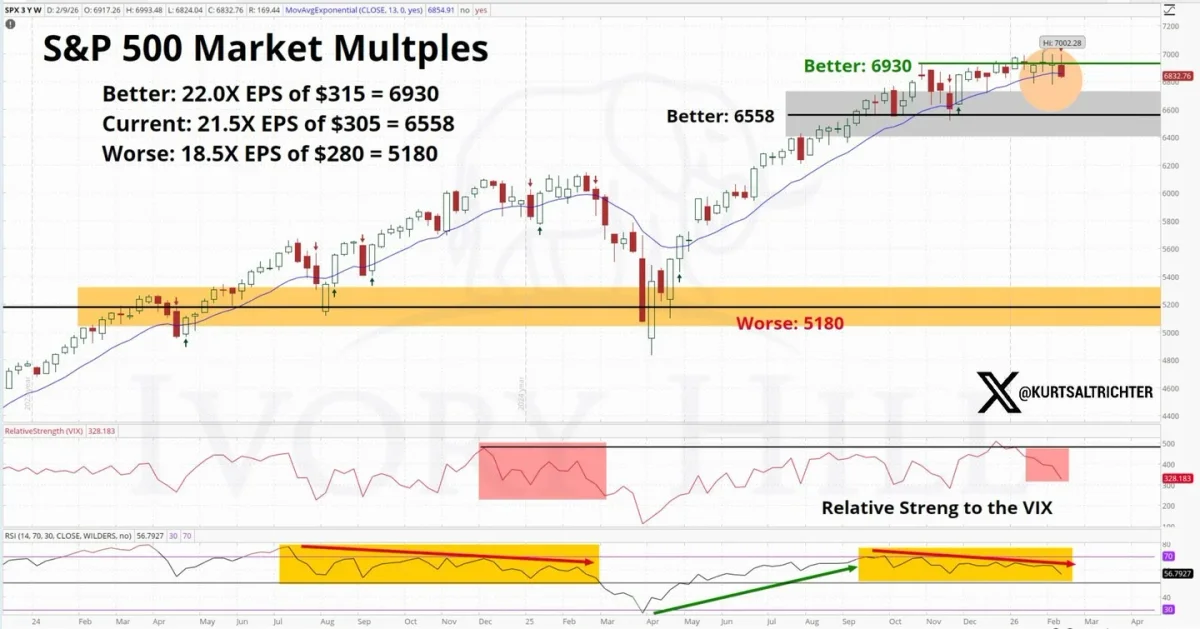
Technical Signals Warn of Potential 20‑25% Market Correction
Four technical signals today look almost identical to early March 2025, right before last spring’s $SPX selloff. The risk of a 20–25% correction is as high as it’s been in nearly a year. Counterpoint: fair value using $305 EPS at 21.5x...

Tech's Top Stock Stays Calm Despite Bearish RSI
$XLK - I don't like seeing the largest component of the market getting comfortable with it's RSI being in a bearish regime..... https://t.co/0TYPtYcK5X
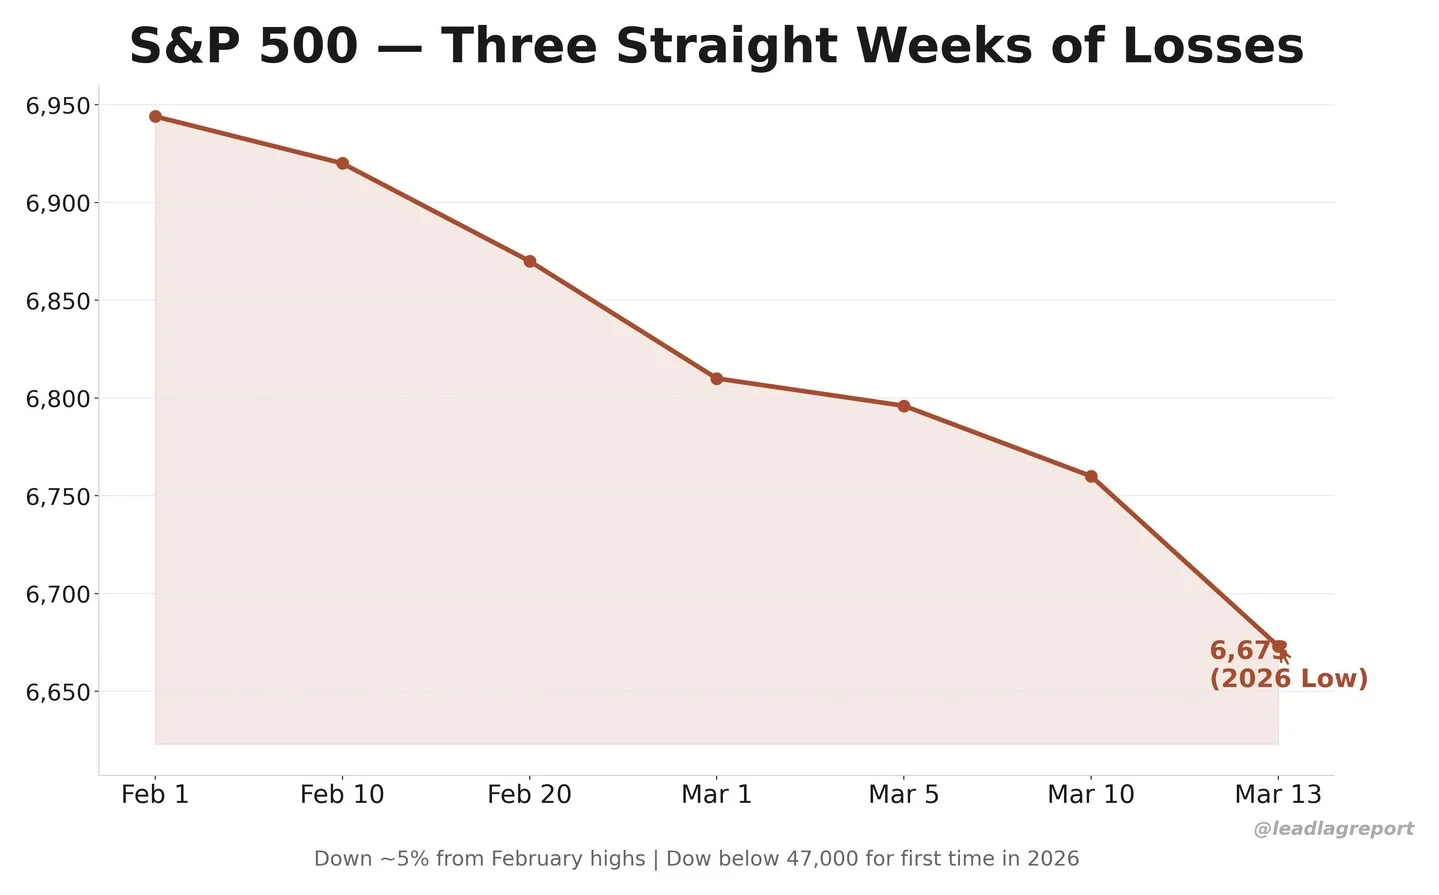
Market's Slow Grind Tests Patience, Not a Crash
Dow below 47K. S&P at 2026 lows. Three straight weekly losses. What concerns me isn't the level — it's the character. This isn't a crash. It's a slow grind lower that constantly tempts you to buy too early. The 2008 decline took...
Dragonfly Capital Predicts This Week's Market Direction
Dragonfly Capital - What to expect from the stock market this week https://t.co/xviZaGYVZ6 $SPY $IWM $QQQ $TLT $GLD and more
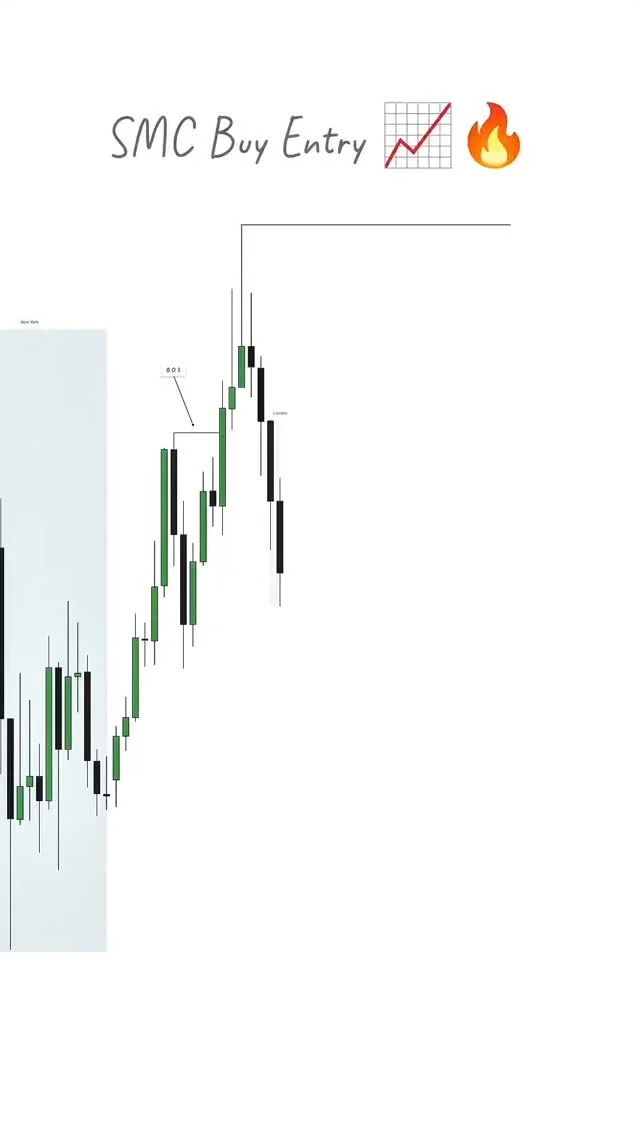
Patience, Structure, and Liquidity Drive Smart SMC Trades
Smart Money Concept (SMC) Buy Entry 📈🔥 Patience and precision create the best trades. This setup shows a clean SMC buy entry with confirmation from BOS, FVG, and Order Block, aligning perfectly with market structure. Understanding liquidity and waiting for the right moment...

Most Exited Positions Kept Falling After We Sold
Who gets you out? 14 of 15 positions that we exited since 2/27 continued to go down FURTHER after we exited them https://t.co/dXxme06N4C

Meta Reaches 100‑week MA, Announces 20% Workforce Cuts
$META hit its 100 week MA on Friday for the 3rd time since November. After the market close it announced that it was planning to cut 20% of its workforce. The vertical lines show the last 2 times it announced...

Short Software Stocks Amid CNBC Bottom Calls
Despite all attempts (by CNBC types who didn't get out of these stocks) to "call the bottom", we remain Short Software and names like $ADBE @HedgeyeComm https://t.co/Htn4Kkf5T0
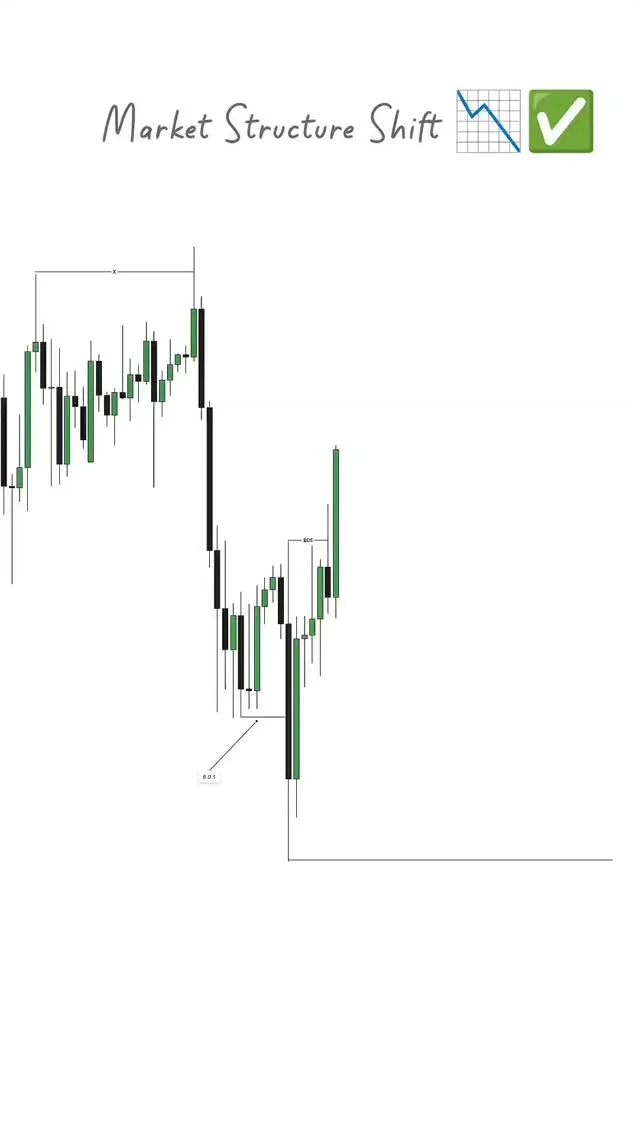
Wait for Market Structure Shift Before Entering Trades
Understanding Market Structure Shift Smart traders don’t chase the market — they wait for confirmation. A clear Market Structure Shift (MSS) signals when momentum changes and where smart money begins to take control. Mastering this concept helps traders identify high-probability entries instead of...

SPY Downtrend Confirmed by Weak Momentum and Breadth
$SPY - Sustained uptrends don't tend to see this weak of momentum AND breadth..... Another way to say it - the recent downside price action is being confirmed by momentum and breadth breakdown..... https://t.co/EykTASoZSL

XLP's Counterpunches Forming, Patience Required
$XLP - The counterpunches are setting up....just need to see them land...then we need follow through...it won't all happen in one day... https://t.co/ifxmmTsGDK

Big‑cap Declines Dwarf Oversold Breadth Signals
$MAGS - Those oversold breadth signals won't matter much for the S&P 500 if the big dawgs breakdown (more)..... https://t.co/fQaJD4av6D
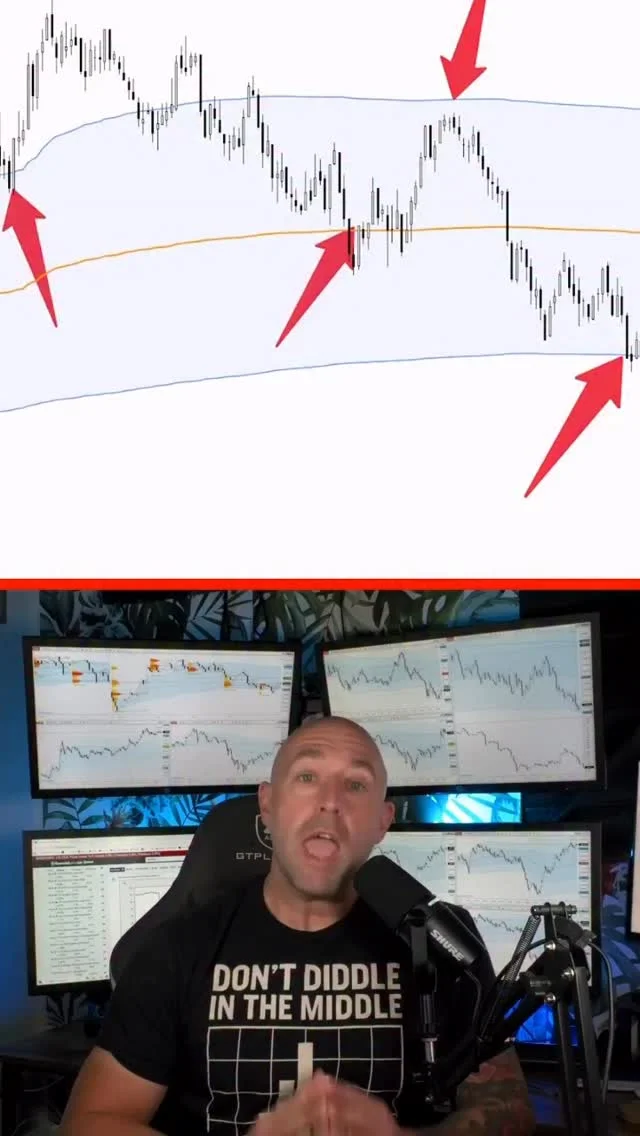
Price Wave Deviation Bands Reveal Market Regime, Guiding Trade
Most traders are told one thing: 📉 “Fade the extremes.” But when the market shifts into price discovery, that advice becomes dangerous. That’s exactly why we built the Price Wave Deviation Bands. They instantly show you whether the market is: ⚖️ Balanced (mean reversion) 🚀 Trending...

Bullish Patterns Faltering; Buttcorn Might Defy Trend
$IBIT - The vast majority of bullish patterns in the market are failing....we think Buttcorn is any different? https://t.co/v2yMsKEZXL

Oil Prices Set to Test 61.8% and 78.6% Retracements
$USOIL - Closed above the 50% retracement level on Friday. Next week it's headed to at least the 61.8% retracement level at 103 and possibly to the 78.6% retracement level at 110. https://t.co/vUmCz2yZlr

Amazon Faces Textbook Rejection; Bearish Technical Signals
$AMZN - Textbook rejection near the 200 day and ATH AVWAP coupled with RSI 50 chokeslam.... Not bullish.... https://t.co/4K3nbm9EM3

TLT Poised to Breach Feb Low, Eye Historic Lows
$TLT - In just 2 weeks it's back to the February low due to the Iran war. If it beaks the February low(86.43) we will likely see a retest of the 2025 low and maybe even the 2023 low. https://t.co/Mm9e0lX2JM
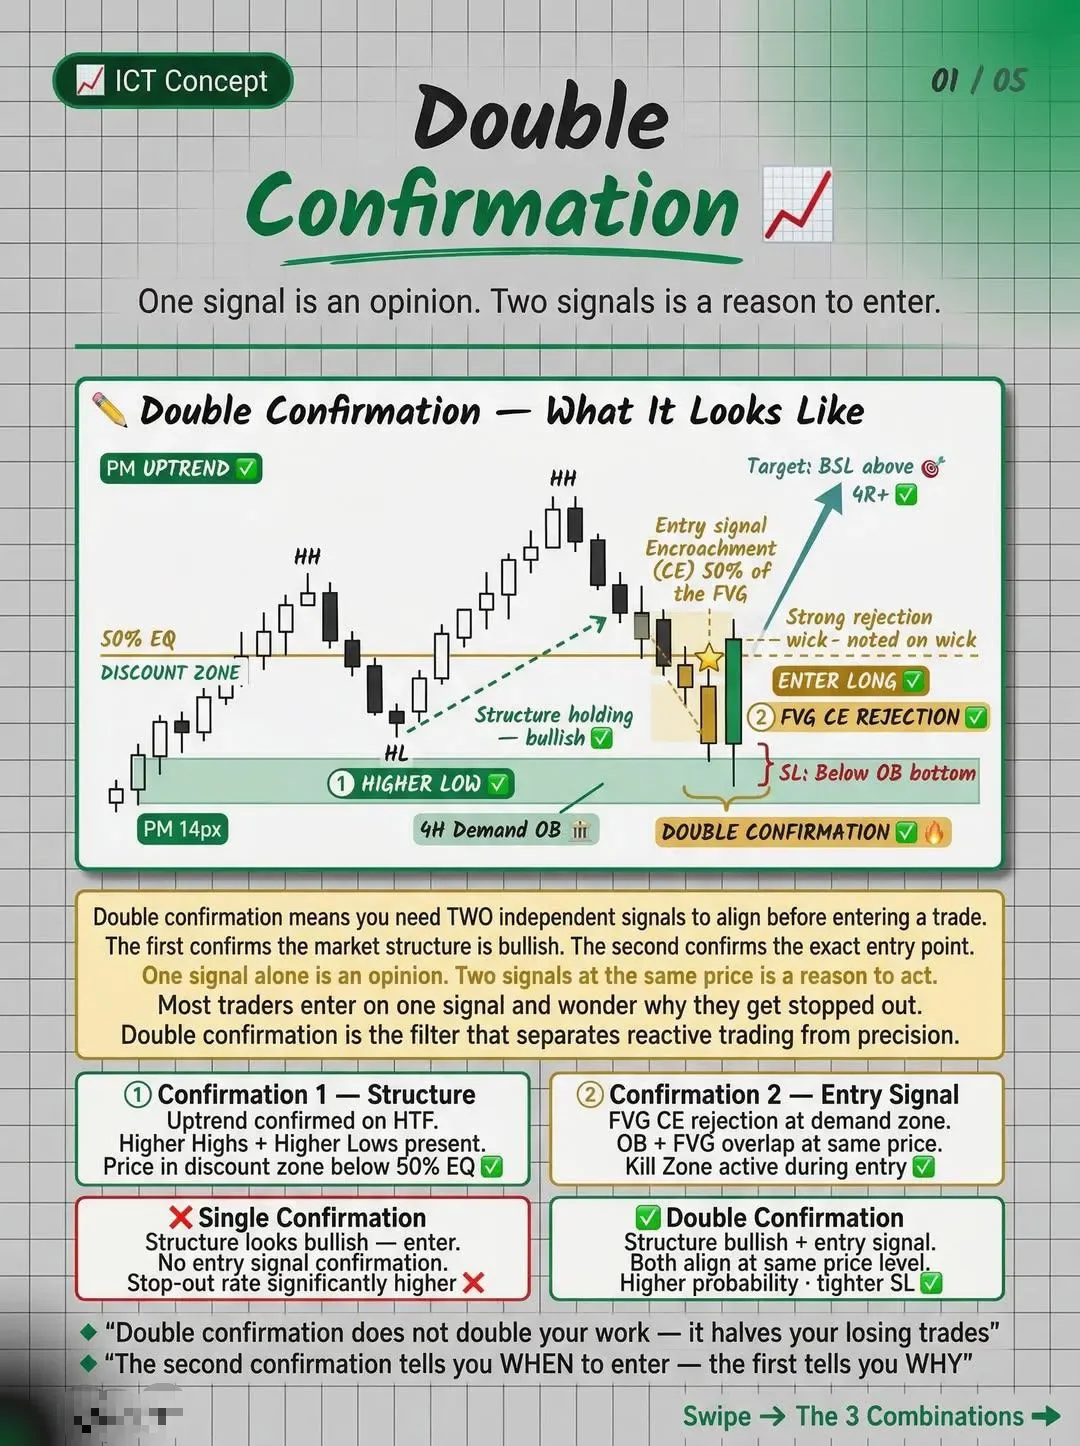
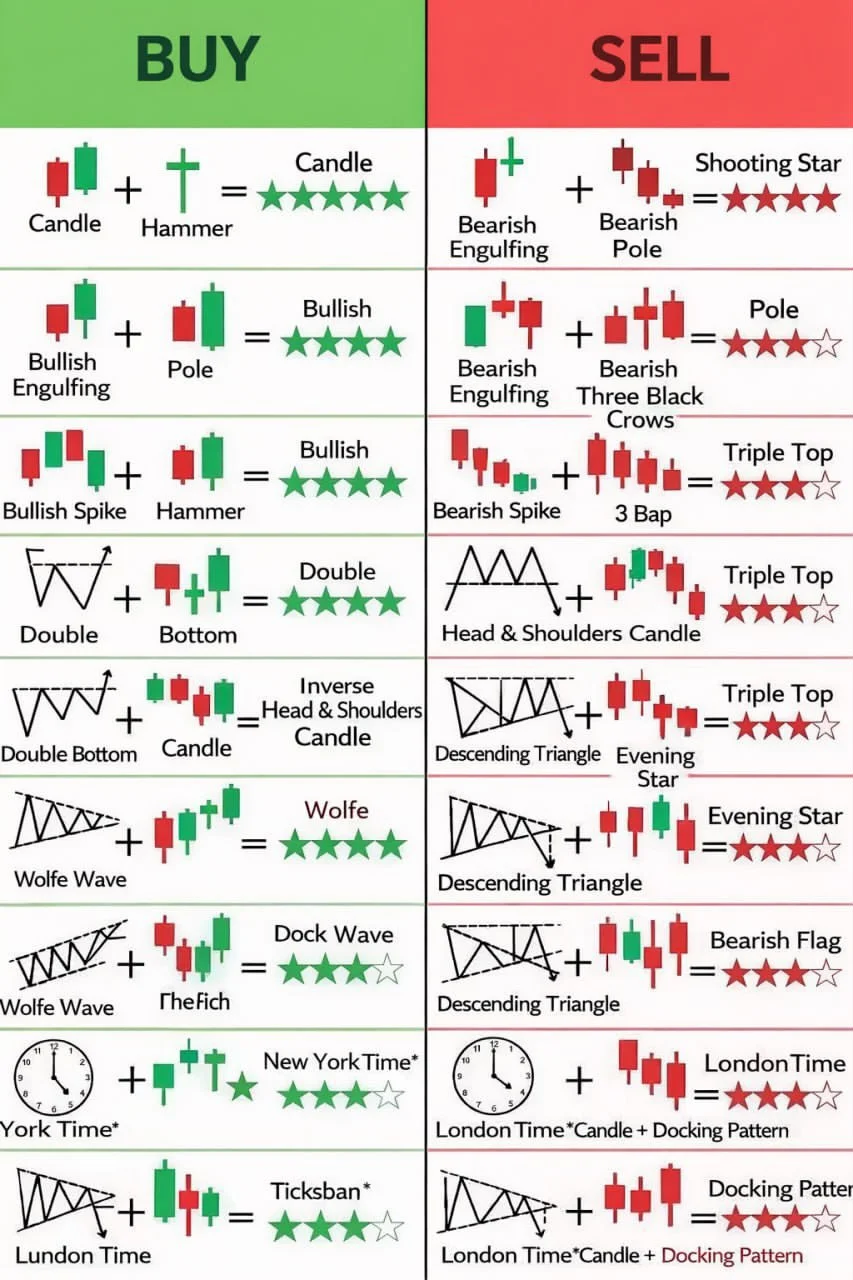
Master Double Confirmation: Top 3 Trading Combos
Double Confirmation📊 The 3 Best Combos 📊 Single vs Double Confirmation📊 Double Confirmation Checklist📊 The Ultimate complete Trading A to 2 , 📊

Data Says Patience; Trading Activity Can Mislead
The data dictates the posture. The work is still being done. I’m still reviewing hundreds of charts every week. Breadth, leadership, sector rotation, relative strength, all of it. But the message of what to do has changed. For some reason, people tend to equate...

S&P 500 Breadth Deteriorates, Stocks Lag Behind Index
S&P 500 breadth is terrible... (Market Breadth measures the performance gap between the S&P 500 Index and its median stock relative to their 52-week highs.) GS https://t.co/OLhF6yugXH