Sold ONDS Slice, +7% Profit; Awaiting Earnings Cushion
$ONDS ER next week. Sold a slice for shy of +7% on this group of common shares. Still own shares and need more cushion to put in let it ride or will sell before ER.

Biotech's Healthy Pullback Opens Entry Below $170
I've been slowly starting a position in $IBB toward the lower end of this range, under 170. Biotech as a group, has been digesting last year’s run-up in a pretty healthy fashion [so far]. Chart from @IBDinvestors MarketSurge (disclosure: long)....

If $CREG Holds $1.20‑$1.30, Expect $SXTC Surge
$CREG thought process ahead of time if $1.20-1.30 stays heavy = $SXTC @IUTraders 👇 https://t.co/rA96EsnqRf

Ubiquiti Rebounds, Targeting Breakout Above $800
Ubiquiti back to former highs after a 36% correction seen below on @IBDinvestors MarketSurge. I like the company fundamentals, price action is firm, now watching for breakout over 800 $UI #IBDPartner https://t.co/tD8wn5JWVz

Semiconductor Strength May Signal Tech's Next Move
do you think the relative strength out of semiconductors is an indication that Tech as a sector is going to hold these lows and move higher? Or is Tech going to break and the semis will follow? https://t.co/v4FDXOmBwQ

QQQ’s 40‑Week MA Predicts New Highs or 18% Drops
$QQQ - You can see the importance of the 40 week moving average. Going back to 2014 every time a multi week decline bottomed at the 40 week MA QQQ went on to make a new all time high. On...

Mag 7 Stocks Revert to 200‑WMA Amid RSI Diver
Seeing a lot of Mag 7 + $MSFT etc underperformance charts/comments out there Note we are now back at the 200 WMA. Not a rec, just highlighting not only the RSI divergence 6 mo ago but how the crowd tends to...

Hammer Pattern Signals FTSE100 Reversal After Seven Days
Starting to look like that Hammer from about 7 days ago has marked the turn on the #FTSE100 https://t.co/kufK73ap8s

Premarket OKLO Spike Fails, Short Opportunity Emerges
The $OKLO story this morning found its top premarket, when that happens and instantly fails the break it was a short til its not. Caught one reversion but reversed out for a scalp short. part of the caution is they...

Watch SPY Chart
$spy follow up chart as u need to be careful with prices and a names https://t.co/24whJKvUOz
CANSLIM Traders: Join Deepvue Webinar for Winning Screens
Are you a CANSLIM Trader interested in @Deepvue ? I'm hosting a webinar today👇 ✅ Chart Setup: RS Line, MAs.. ✅ Top Screen Presets for CANSLIM Traders ✅ Key Data Points: ROE, Fund Ownership... ✅ Find Leading Themes & Leading Stocks Register here👇 https://t.co/avvroag63w

VSAT Poised to Break Out of Recent Range
$VSAT on watch to move out of its recent range. Chart courtesy of @marketsurge @IBDinvestors #IBDPartner https://t.co/pq7iWhDviS

KRMN Poised for Breakout Beyond Recent Trading Range
$KRMN on watch to move out of its recent range. Chart courtesy of @marketsurge @IBDinvestors #IBDPartner https://t.co/23Hg3n3SCS

AAOI Reclaims 21‑Day EMA After Strong Earnings
$AAOI First visit to its 21-day EMA (green line on chart) since its strong earnings report. Chart courtesy of @marketsurge @IBDinvestors #IBDPartner https://t.co/QYZzLHNMoe

PLTR Reclaims 50‑Day MA, Investor Holds Position
$PLTR back over 50ma daily nice basing. Still own it here from a variety of purchases https://t.co/fJGyCH17fg

Netflix Holds 10‑EMA Base, Signals Unwinding
$NFLX continues to base along the 10ema and unwinding. Lots of simple education on this chart. Cover and follow left to right, top to bottom. https://t.co/rE5eqHNdEz

Avoid Earnings Trades; Favor Resilient Let‑It‑Ride Positions
I don't hold 'Trades' into earnings reports as it is 50-50 at best. I will hold 'Let It Rides' as they have lots of cushion and can handle pullbacks.

SPY Turns Constructive, Hits Target Above 200‑MA
$SPY getting a bit more constructive this week Sentiment washed out a bit Hit my 660 target nicely and basing type price-action above a rising 200-MA as NYMO hit extreme oversold Warned of the bearish RSI divergence into highs earlier this year, that...

Software IGV Shows Potential Higher Low This Week
There's that *potential* higher low in software $IGV. Still early in the week, let's see how this progresses. https://t.co/xVpU0JNgtS

Financials Edge Up, Testing Downtrend Line
It ain't much, but nice to see financials at least off the lows and attacking the downtrend line. One step at a time, but need to see more stabilization here. $XLF https://t.co/Zs3EOXIR56

ASTS Gains Momentum as RKLB Remains Un
Space is hot today. We don’t own the leader $RKLB. Maybe today’s close will give us the signal. But $ASTS is starting to firm up for us with a good look in the momentum book. https://t.co/QZBKwq6OHP

Fed Decision Drives Market Moves: Stock & Dollar Strategy
The Fed is about the move the markets - Here's the trading plan for stocks and the US dollar 👇 https://t.co/kWQkl5Peg1 #FOMC #Forex https://t.co/xIaWfeqjPc

AVAV May Bounce Above $220 Amid War‑Driven Demand
$AVAV Daily. Defense drones/satellites play should be doing better given Iran War. But so far putrid price action. Today gives hope for possible relief bounce above $220 https://t.co/RXv6tbWVjZ

Roku Shares Surge Amid $18 B Valuation Talk
$ROKU gapping up , getting some attention on this M&A piece mentioning $122 Roku could cost in the range of $18 billion or more

Buy DOCU Call
$DOCU "Trade Idea 2: Buy the March 47.50/48 Call Spread (95 cents) and sell the March 41.50 Put for 30 cents." sell to close call spread on any weakness, puts expire.

Nvidia's AI Boom Keeps Stock Range‑Bound; Avoid MU Earnings Risks
📺 RANGE COMPRESSION IN $NVDA, EARNINGS RISK IN $MU $NVDA raised its AI outlook to roughly $1 trillion in demand/revenue visibility through 2027, effectively doubling prior expectations and reinforcing the long-term AI bull case. Despite that, Nvidia is still range-bound and struggling...
Hopium Overload: Market Optimism Needs Reality Check
Based on the index charts that look like umbrella tops, there's a lot of hopium out there. Sentiment: Many may feel washed out, but the stream's sentiment feels like it's full of hopium. People are constantly posting and searching for positives. They've...

Short ETF Volume Hits Record, Sentiment Unilaterally Bearish
Volume in short ETFs is the highest ever. Awesome chart from @MacroCharts. Many clues out there that show sentiment is about as one-sided as we've ever seen.

Two Unfolding Paths Spotlight 6784.75 PD
SP 240 - 2 ways a b c can unfold. 6784.75 PDH most visible reference point. https://t.co/t5JcKQOngx

Take Profits, Embrace Happiness, Not Every Market Move
In trading, active management is key - you can have big targets, but you need to get out sometimes just in case. Taking money off the table, as we call it in our Mentorship program. That is why giving a...

New Signals Boost Momentum‑Mean Reversion Switching Strategy
Bonus momentum and mean-reversion switching strategy update with new signals. $TLT $GLD $TLT Link in reply below. 👇

TraderTVLIVE Returns; Nvidia Keynote Triggers Sell‑off, Oil Drags Market
After a little bit of a scare, @traderTVLIVE will be back on Youtube at 8am ready to Air. The $NVDA GTC keynote turned into sell the news while oil prices threaten to continue to give the market the blues....
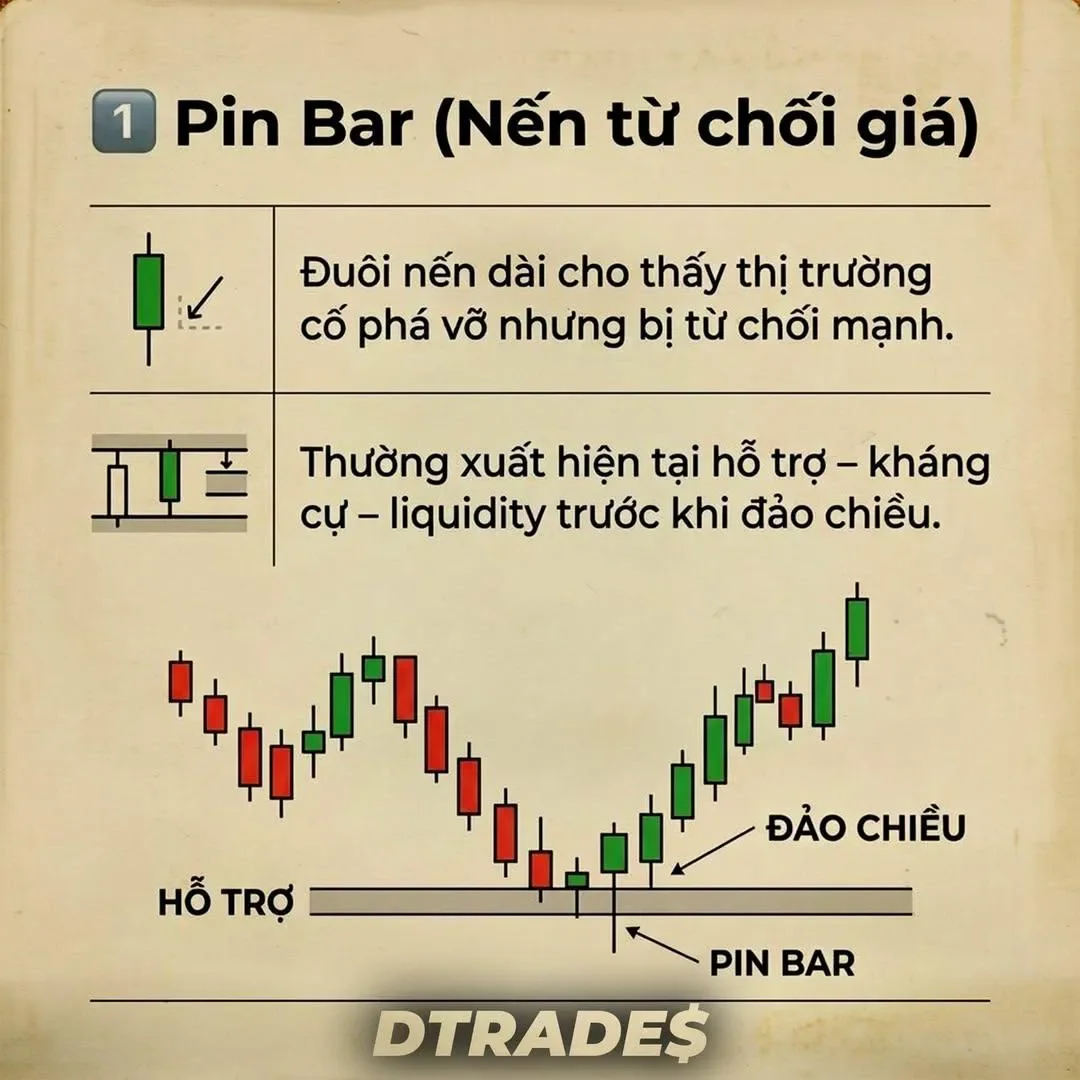
Key Candlestick Patterns Every Trader Should Know
1 Pin Bar (Nen tu choi gia) 📊 2 Engulfing (Nen nhan chim) 📊 3 Inside Bar Breakout📊 4 Fake pattern (Pha vo gia) 📊 5 Morning Star⭐/ Evening Star⭐ 📊 7 Long wick Rejection ( Rau nen cuc dai tu choi gia) 📊

Fast Moves Drain Liquidity; Slow Moves Build Orders
If price moves fast, liquidity is being taken. If price moves slow, orders are being built. Learn the difference.

Balaji Telefilms: High‑Volatility Play, Potential Multi‑Bagger
Current Market Price (CMP): ₹92.55 (NSE) | ₹92.00 (BSE) Balaji Telefilms: Multi-Bagger Potential or Short-Term Swing? 📈 Trending Potential: High Volatility / Pivot Watch [ balaji telefilms share, altt digital, indian media stocks, ekta kapoor stocks, small cap multibaggers, tv production stocks, nse...
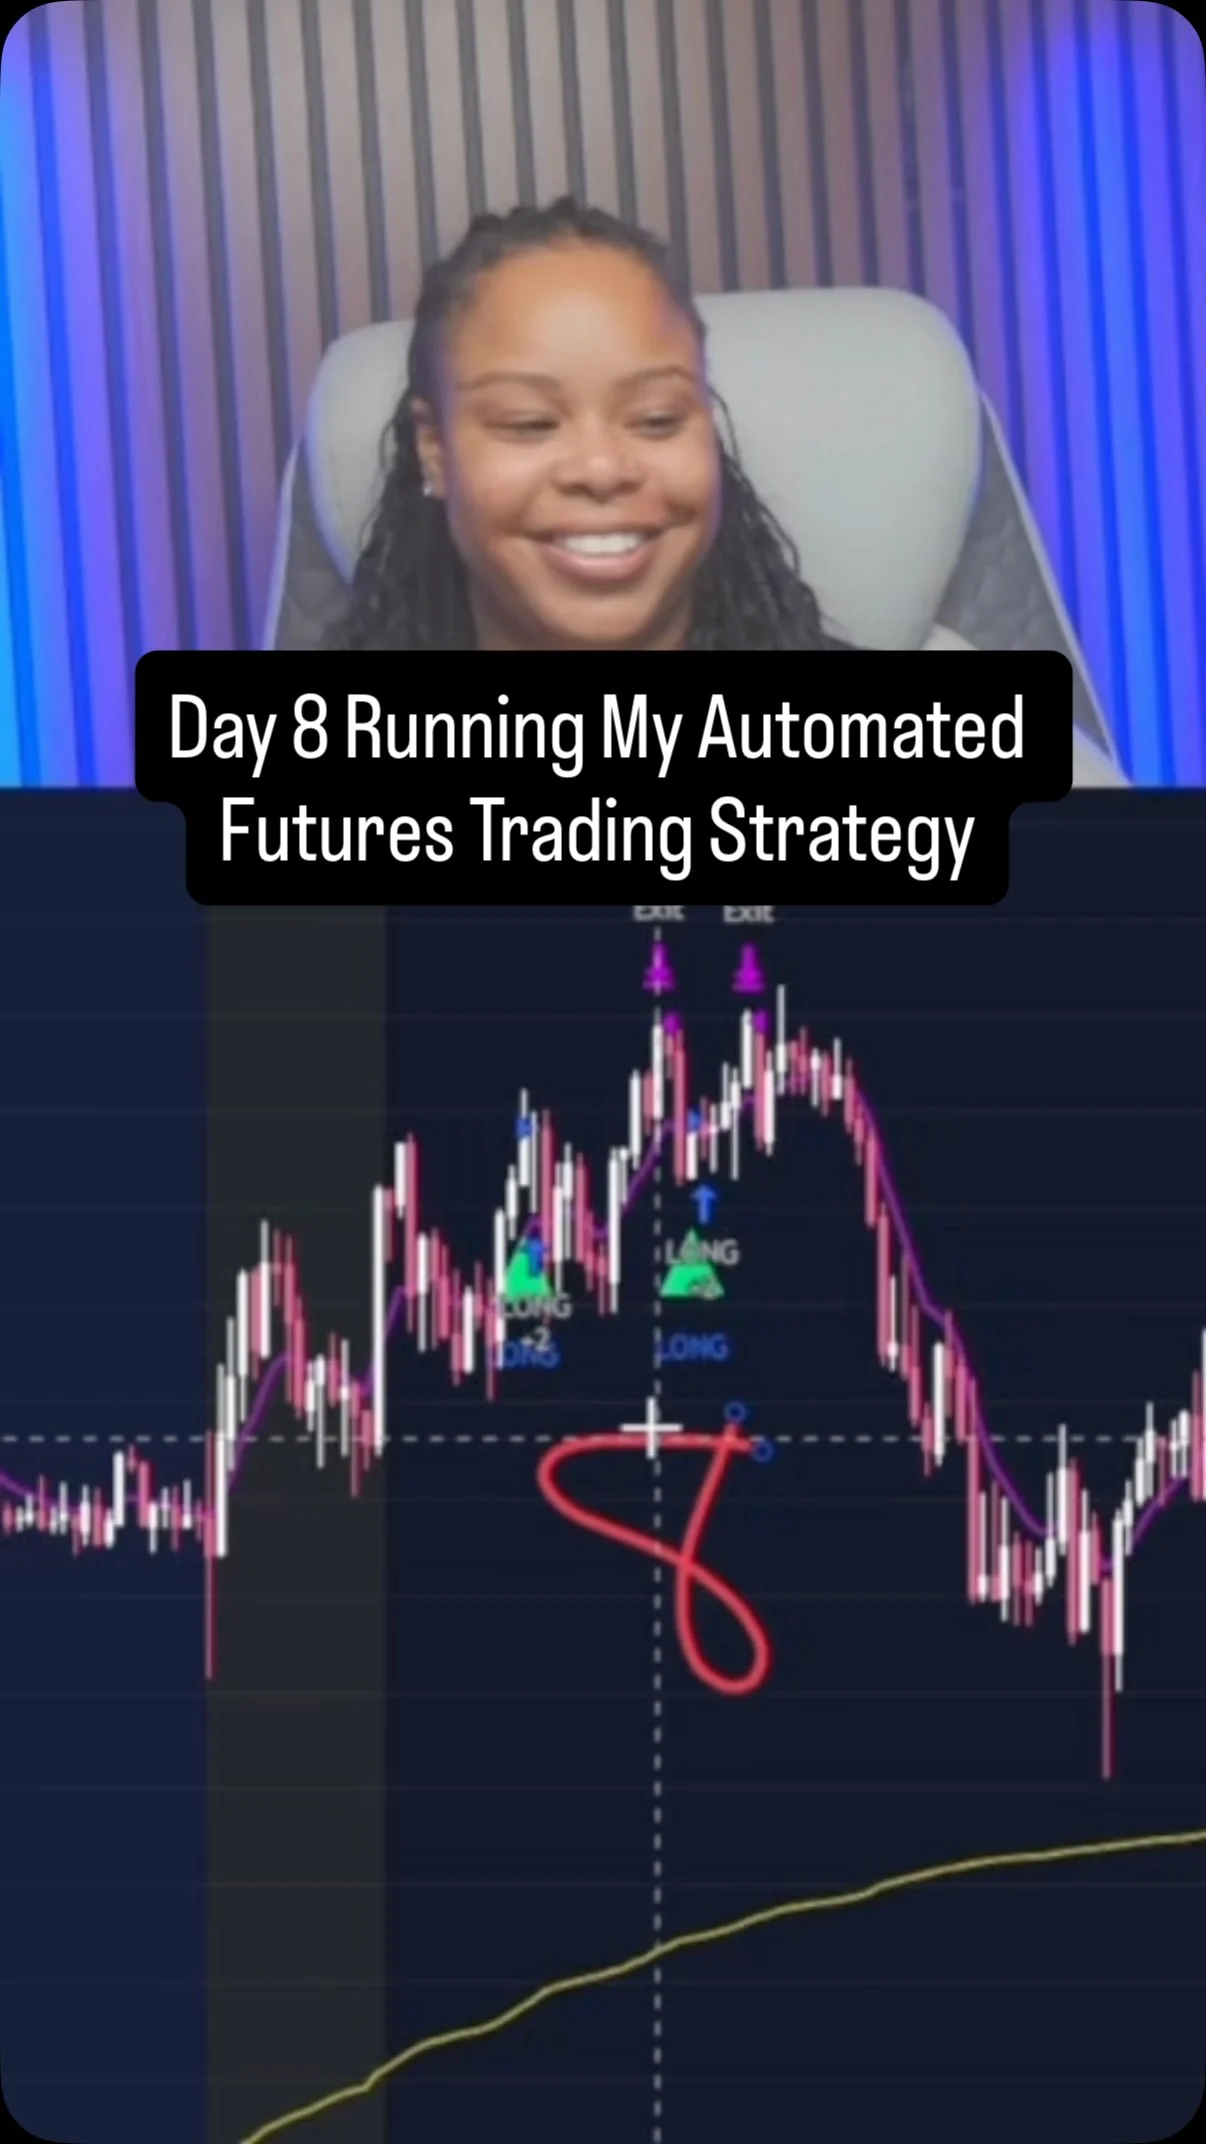
Scale Position Size with Volatility for Consistent Futures Trading
Day 8 running my automated trading strategy on Micro Nasdaq futures (MNQ). Two clean trades. Market was choppy, so position size was reduced to 2 MNQ contracts to control risk and stay consistent. Same rule based execution. Same entry confirmation. No overtrading. Adjusting position size based...

Oversold Market Signals Nearing S&P 200
Historically oversold market based on the McClellan Oscillator, right as the S&P 500 hits the upward sloping 200-day MA. https://t.co/TqybXrzkXG

Zweig Breadth Thrust Nears Red Line in Nine Days
Zweig Breadth Thrust watch. Can it get to the red line over the next nine days? https://t.co/vwblqtvrUm
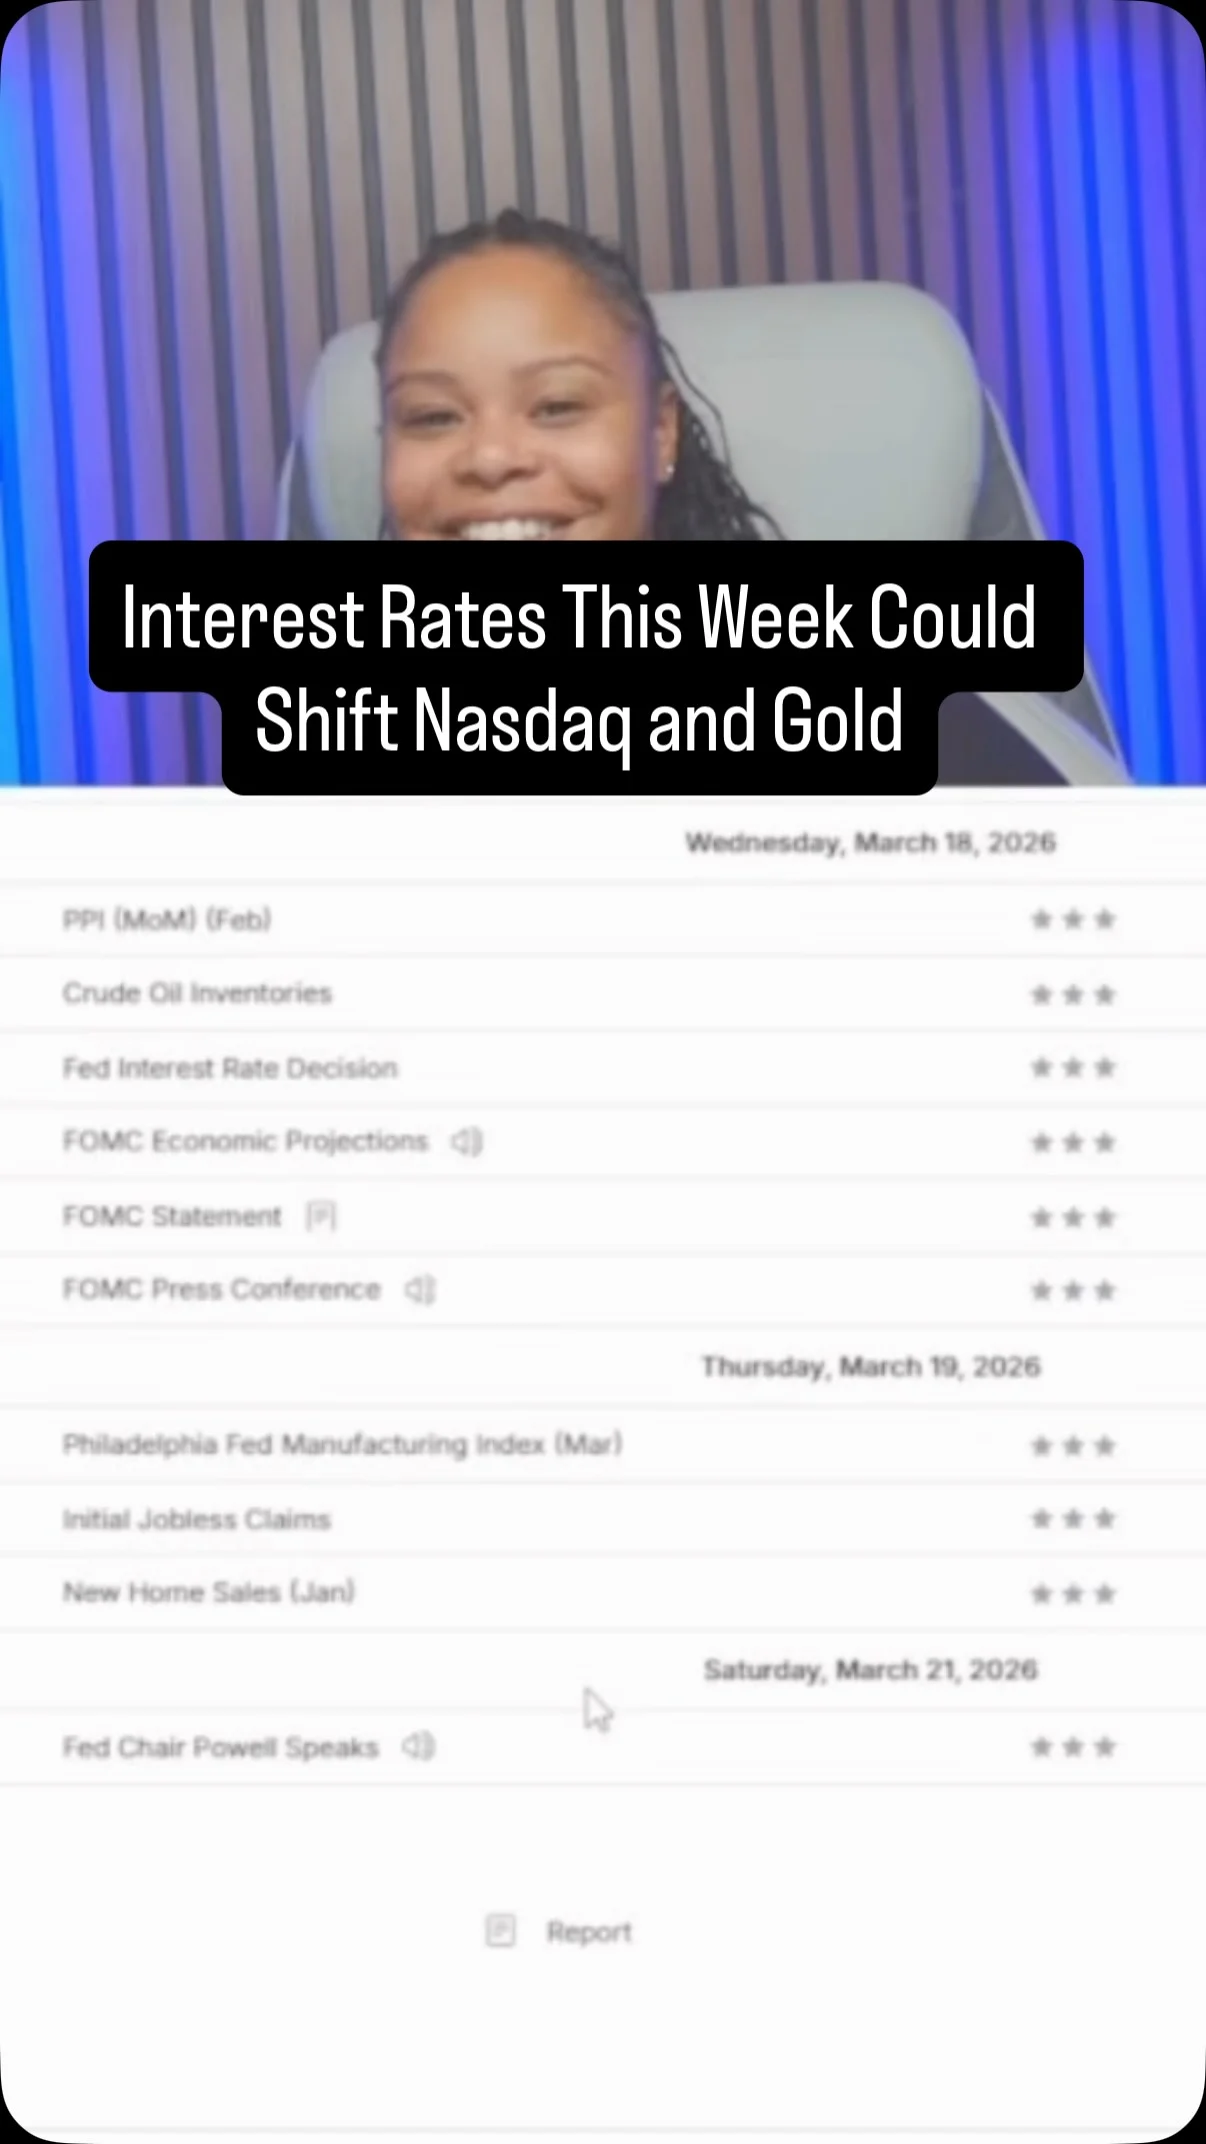
Trade FOMC: Align Timing, Levels, and Liquidity
FOMC is the biggest event this week. Interest rate decisions and Fed commentary can shift market direction, volatility, and momentum across Nasdaq and gold. Price often reacts aggressively around these releases, especially near key supply and demand levels. If you’re trading this week,...

Trade Daily Trend Flexibly: Bulls, Bears Profit
Good money to be made trading the trend for the day. Classic Taylor Trading Technique. It's OK to have longer-term bearish or bullish technicals, but know your style and stay flexible. With this chart, bulls make money, bears make...

Slow Line Poised to Dip Below Zero Soon
Good odds this "slow line" on the weekly osc will drop below zero. getting closer.... https://t.co/xkXLjyapcb

Key Indices Breach 5‑SMA, Then Resume Steep Declines
Rus, SP, Naz and DOW: All got look above 5 SMA, but could not hold. SP, Rus and DOW remain on extended runs DOWN. https://t.co/3ZBu6MNk9F
Pinball Flips:
Pinball Sells in SP DOW NAZ Bonds EC Peso and Pinball Buys in CL W $ and CL. markets batting `100% in Asia session. "Turnaround Tuesday" kicking in.
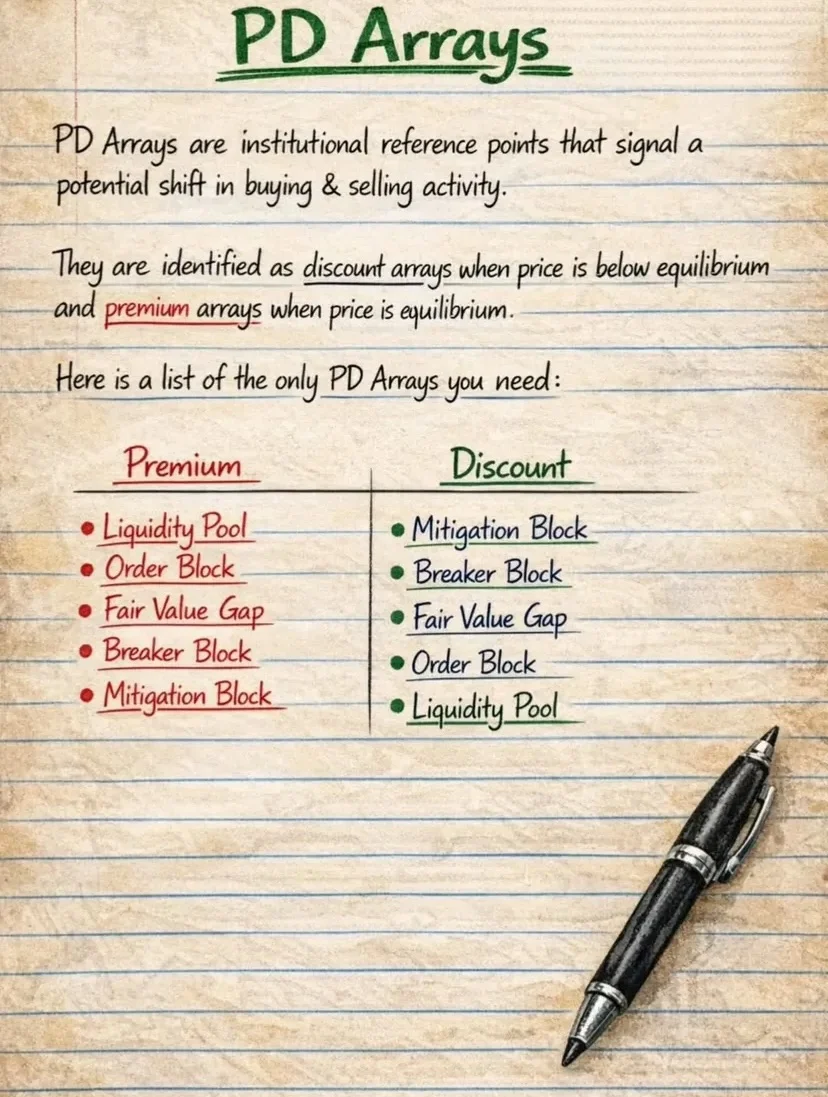
Key PD Array Blocks Every Trader Should Know
PD Arrays📊 1 Mitigation Block📊 2 Breaker Block📊 3 Fair Value GAP (FVG) 📊 4 Orderblock📊 5 Liquidity Pools 📊

NVDA Holds 180 Zone, Eyes 168 Support
$NVDA steady in the correction -- hugging 180 zone for 7 months. If market gets legs we like this one, and if market pulls back, then 168 support potential reversal long https://t.co/LpCUhBi2ax

Bitcoin Nears YTD VWAP, Signals Supply Pressure
Closing in on the 🟠YTD ⚓️VWAP for #Bitcoin after punching thru the 🔴AVWAP from the 2026 high on its third attempt. The YTD AVWAP is a level of interest that has the potential to offer supply which means tighten stops on...

VIX Plummets Despite Modest S&P Rise, Showing Over‑VIXing
$VIX had to come down with a 1% gain in $SPX. 3.7 points is a big drop for a 1% change, but we've been over-vixxing for a while now, as shown in the second chart. https://t.co/OV1trbLQxV

212-Day 200‑Day MA Streak Signals Quick Recovery
To clarify - the S&P 500 has closed above its 200-day for 212 straight days. There have been 28 other such streaks. In 71% of the cases when it broke below the average after a streak this long it...

SPX Stabilizes; Watch for Looming Big Short
SPX $6630 hit Friday target & we bounced on cue into a 'stabilizing week' ahead of VIX expiration, MU earnings, FOMC, BOJ & month end OpEx. Even chasing $CAVA, swing long $JD & trend long $AA from live trading room. But be...

Starbucks Bull Pennant Breakout Likely to Retrace Fully
$SBUX Yeah why wouldn't that bull pennant breakout pump full retrace... this market is whack. https://t.co/9HGI4W4adc