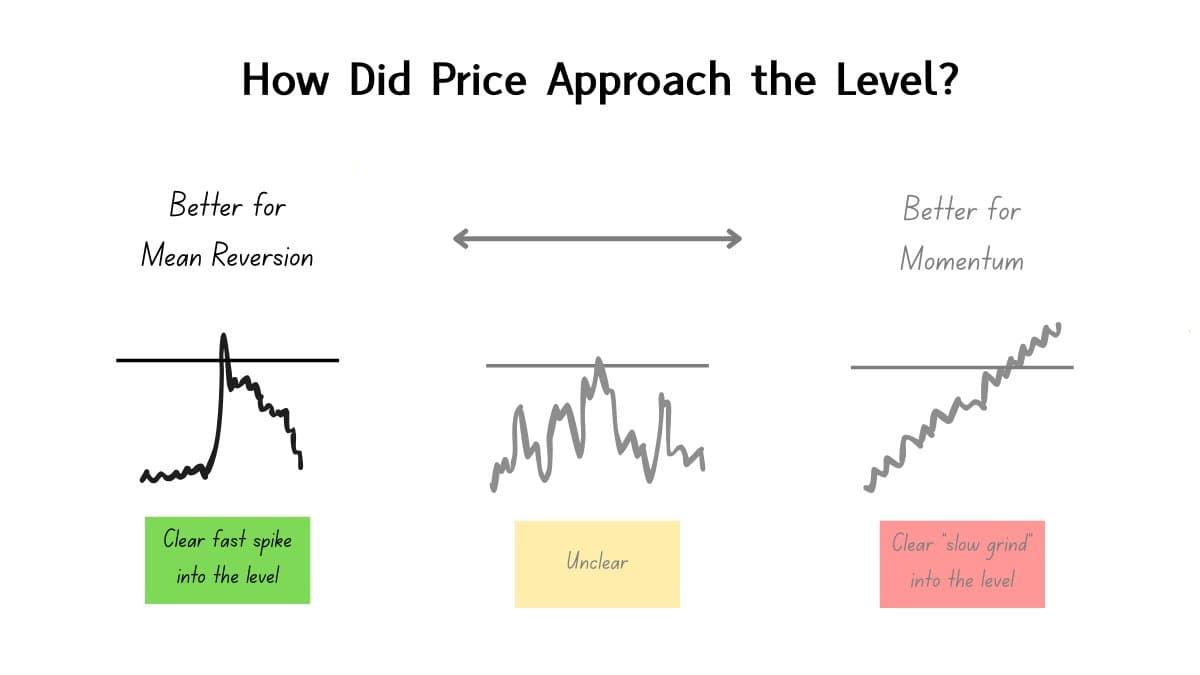
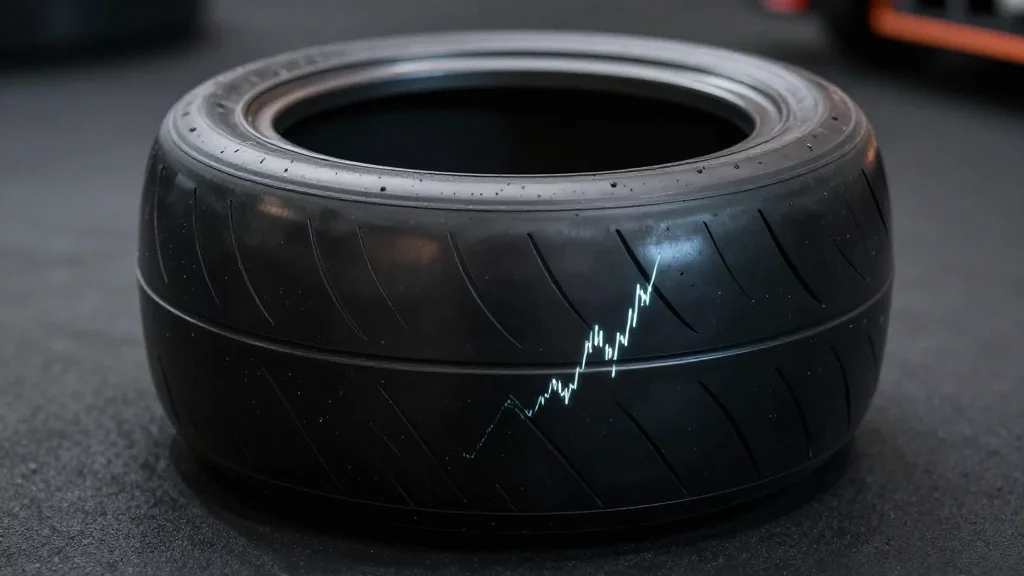
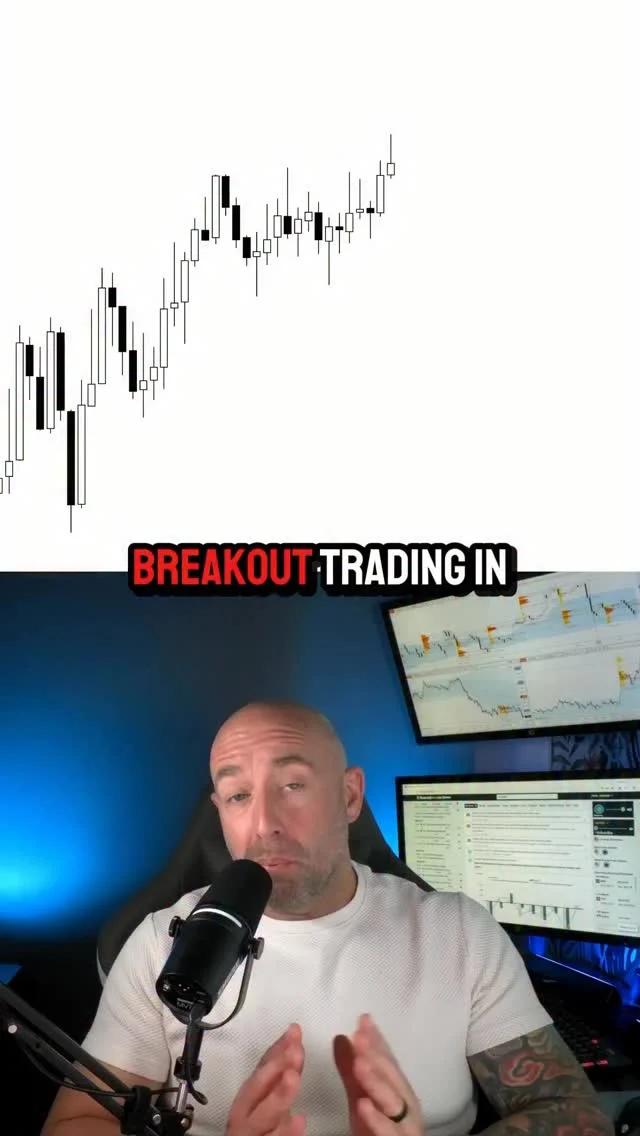
Fast Spikes Signal Reversal, Not Breakout Confirmation
Fast Spike Pattern this is a trading pattern that actually works for reversals. i'll explain. price can only do 2 things at a key level. break or reverse. our job as traders is to assign probabilities to each scenario and then place bets. This pattern, gives me good odds for reversals. The logic is simple - A sudden spike is the WORST thing I can see for my breakouts. When trading breakouts I want slow stready rise in price showing a stable buyer base. (proof price will 'stay up') A fast spike give me very little proof that price will ('stay up') Don't take my word for it. Test it with a small portfolio, see how it performs. My favorite pattern for trading reversals ↓
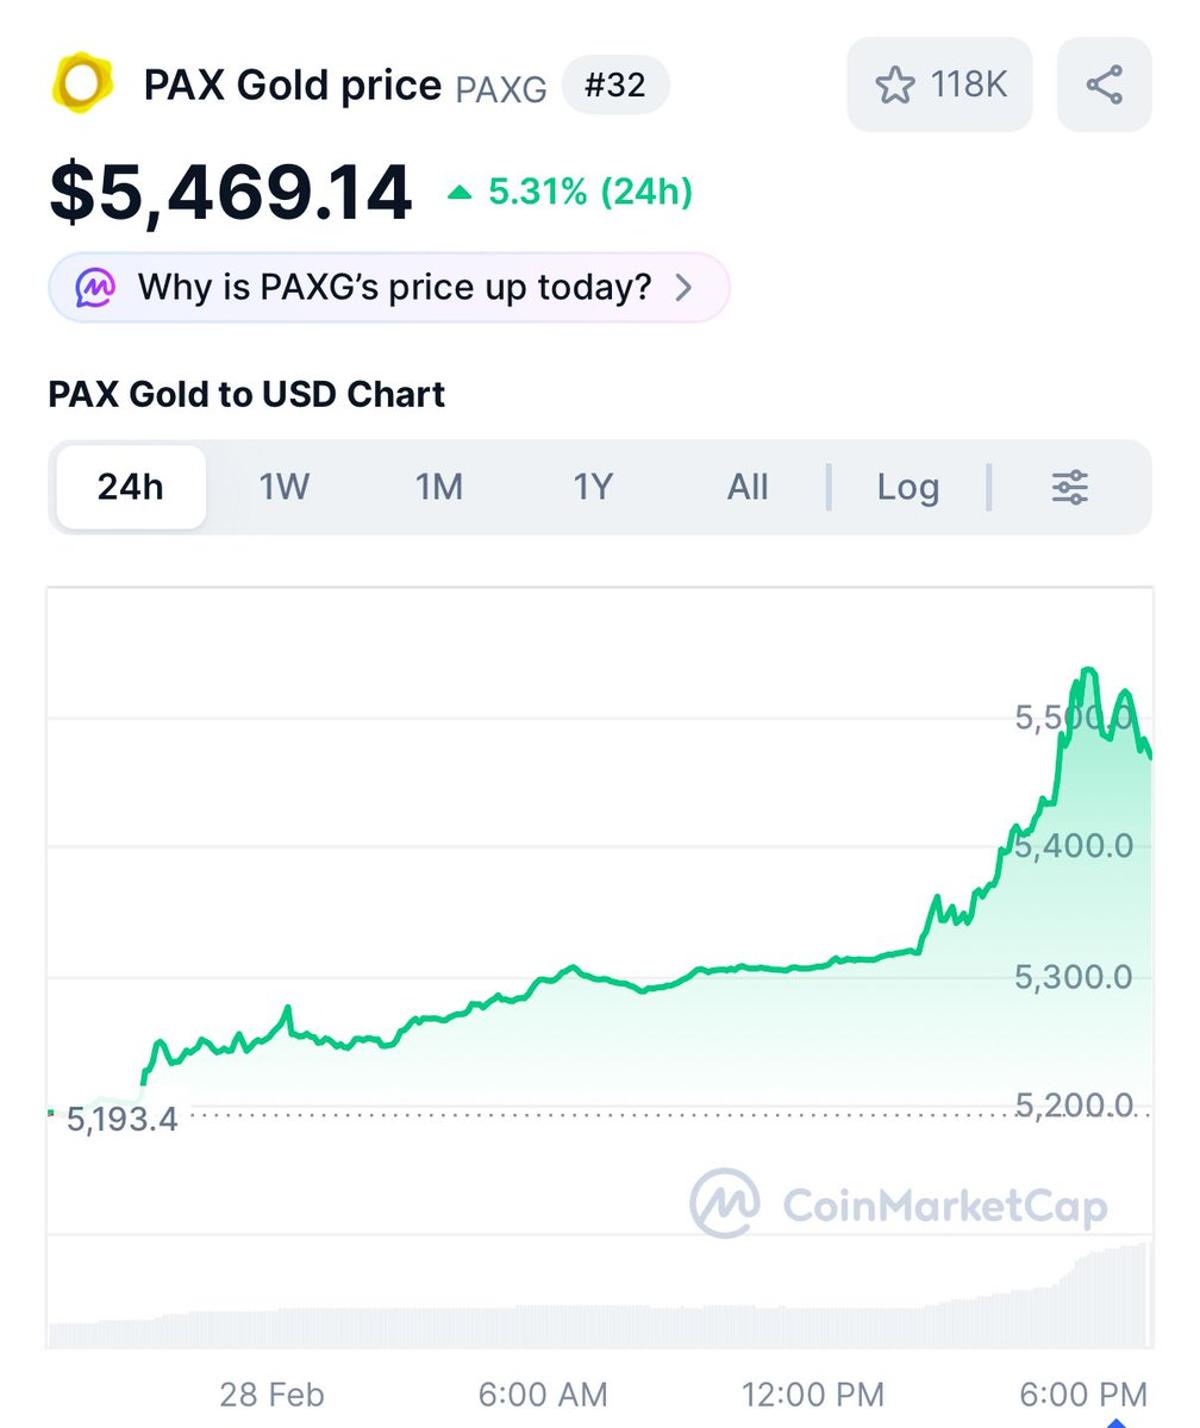
PAX Gold Surges Past $5,500 as Spot Gold Nears Record
PAX Gold up about $200-250 today from the close of spot gold on Friday. At one point was north of $5,500. Plausible spot gold retests all-time highs early Monday https://t.co/dFRK76xspa
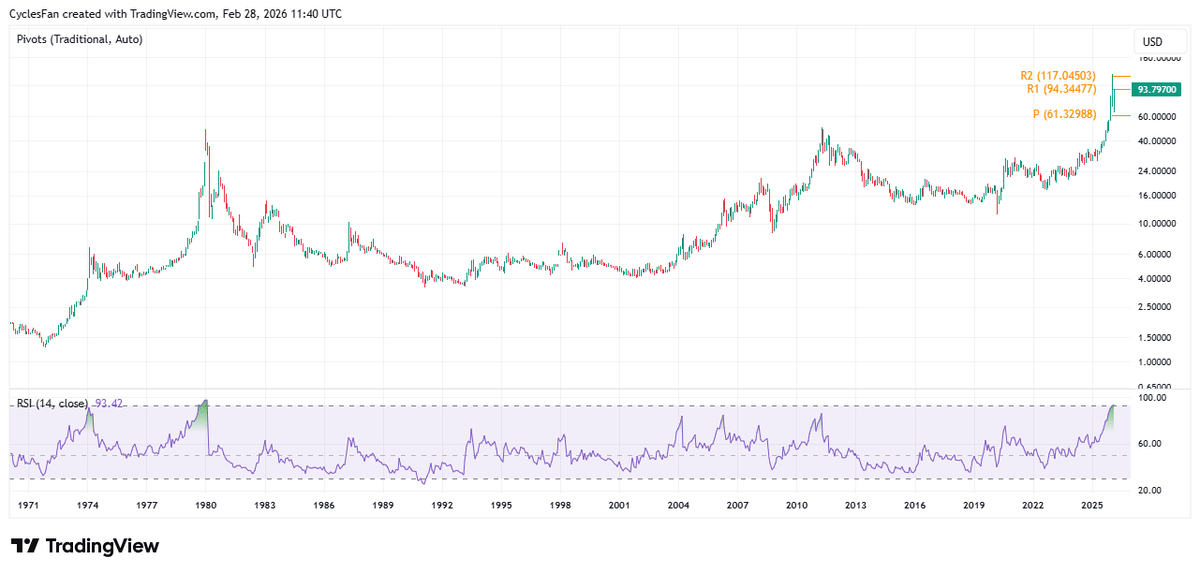
Silver RSI Near 1980 Peak, May Surge Past 94
$Silver - Despite the 40% drawdown from the January high, February was the 10th up month in a row, which never happened before. The 14 month RSI is now at 93.42, its highest level since the 1980 top. My expectation...
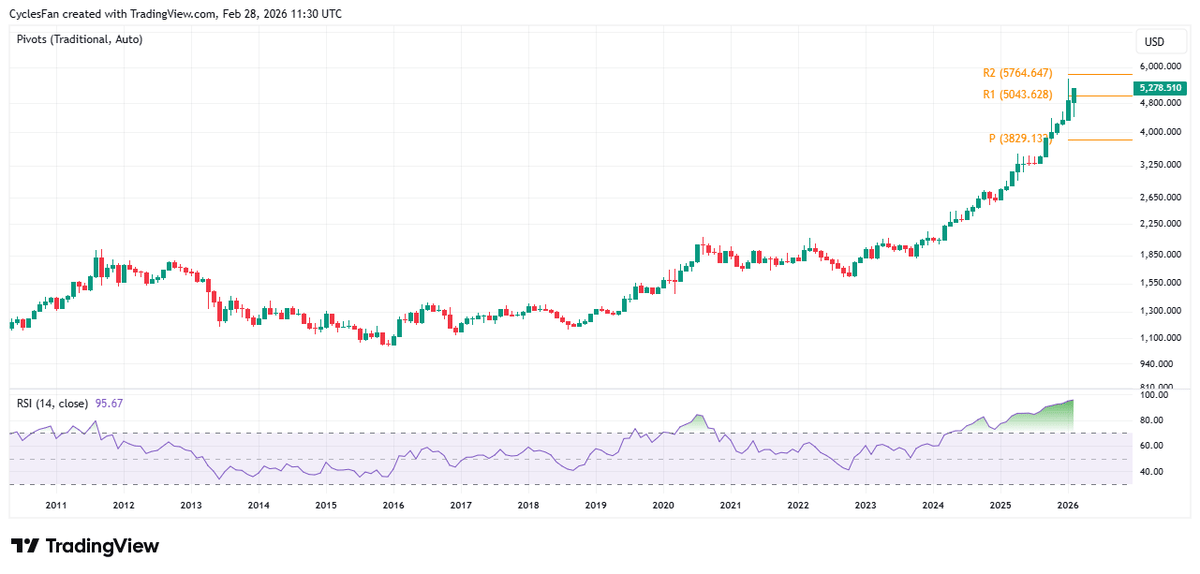
Gold Breaks Yearly Resistance, Targets 5764 Despite Record RSI
$Gold - The 14 month RSI closed at 95.67, its highest level in history, but it probably doesn't matter since gold closed the month above the 1st yearly resistance at 5043, and is headed to the 2nd yearly resistance at...
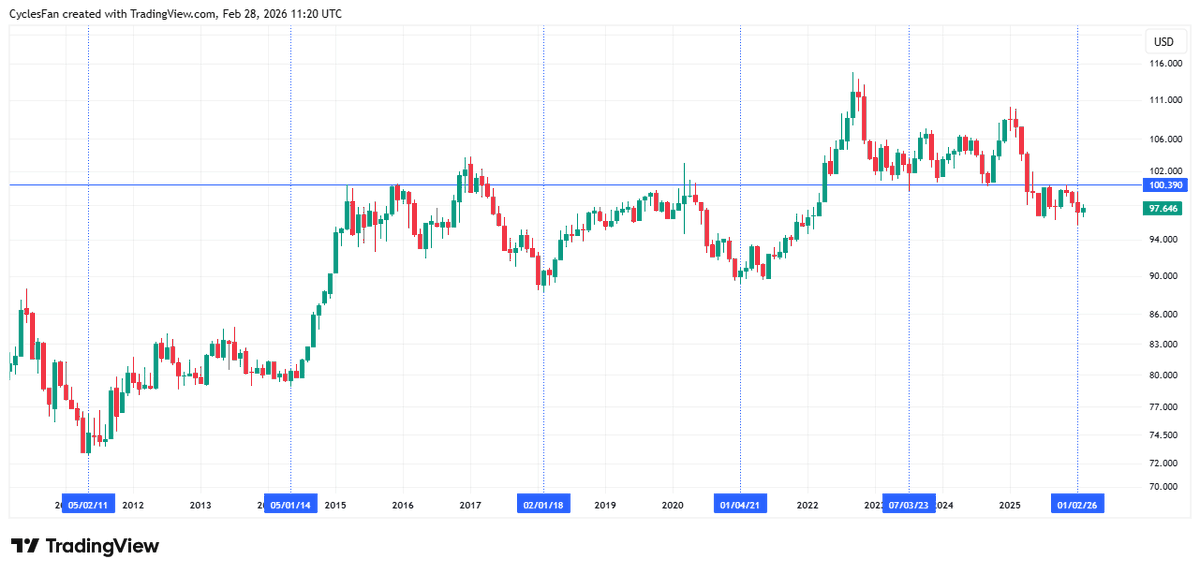
DXY Near 3‑Year Low, Breakout Needed for Confirmation
$DXY - Potentially made a 3 year cycle low in January. February was only a small up month so it's not confirmed yet. A breakout above 100.39 is needed to confirm that the 3 year cycle low is in. A...
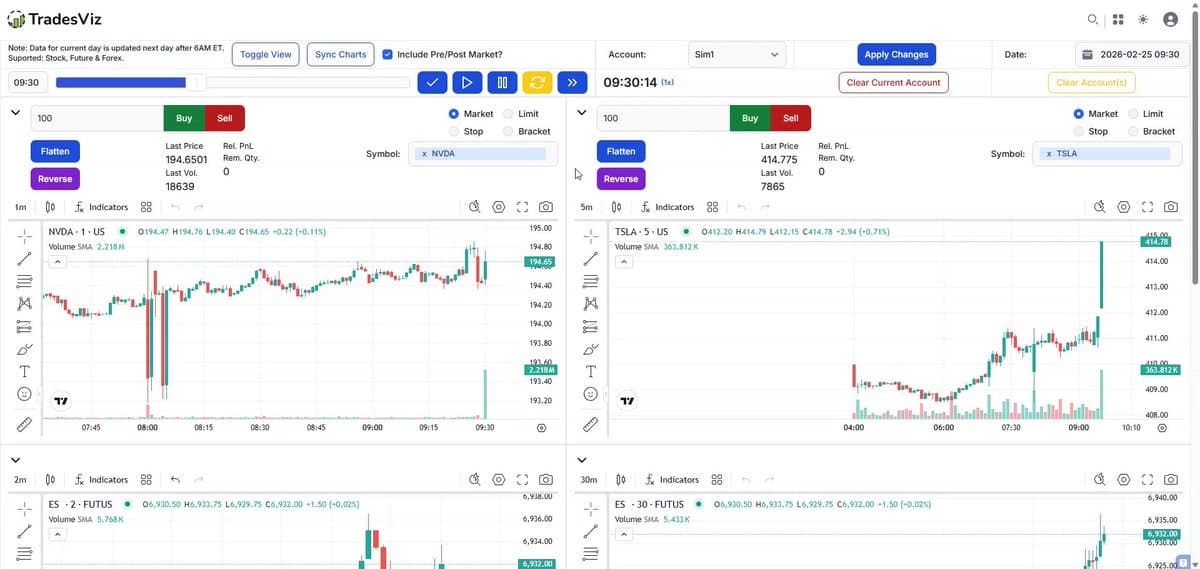
Speed Over Screen: Practice Multi‑Ticker Simulations Daily
Trading multiple tickers isn't about screen space; it's about processing speed. 🧠⚡ Weekend multi-sim practice on @tradesviz Journal+Simulator is mandatory to keep that mental muscle memory sharp. Staring at static charts doesn't train your brain to find live correlations or manage cognitive...
Prefer Horizontal Trendline Breakouts Over Discretionary Diagonals
It’s better to focus on horizontal trendline breakouts rather than diagonal trendline breakouts. Diagonal lines are too discretionary while horizontal lines are more quantifiable.
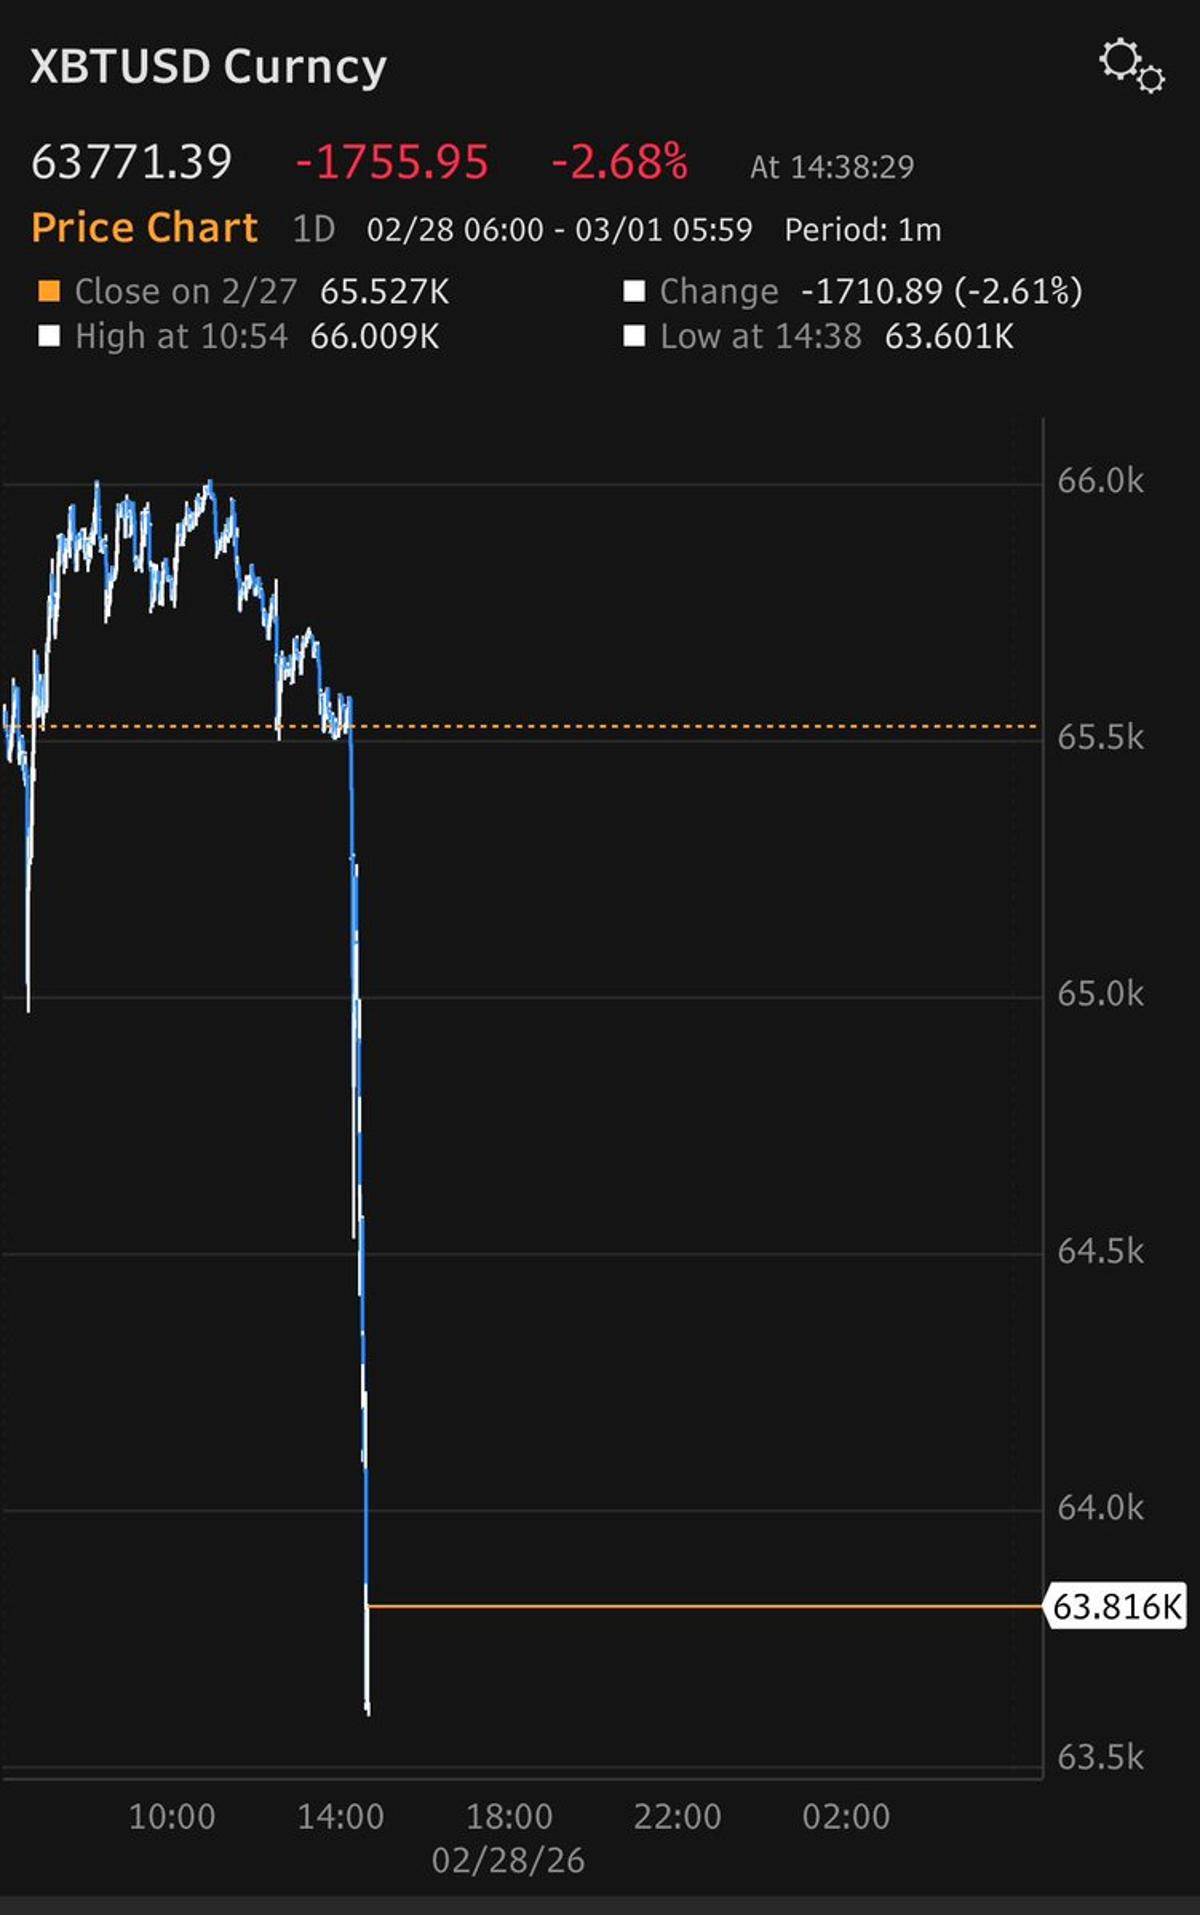
Bitcoin Slides as Israel Strikes Iran, Weekend Geopolitics
Bitcoin tanking Saturday. Timing of drop suggests geopols related. Very few things trade on the weekend Israel strikes Iran https://t.co/kYR9NQU8Zl https://t.co/MXytvDYDHh

Bull Market Over: Avoid Dips, Stay Hedged
The Bull Market has ended - Do not buy the Dip - HDFC Bank vs SBI - Gold... https://t.co/bamrgqUR9n via @YouTube The Nifty broke key levels this week, further confirming the bearish case. We will go level by level and...
Simplify Trading: Small Positions, Fewer Trades Boost PnL
🌟 5 things that instantly improved my PnL: – smaller positions – fewer trades – no mobile trading – predefined invalidation – less screen time
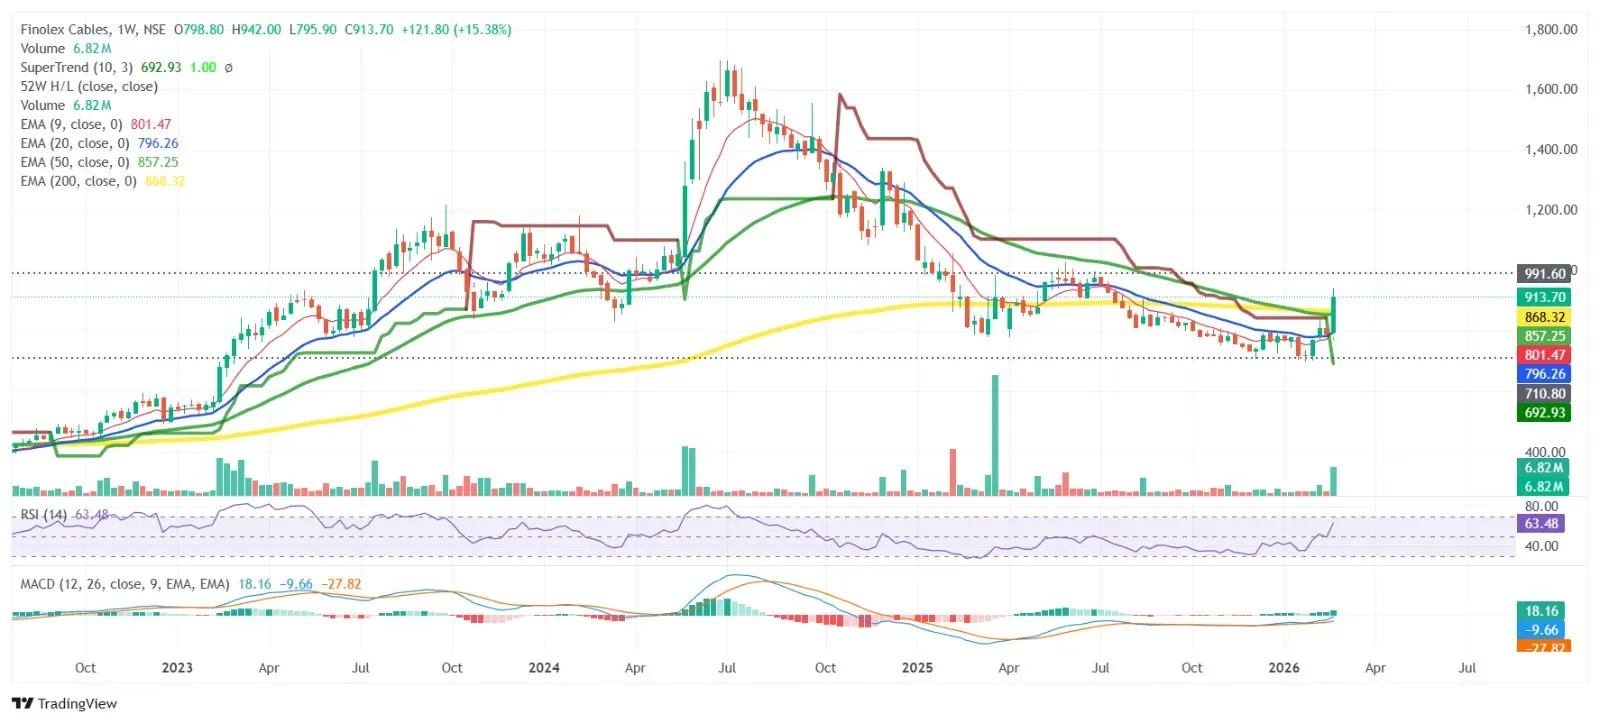
Finolex Cables Breakout Near Golden Crossover
Finolex Cables CMP:913 – Weekly TA - Strong breakout from consolidation with volume expansion. - Reclaimed key moving averages; trading above long-term average. - Near Golden Crossover, signaling possible trend shift. - RSI bullish; MACD positive crossover. Keep on watchlist Don't miss out, Join my free...
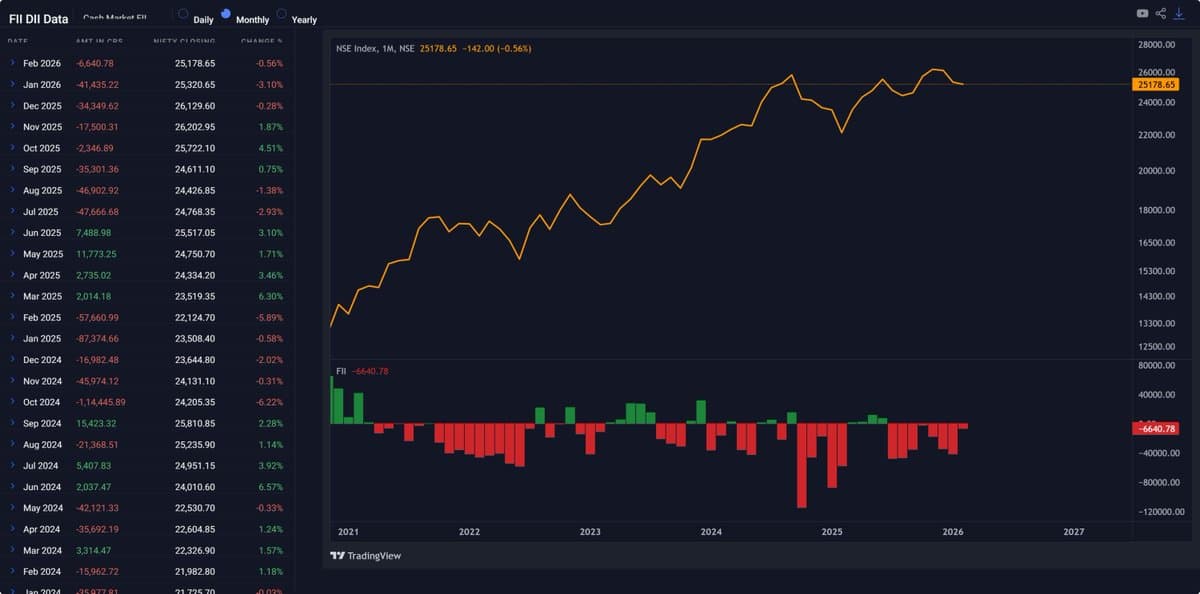
FIIs Sell for 8th Month; Markets Driven Elsewhere
As the final data for the month flows in, FIIs ended up being sellers in FEB [nse data]. So much for all the talk of FIIs returning. This is now the 8th month of outflows. Do not read too much...
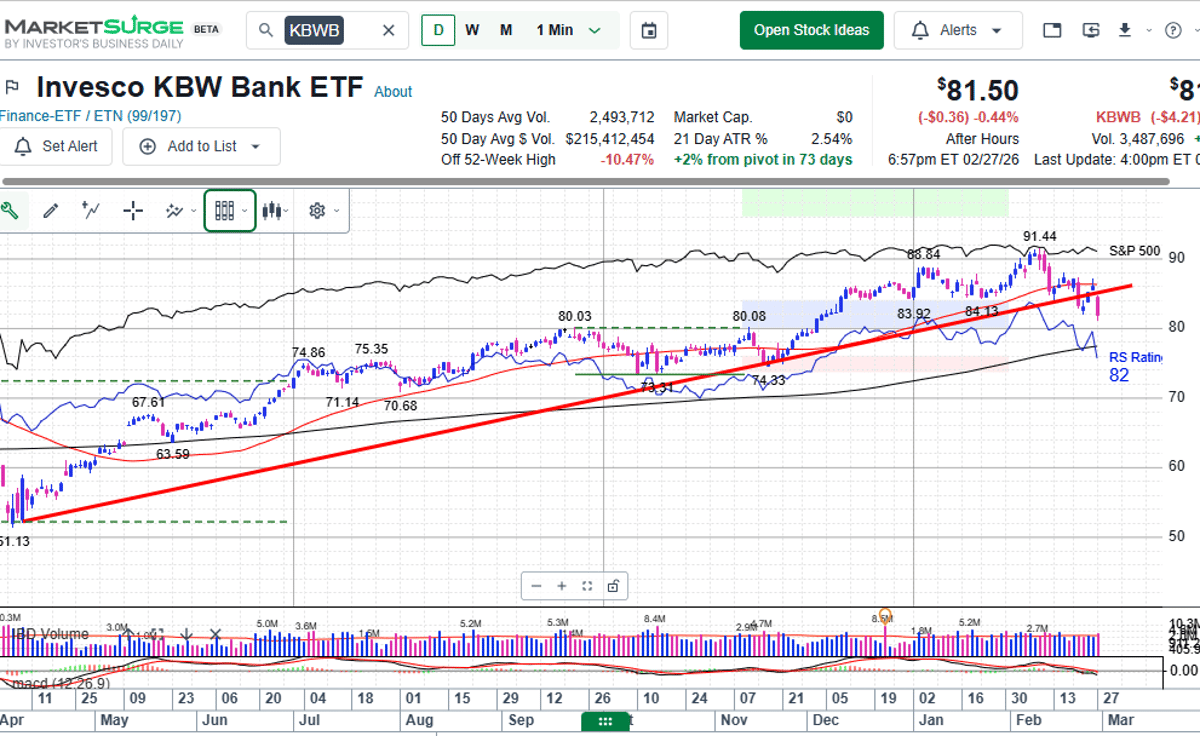
Equal‑Weighted SPX Holds While Financials Remain Weak
Equal-weighted SPX is holding up despite the Software/Mag 7 decline now spreading to NVDA and to Banks. Resilient... but Financials have been drubbed this year. Here's @IBDinvestors @marketsurge new charts of $KBWB Banks- https://t.co/XW54gpjWXm I discuss Financials & when i...
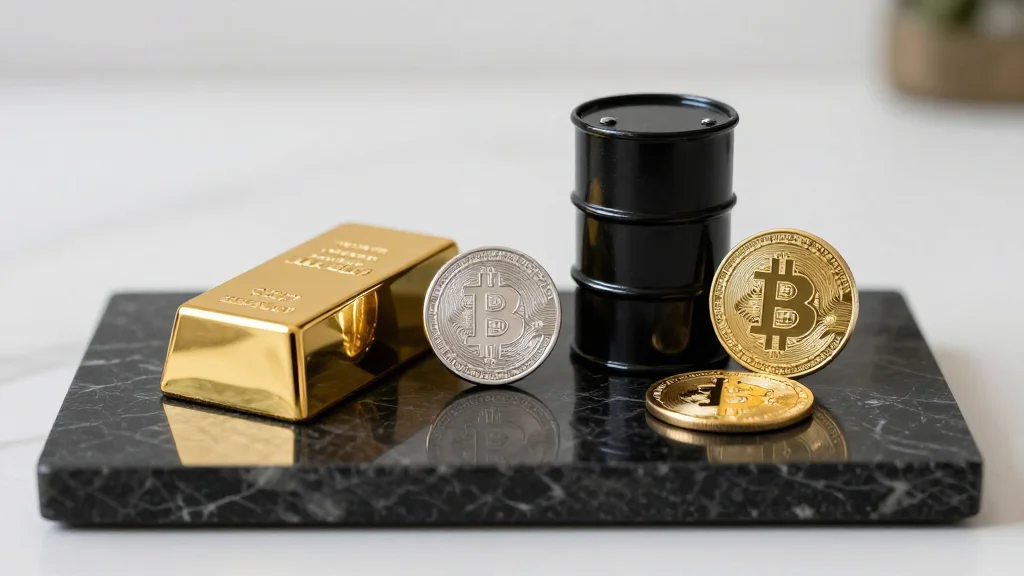
February: Metals and Energy Surge While Stocks and Crypto Dive
February... Silver $SLV: +13% Energy $XLE: +10% Gold $GLD: +9% International Developed $VEA: +6% EM $IEMG: +6% Oil $USO: +3% Bonds $AGG: +2% S&P 500 $SPY: -1% Nasdaq 100 $QQQ: -2% Financials $XLF: -4% Mag 7 $MAGS: -7% Software $IGV: -10% Bitcoin $IBIT: -22% Fartcoin $FART: -31%

Private‑credit and AI Scare Trade Slashed Stocks, Volatility Ahead
1% from ATHs, pathetic, imagine when real vol shows up: Private-credit ‘cockroaches’ and the AI ‘scare trade’ hammered stocks in February. Here’s what else has investors shaken up. https://t.co/mzDqO7IsGo

Software Gains, Hardware Falters: Go Long NFLX, Short NVDA
JPM: Software (IGV) — Sentiment +10% | Net flows +1.5z | ETF volume +4z (1yr lookback) Semis (SMH) — Sentiment -7% | Net flows -0.3z | ETF volume +1z I call that "green shoots" and made for a great $NFLX long, $NVDA short...

SPW Outpaces SPX as Rotation Fuels Broadening Theme
Interesting week $SPW > $SPX again - broadening theme. Picked up a little $SNPS in the software deluge. But rotation still the story as economic data continues to be good - claims, PMIs, retail EPS. Watch the turn in housing....
Current Chop Mirrors 2014‑15 Pattern, Not 2024‑25 Rally
A lot of people have been comparing the action since late October to the topping process from December 2024 to February 2025 but this comparison is false because the current structure has taken much longer to develop. This is more...
Widening Stops Amid Market Highs and Failed Breakouts
Market near highs. Trading feels terrible. Breakouts fail. Shorts don’t follow through. Violent rotation. 2015 “umbrella top” vibes. In today’s video: • Why I’m widening stops • Key SPY / QQQ levels • How I cut 6,000 stocks → 7 Process in a tough tape. https://t.co/xgyifTpUe1
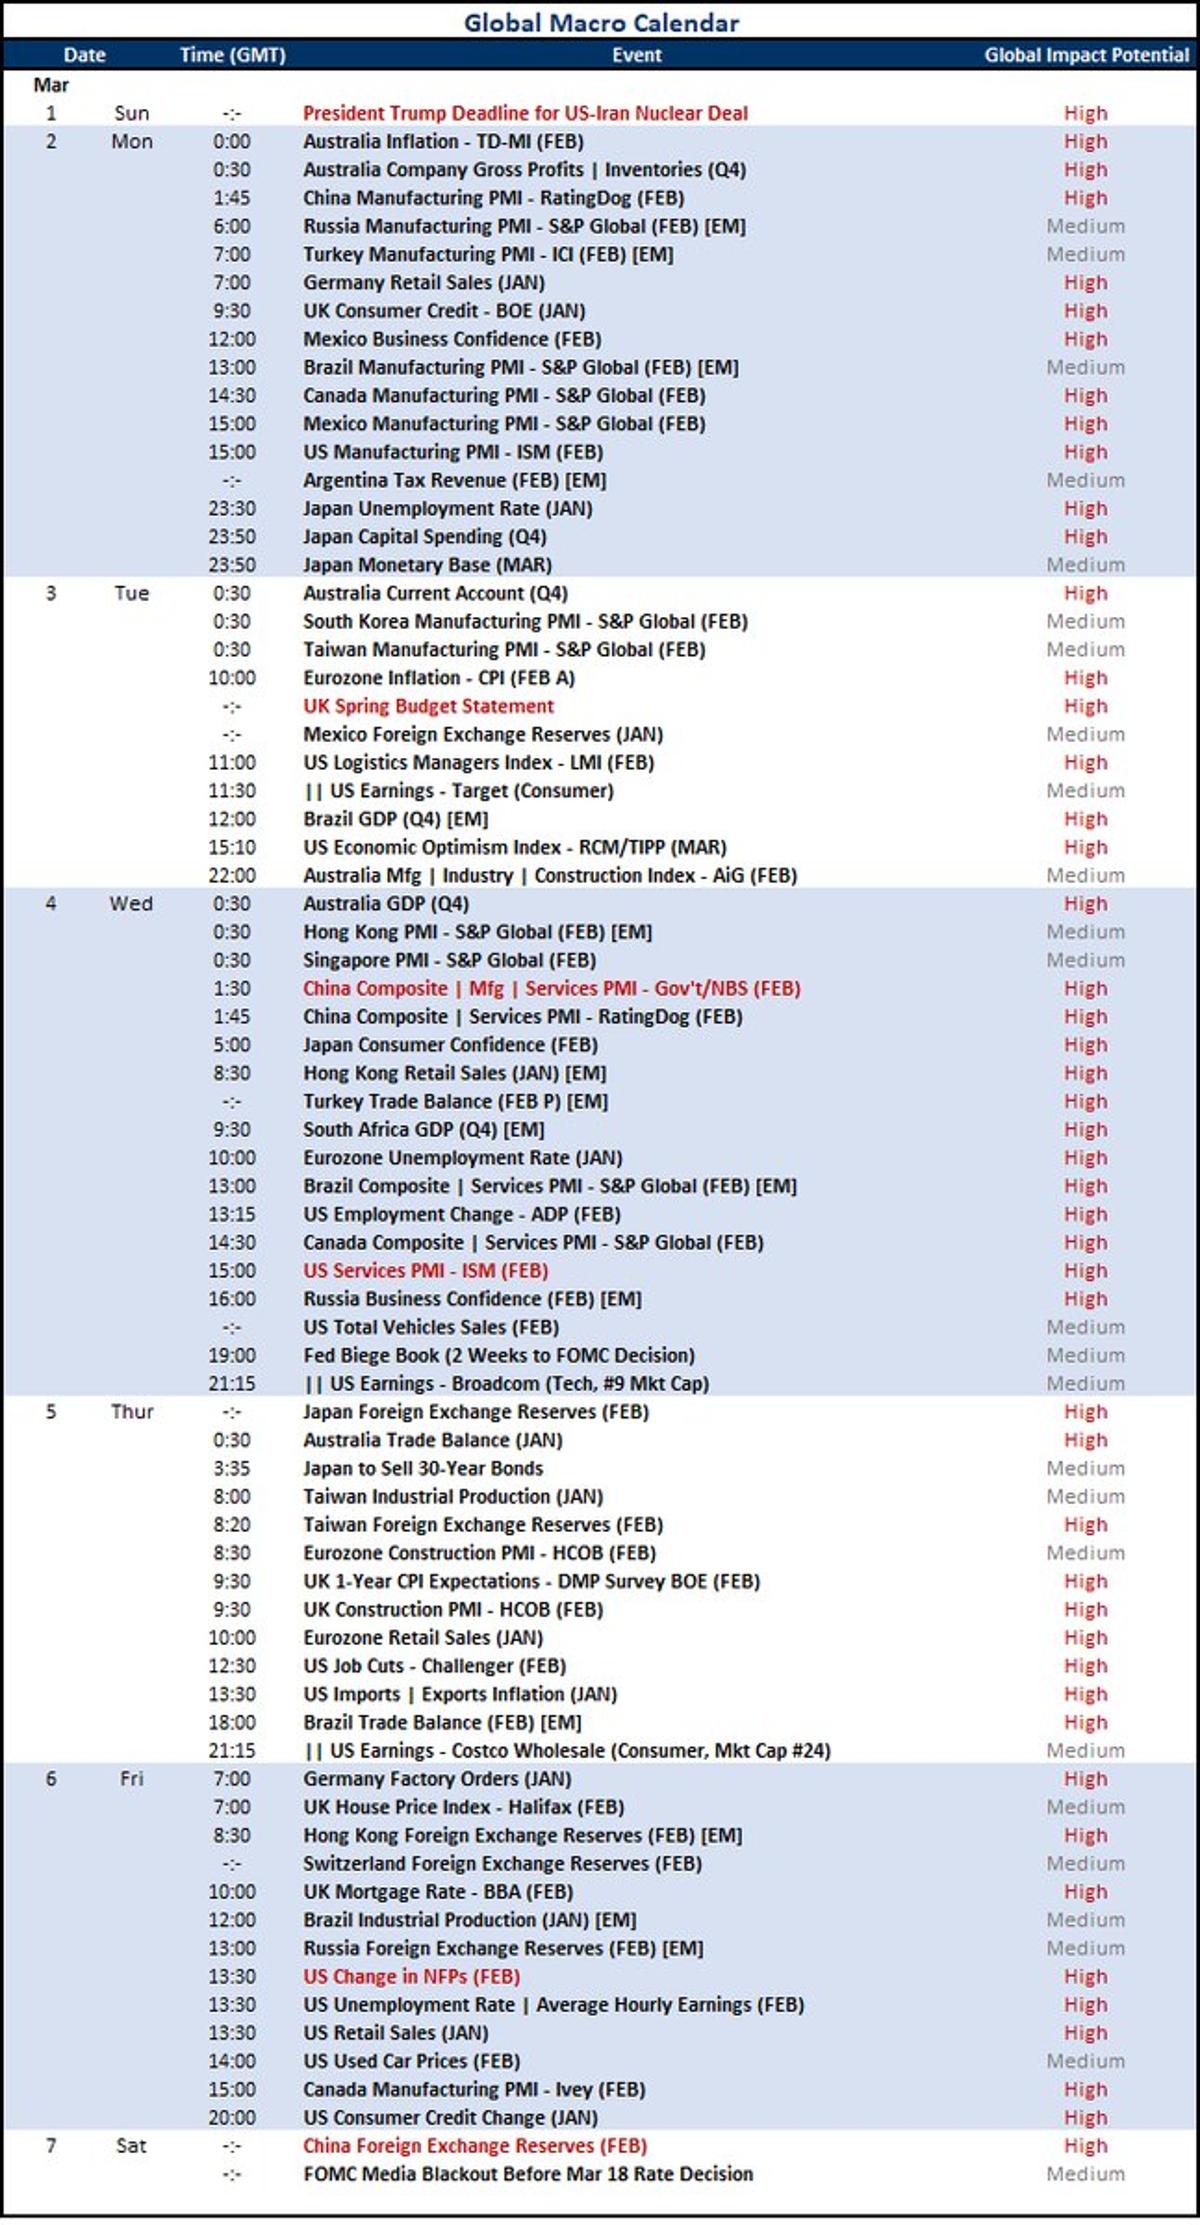
Next Week’s Trading Outlook: Key Markets, Themes, Risks
I discuss market conditions, key markets to watch, core themes and top global macro event risk (including #NFPs) for next week's trading in this week ahead video: https://t.co/lp8DLESugk https://t.co/0HVj5C19GQ

Dragonfly Premium Top10 Gains 58.9bp Weekly, +8.08% YTD
Dragonfly Capital Premium Top10 added 58.9bp on the week using 50% of capital. YTD +8.08% https://t.co/WLKiAGN5LF
Live at 5 PM: 20–30 Charts in 20 Minutes
Going live at 5pm EST ALL GAS NO BRAKES | Ep. 8 20 Charts in 20 Minutes *Might be like 30 charts in 20 Minutes to be honest... https://t.co/SPjwNgI1wH
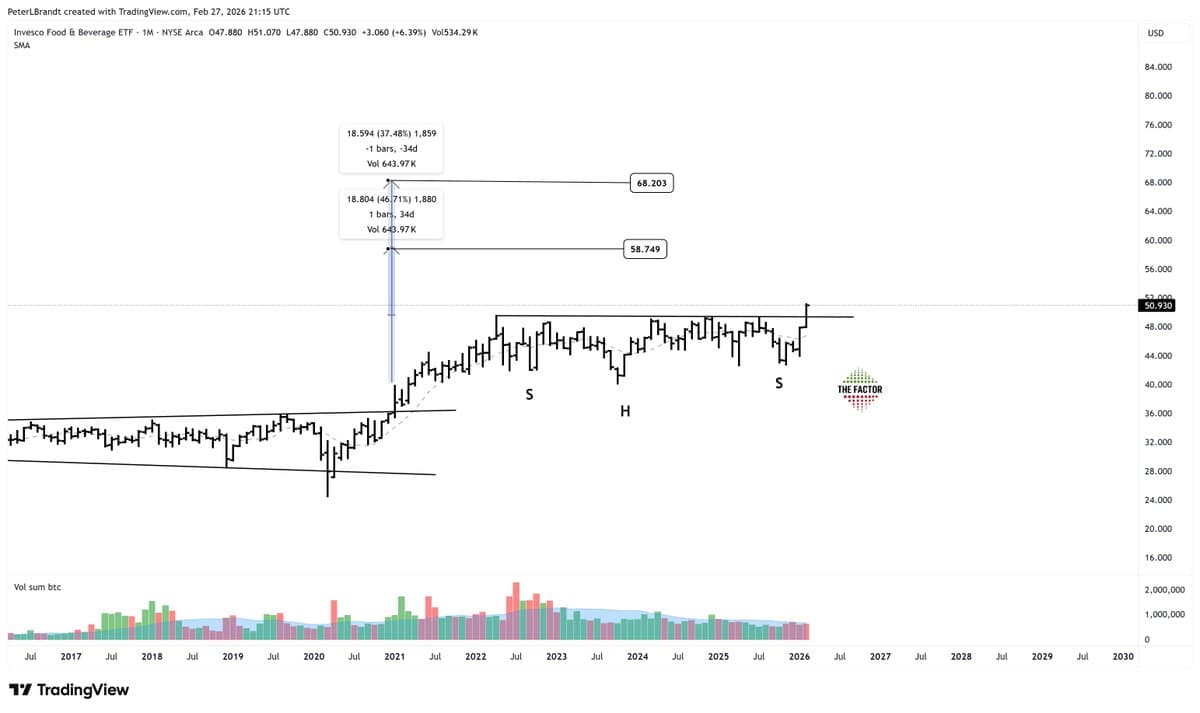
Inverted H&S Signals $PBJ Upside To
I cover this chart in the Update tomorrow My favorite sandwich is peanut butter, jelly, potato chips and banana slices $PBJ Continuation inverted H&S (they do exist skeptics) Target 1X at 58.7, 2X at 68 https://t.co/gDeM5nTRIY Best deal on the street https://t.co/nIjAT6ZSAA

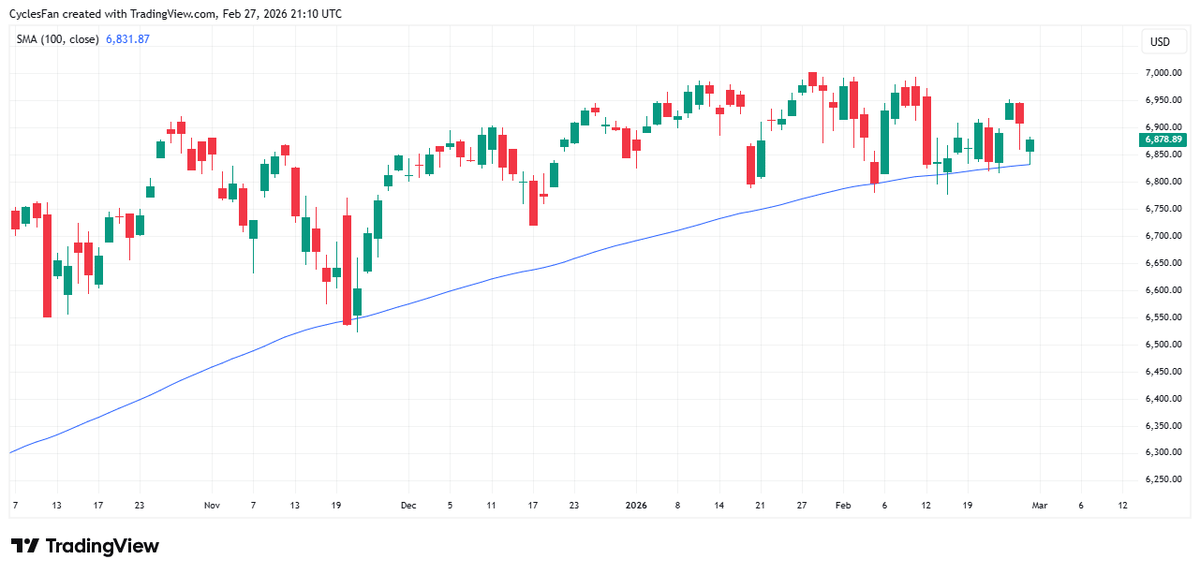
S&P 500 Holds Above 100‑Day Moving Average
$SPX - Ladies and gentlemen: aaaaand stilllll above the 100 day MA: the S&P 500. Wake me up when it closes below it. https://t.co/OU2yiK3lZm
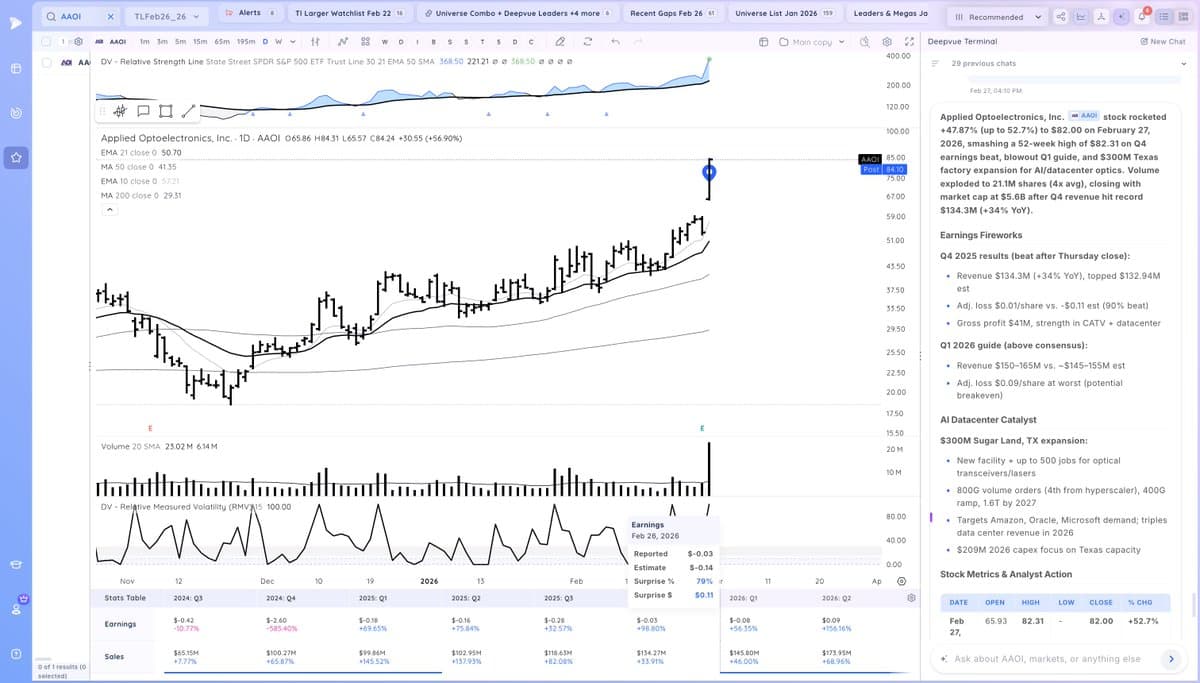
AAOI Spikes on Strong Catalyst Gap Amid Record Volume
$AAOI this is a bucking bronco but strong catalyst gap on the highest volume in multiple years https://t.co/76sNLp8x9O
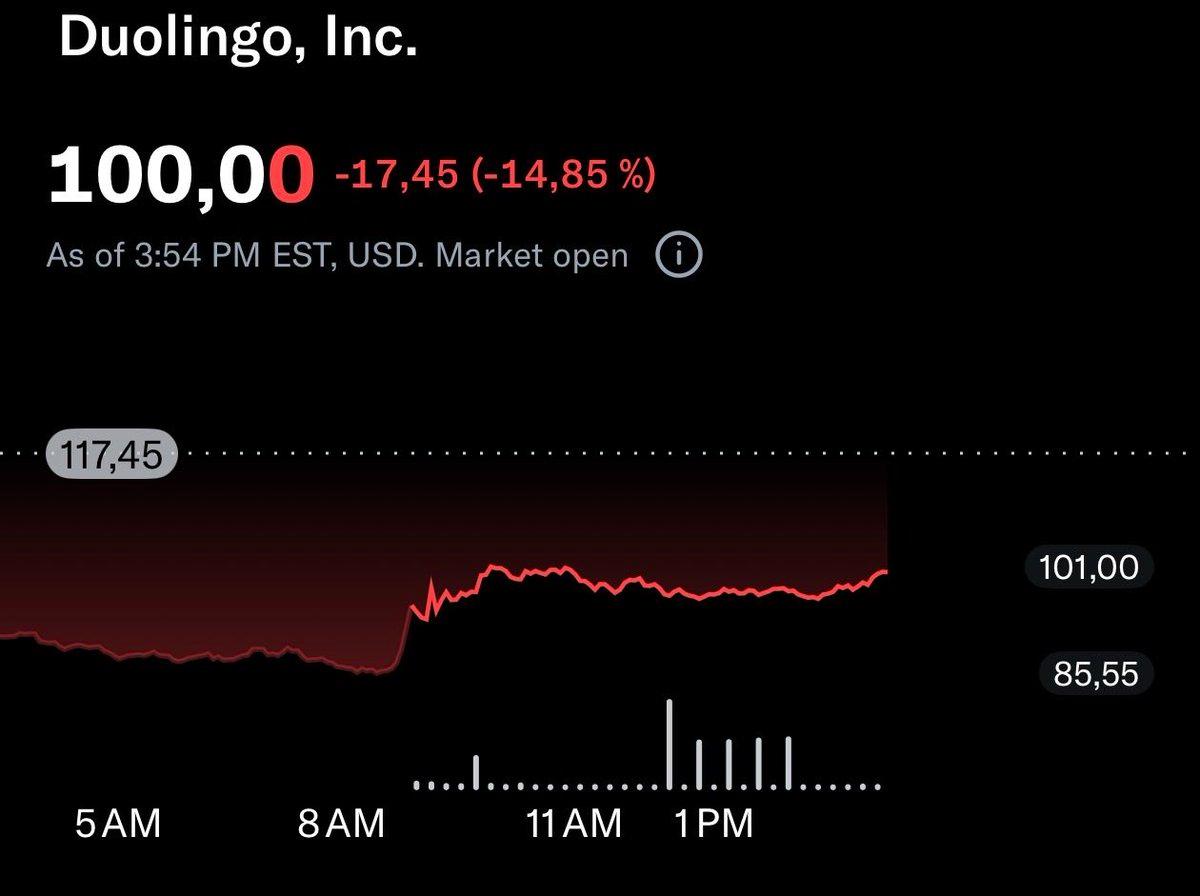
Duolingo's $400M Buyback Counters Heavy Short Interest
Duolingo bears are having a great day, but there is an interesting near term set up: 1) 25% of Duolingo float is shorted ($1.2b). 2) Duolingo just launched a $400m buyback program. That adds up to $1.6 billion to be bought sooner...
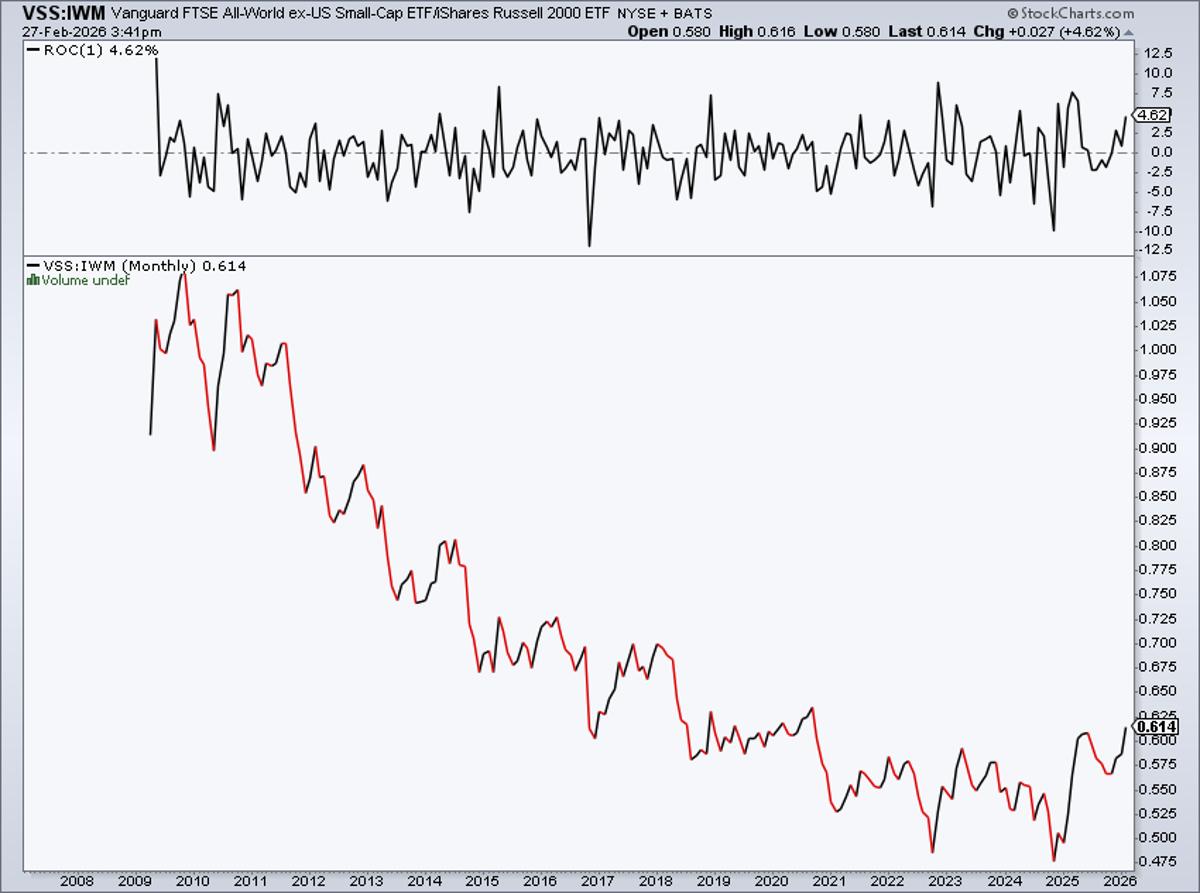
International Small Caps Outperform US, Matching 2016 Returns
International vs US small caps.. nice rounded bottom favoring $VSS Same return back to late 2016 https://t.co/mkK1YD3ZSt
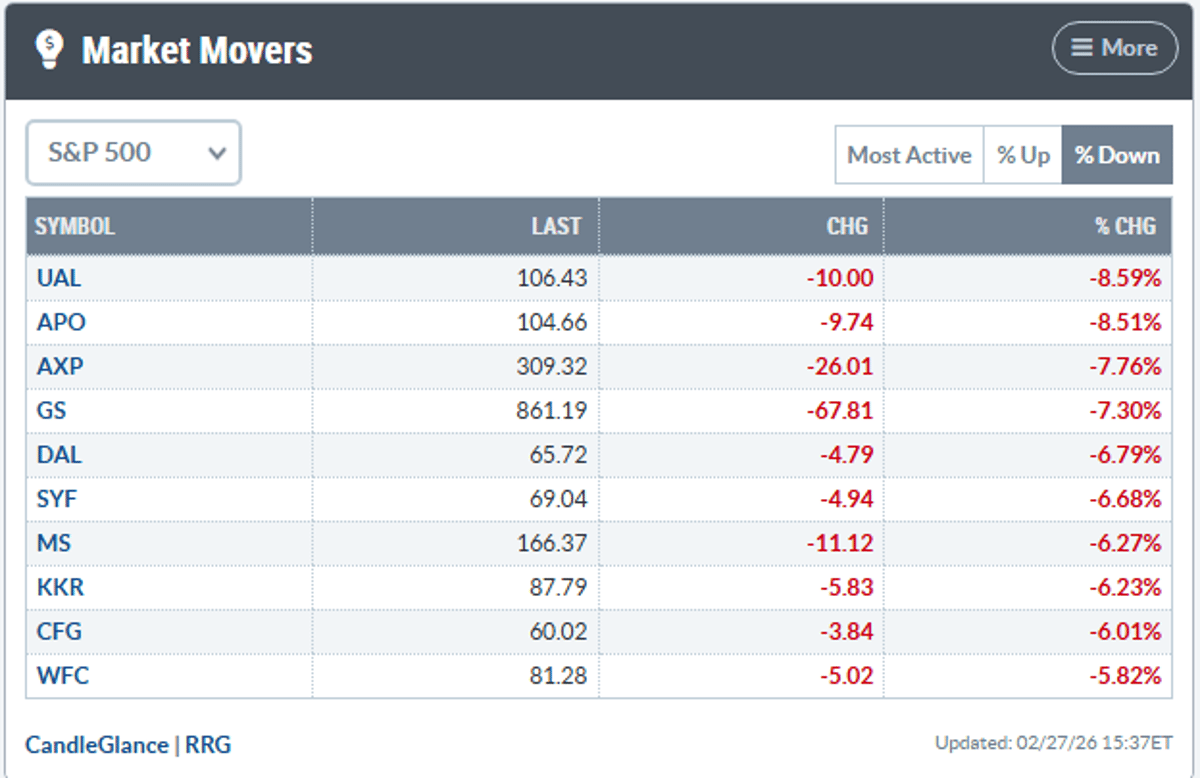
S&P Laggards Signal Weak Macro Confidence, Cockroach Stocks Rise
$GS $AXP $WFC $MS among the S&P 500 laggards today.. $UAL $DAL also not yielding any macro confidence $KKR $APO $SYF pointing to cockroaches @stockcharts https://t.co/MKUY5hJmse
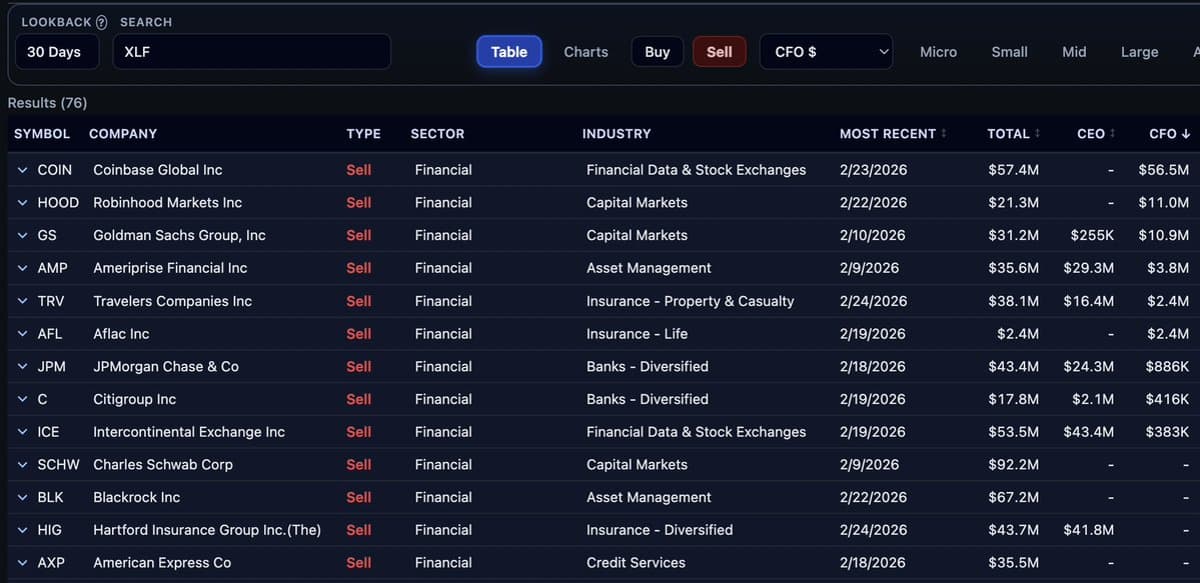
Significant XLF Selling Spike Mirrors $GS Trend
Related to the $GS post, subset of selling in XLF in the last 30 days. https://t.co/iuSWLKwbpm
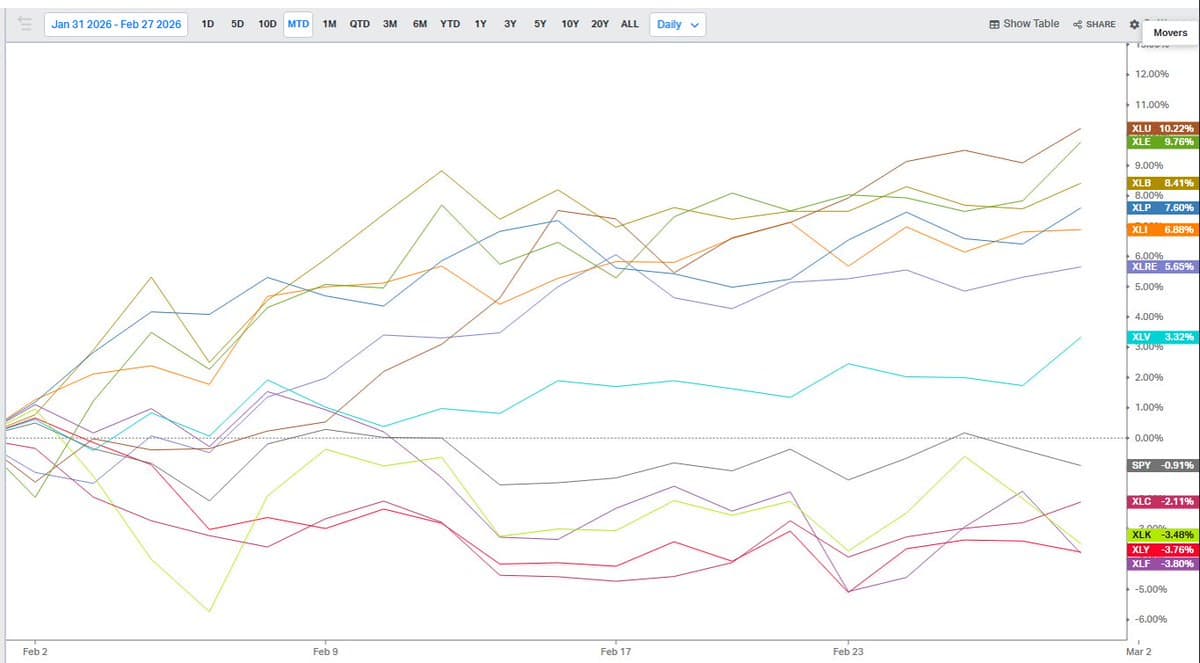
Most S&P 500 Sector ETFs Jump over 5.7% in February
The majority of S&P 500 sector ETFs were +5.7% or more in February @Koyfincharts https://t.co/003sR1VAW7
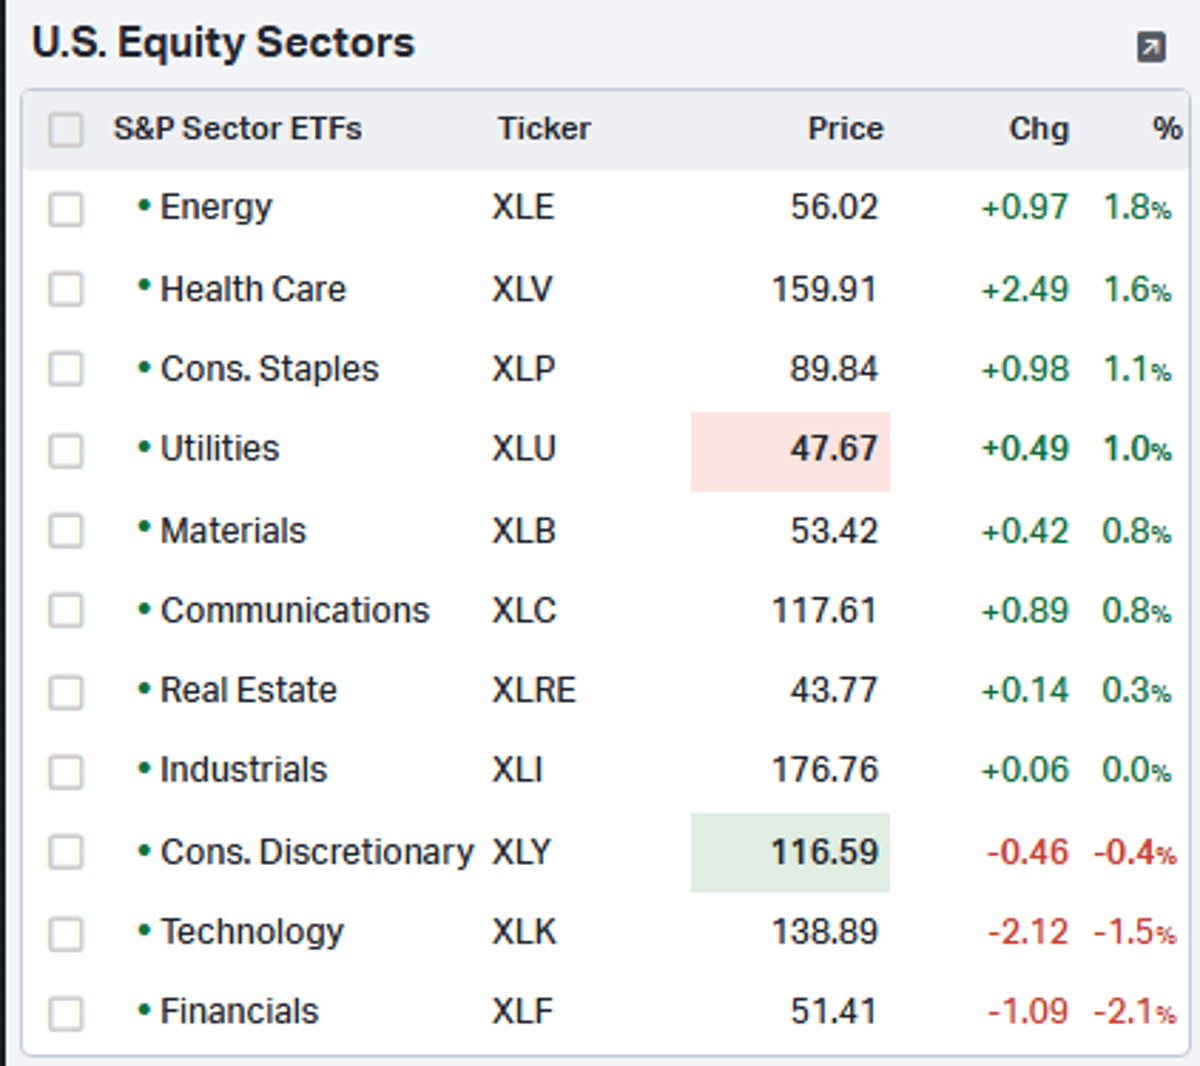
Most S&P
Story of the month.. 8/11 S&P 500 sector ETFs up today.. Financials, Tech, Discretionary down @Koyfincharts https://t.co/9XD507Xfoo
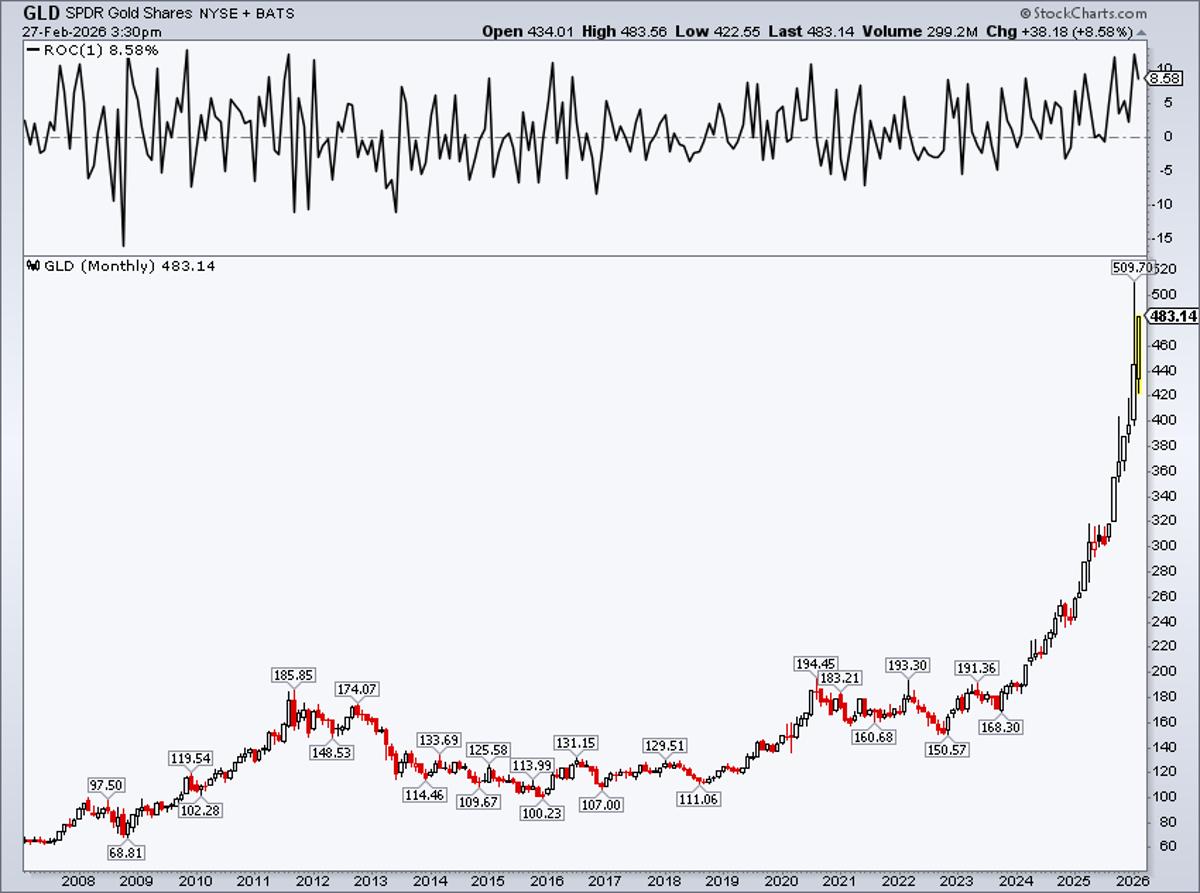
Gold Hits Record High, Extends 7‑Month Streak
Gold $GLD just another record monthly high.. by a mile. 7-month winning streak... +9% in February https://t.co/K0ucOz3DnD
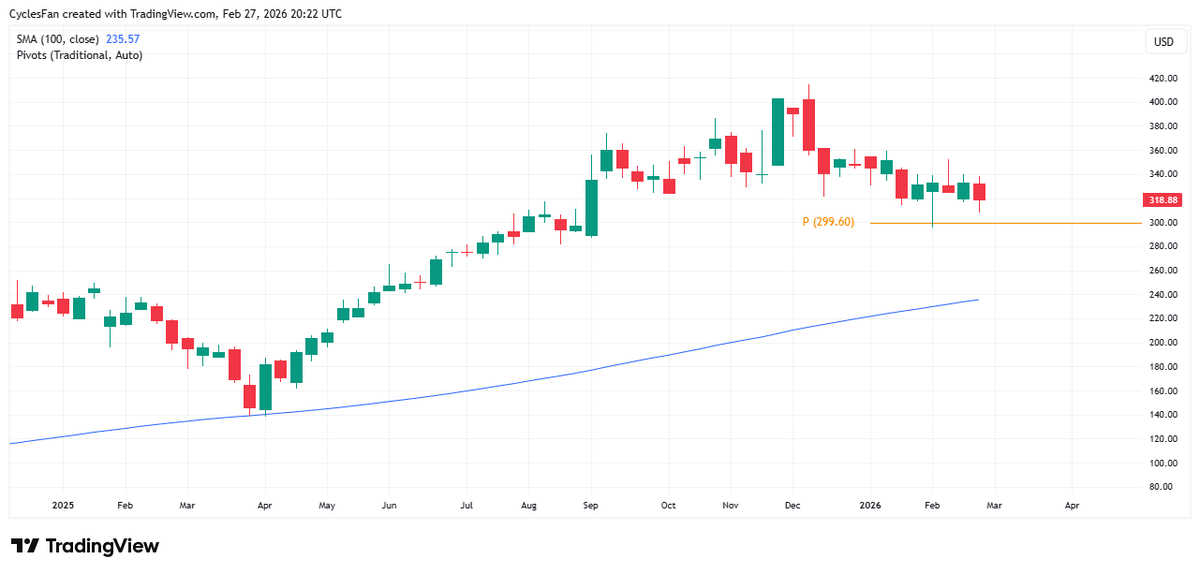
AVGO Below 299.60 Signals Decline Toward 235
$AVGO - Reports on Wednesday. Given what we saw from all big tech stocks so far the most bullish reaction would be a post earnings spike but not to a new ATH or even close to it. On the other...
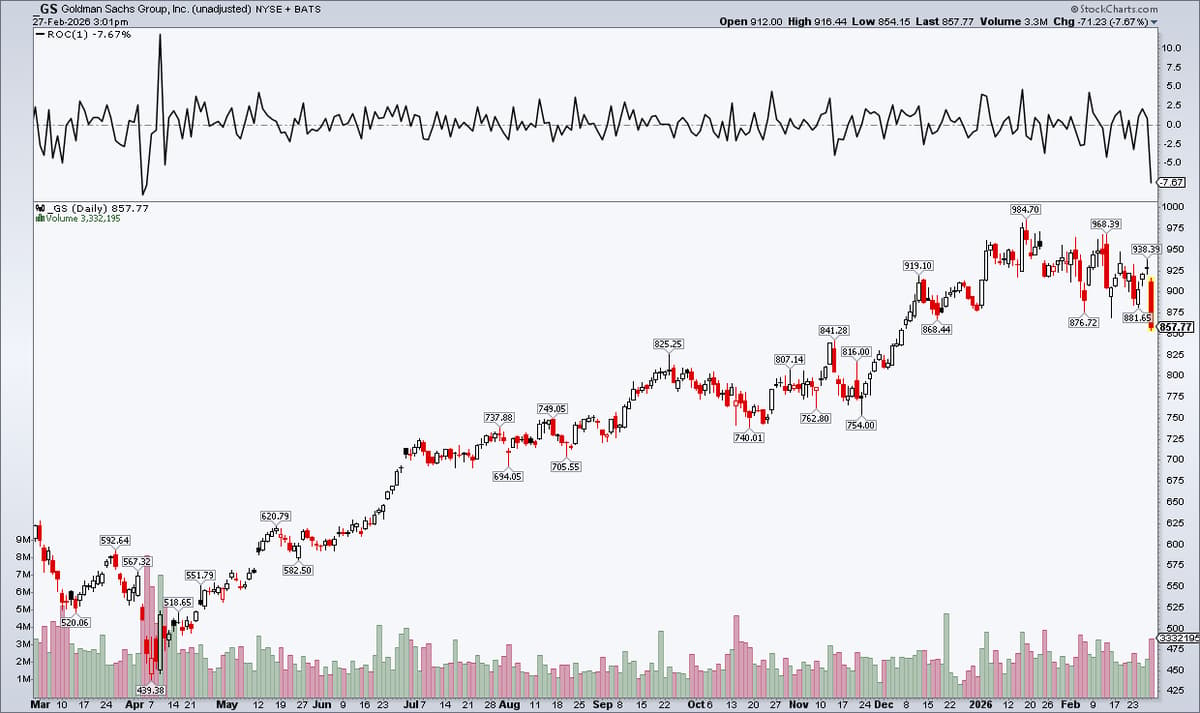
Goldman Sachs Slides 7.7%, Drags DJIA Down 367 Points
$GS -7.7%, worst day since last April... a gap fill from early December.. @stockcharts Shaving 367pts off the DJIA today https://t.co/4SjytU6GL2
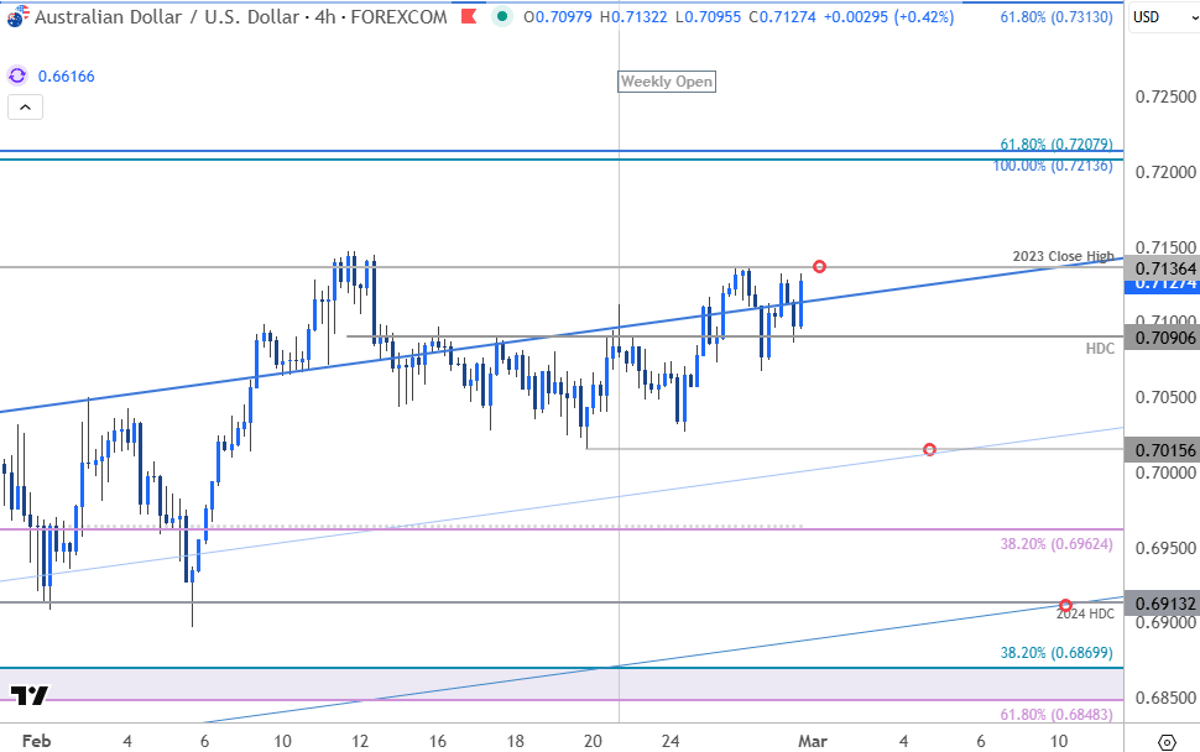
AUD/USD's Six-Week Rally Meets Multi-Year High Test
Australian Dollar Outlook: AUD/USD 6-Week Winning Streak Faces Major Test at Multi-year Highs https://t.co/OQ8pT6aY7y $AUDUSD Daily & 240min Charts https://t.co/v6yDD2nwcL
February Historically Weak for QQQ, Not a Certainty
Seasonality is a historical tendency and not a guarantee. Feb is statistically a bad month for the $QQQ and this one looks to add to the stat on the negative side.

Hidden Market Volatility May Surface via Crypto, Bonds, Metals
Stock market volatility is still buried. Falling cryptos, T-bond yields and spiking precious metals volatility may trickle down. https://t.co/SeGPI6EvAe

AI‑Biotech IPO Slumps 23% on Opening Day
A leader of this next wave of AI-focused biotechs has completed its IPO, a milestone tarnished by a brutal first few hours of trading. Day 1 for $GENB: -23% https://t.co/u3WQcDD3jL
Warner Bros and Paramount Finalize Agreement, Says CRO
Warner Bros Chief Revenue And Strategy Officer: Warner Bros, Paramount Signed Agreement As Of This Morning $WBD $PSKY
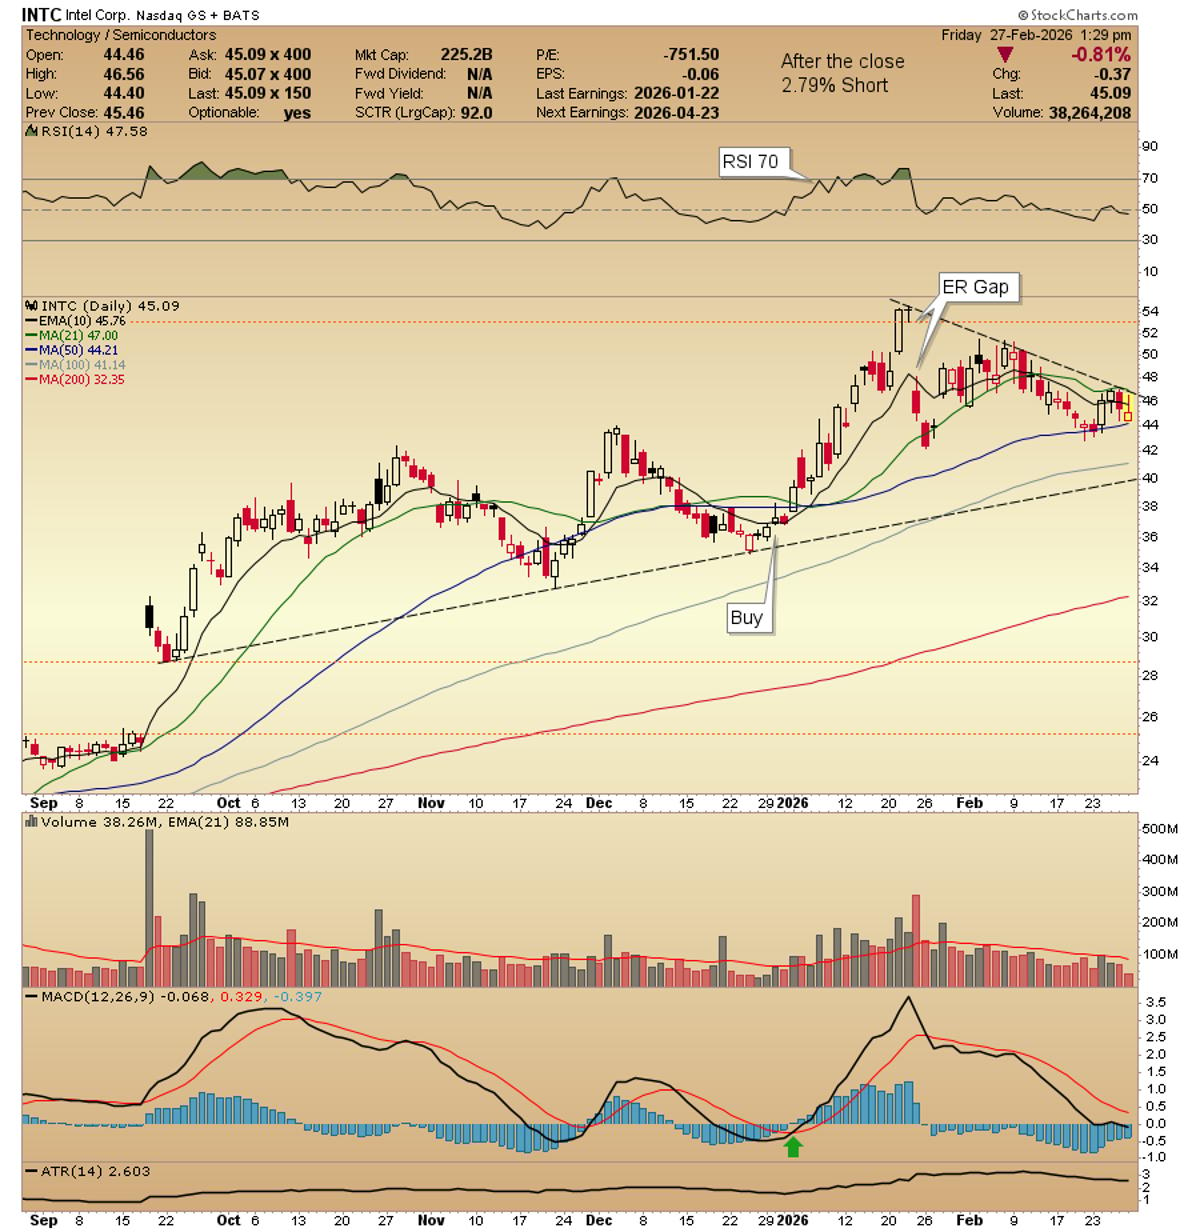
Intel Holds Below Base Top, Basing at 50‑Day MA
$INTC daily basing along the 50ma and below the base top. Still hold it here no change today. Updated chart. https://t.co/BqQrlEX6xR
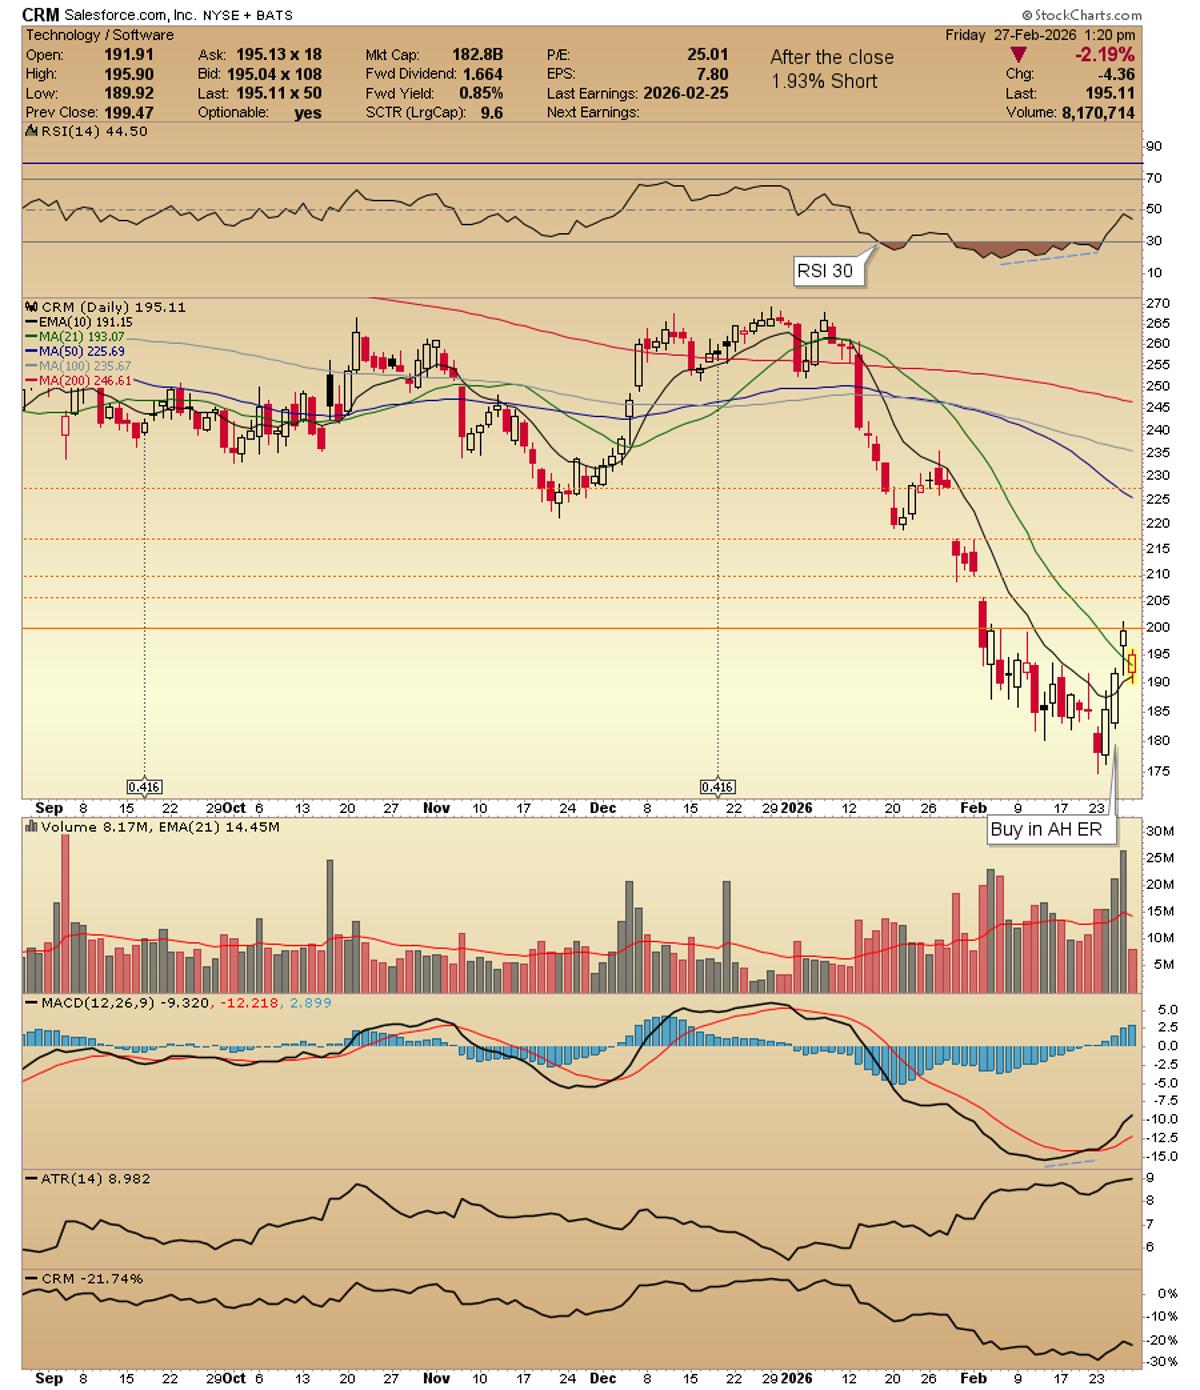
CRM Holds 10‑21 MA After ER Gap‑Up
$CRM updated charts. The line chart was inspired from @MntlmrktsChaz line chart posted. The daily holding the 10-21ma's and starting the basing form the ER gap up. still own it here https://t.co/2FDvsFmGHl
Fade Extreme Breakouts; Trade Location, Not Emotion
Breakouts look strong… until they reverse. 🚨 If we’re inside value with a flat VWAP, chasing highs is usually the trap. Fade statistical extremes. Trade location, not emotion. Link in profile 📲 #DayTrading #FuturesMarket #TradingEducation
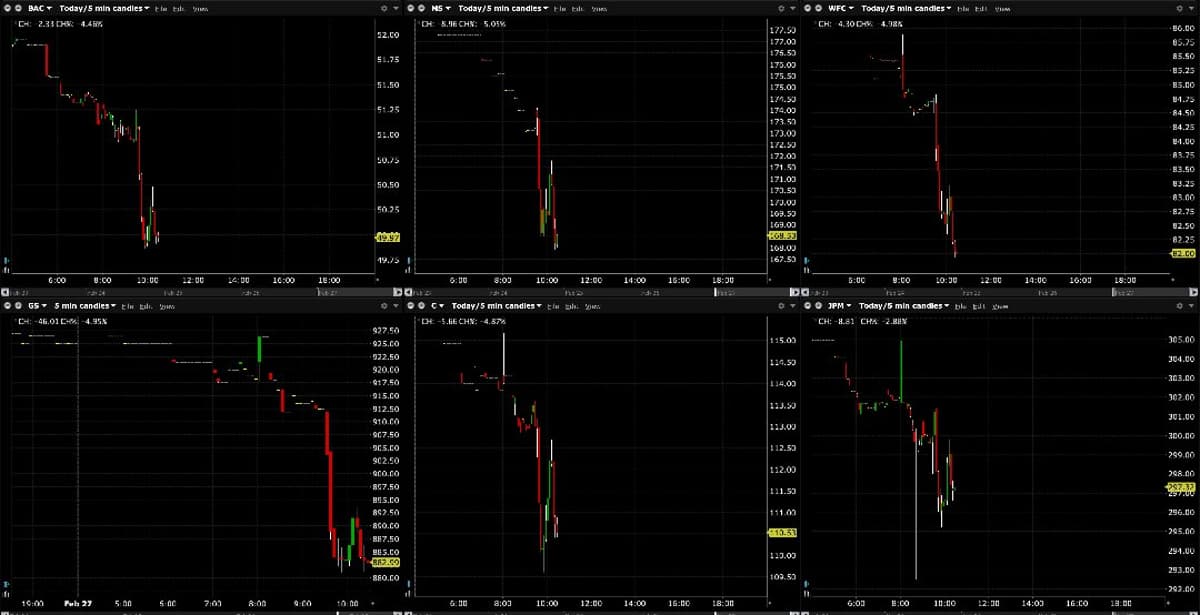
Financials Lead Market Weakness with Biggest Daily Loss
The real market story today is the weakness in financials and not the hyperscalers @ScottWapnerCNBC @HalftimeReport @dougkass Observe these massive individual financial stock losses: $C -$7 $AXP -$25 $GS -$72 $MS -$13 $APO -$10 Since this is the single largest daily loss, it might...

OpenAI's Record Funding Rattles AI Giants and Software Stocks
There's a new kingmaker in AI... OpenAI raises the largest private funding round in history and two of the biggest backers ($NVDA and $AMZN) are down to flat today. Meanwhile a blog post from Anthropic sends software stocks swinging
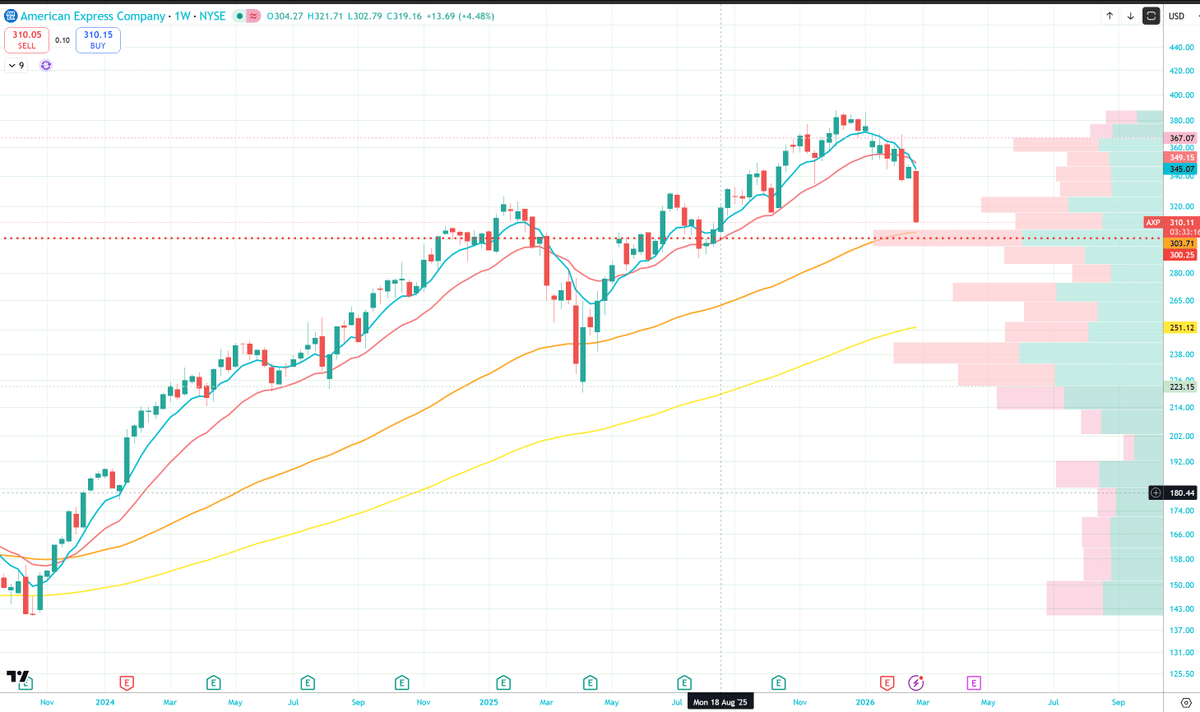
AmEx Buying Holds Steady Amid White‑
$AXP put buying staying constant Hammered this week on the idea that the end of white collar knowledge workers disrupts its card user spending https://t.co/Cd5J3HA4N4
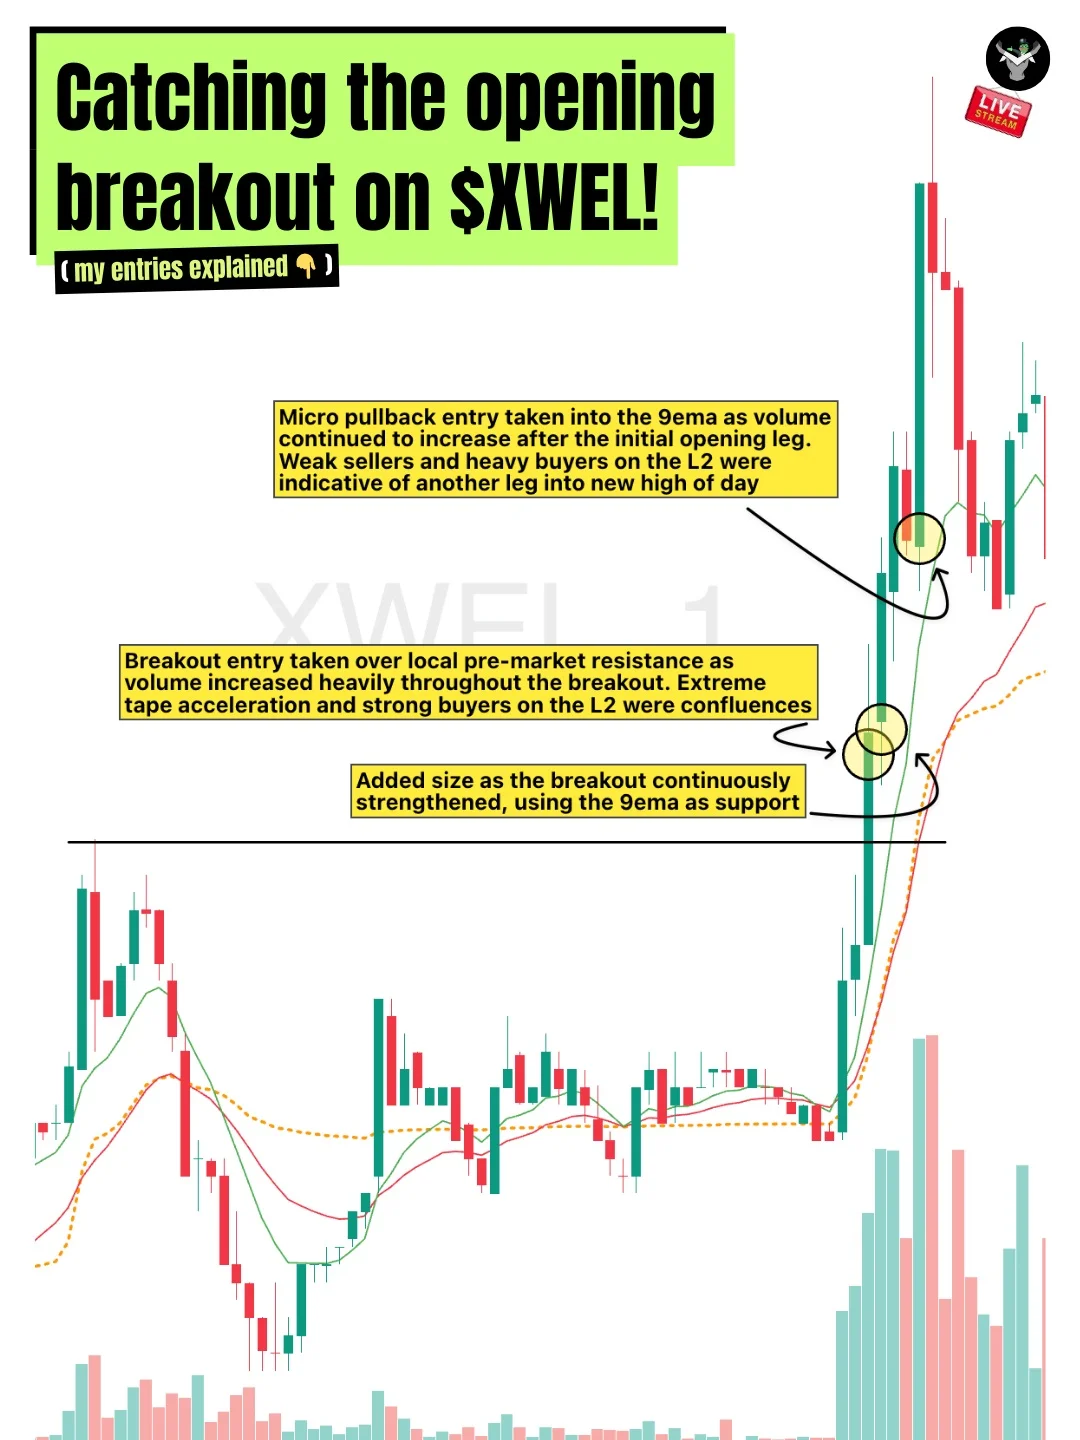
XWEL Secures Green Friday with Clean Open Exit
A green Friday is locked in thanks to $XWEL ✅ Such a clean move out of open 👇

Understanding Covered Calls vs Equivalent Stock Delta Sale
Today's spaced repetition is structured as a slow-as-molasses homework that builds up to understanding the nature of covered calls vs the equivalent portfolio of selling [delta] amount of your stock (which is the right basis of comparison)

SUI Nears Reversal Lows, Spot ETF Sparks Bull Hope
$SUI SUI is getting closer and closer to its mid-2024 reversal lows From a fundamental standpoint, the first #SUI spot ETF debuted recently as Canary Capital & Grayscale launched funds with staking, which will bolster investor interest in the next Bull Cycle #Crypto...
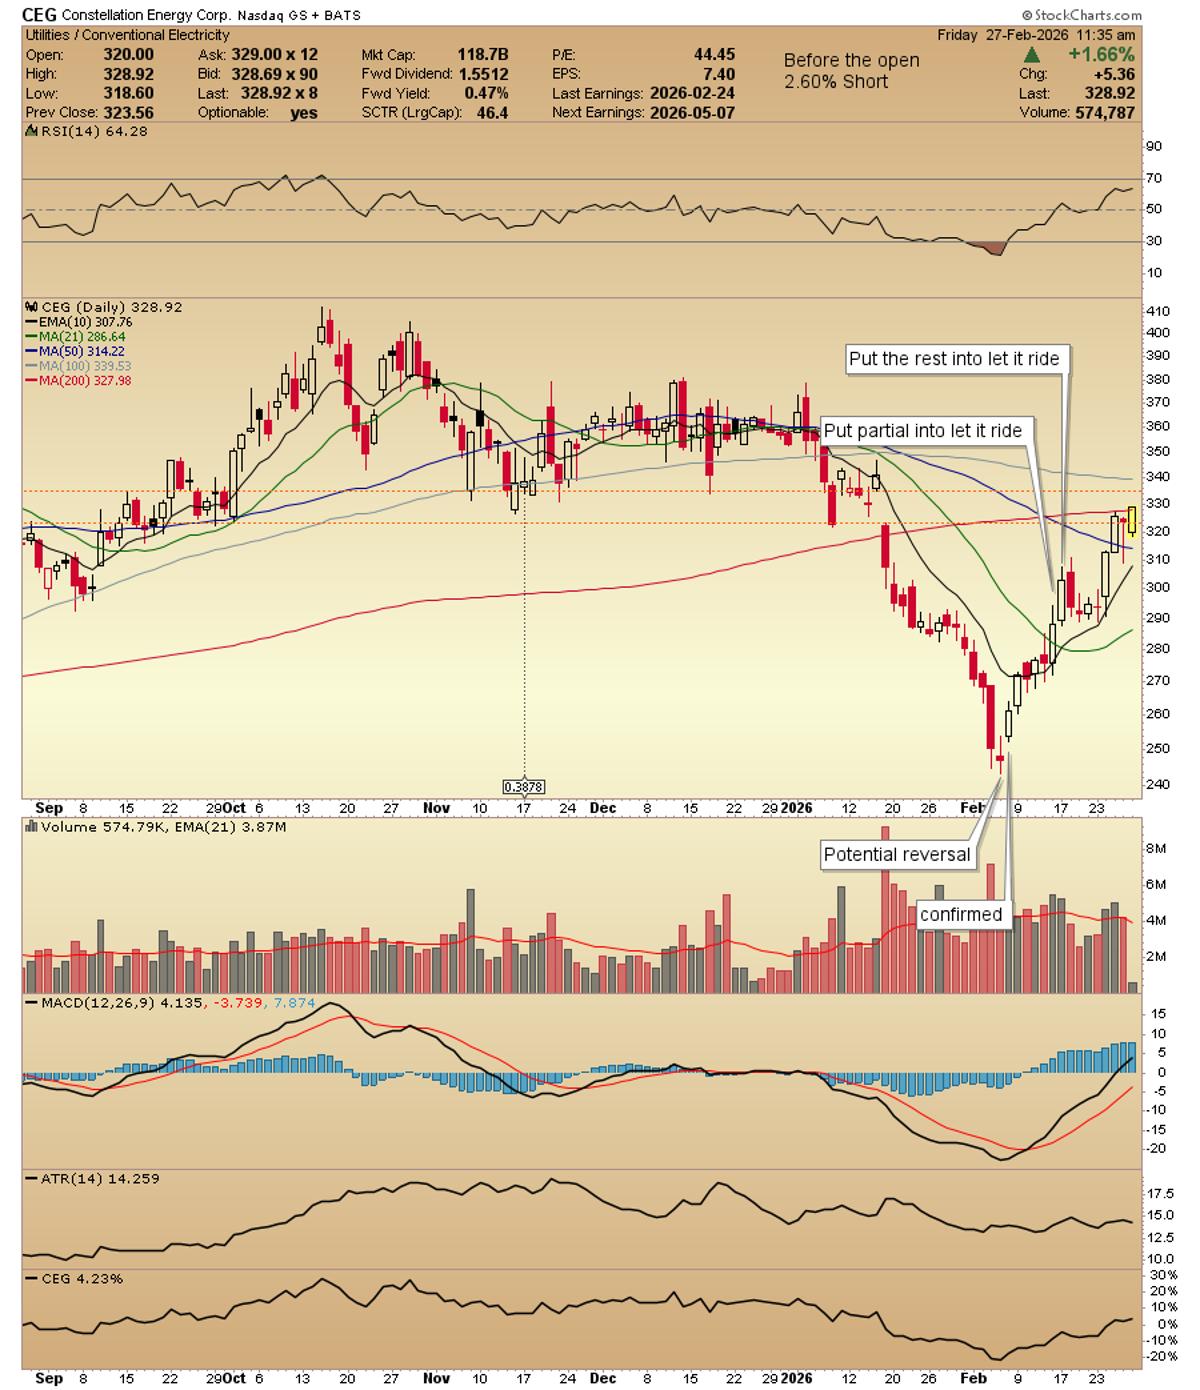
CEG Closes Gap, Holds Above 335.95
$CEG daily tapping on the 200ma and the gap. 335.08 closes the gap and it confirms with a move and hold over 335.95. updated chart https://t.co/cHZ7kh8CHT

Sold $RKT Shares, Secured
$RKT payday shares sold for good payday %. I now settle into the full swing with cushion. Different symbol, same system used over and over again.