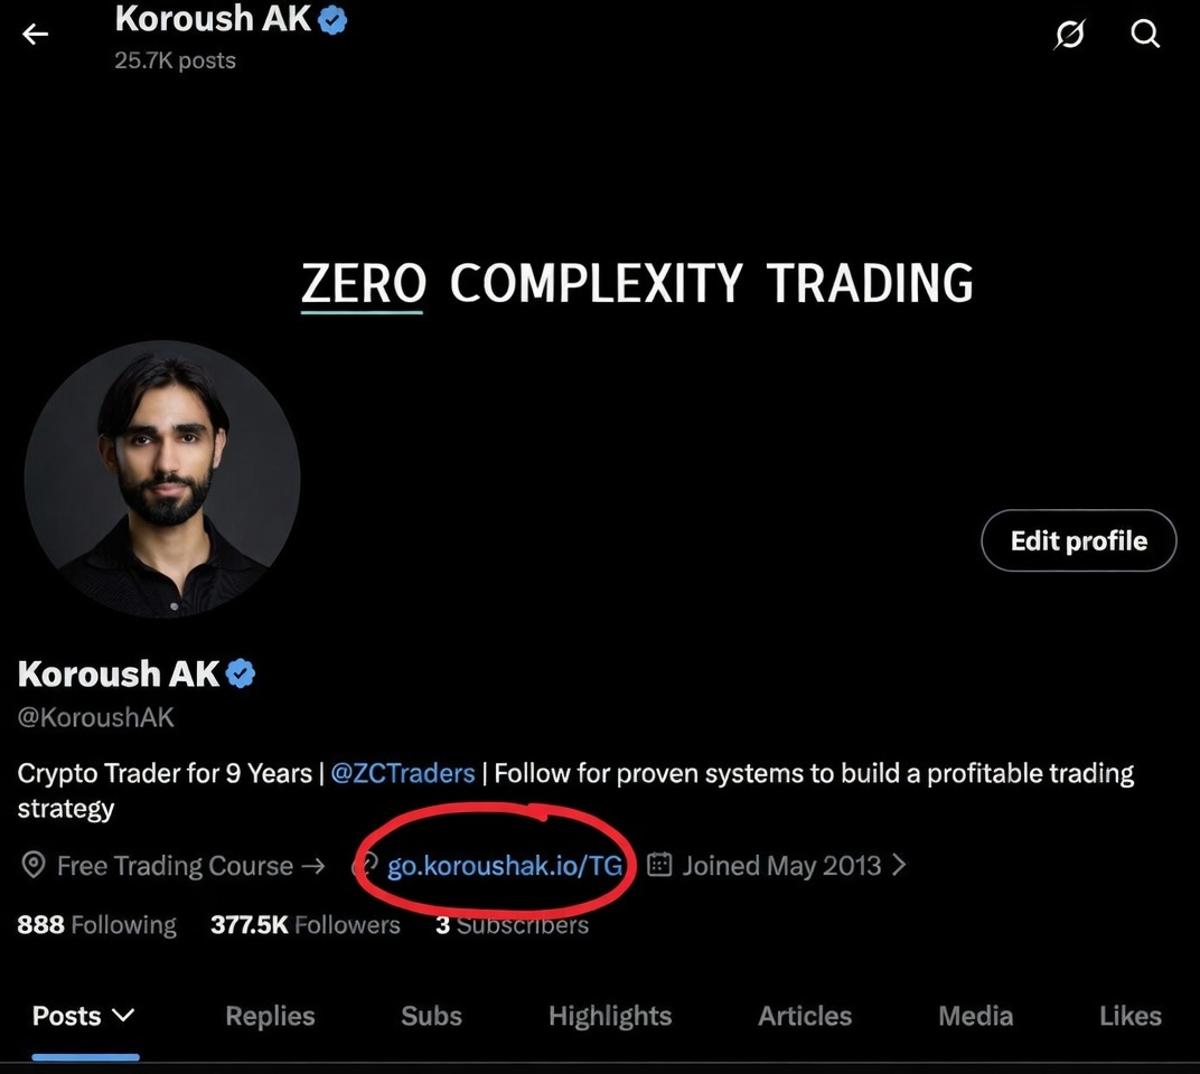
Free Guide to Building a Solid Trading Strategy
If you want to 'get rich quick trading', this isn’t for you. If you want to build a real trading strategy, i can help - Full Strategy Deep Dives - TA, Leverage and Position Sizing Guides + Free indicators, PDFs, and extra readings Link is in my profile (it's free) https://t.co/rCAGLX6hmO

Chart Patterns With Over 80% Accuracy Revealed
📈Chart Patterns Ranked by Accuracy % Which patterns work 80% of the time? This is a GOOD one 👇 Make sure you follow/subscribe to @proptraderedge for more great tips like this
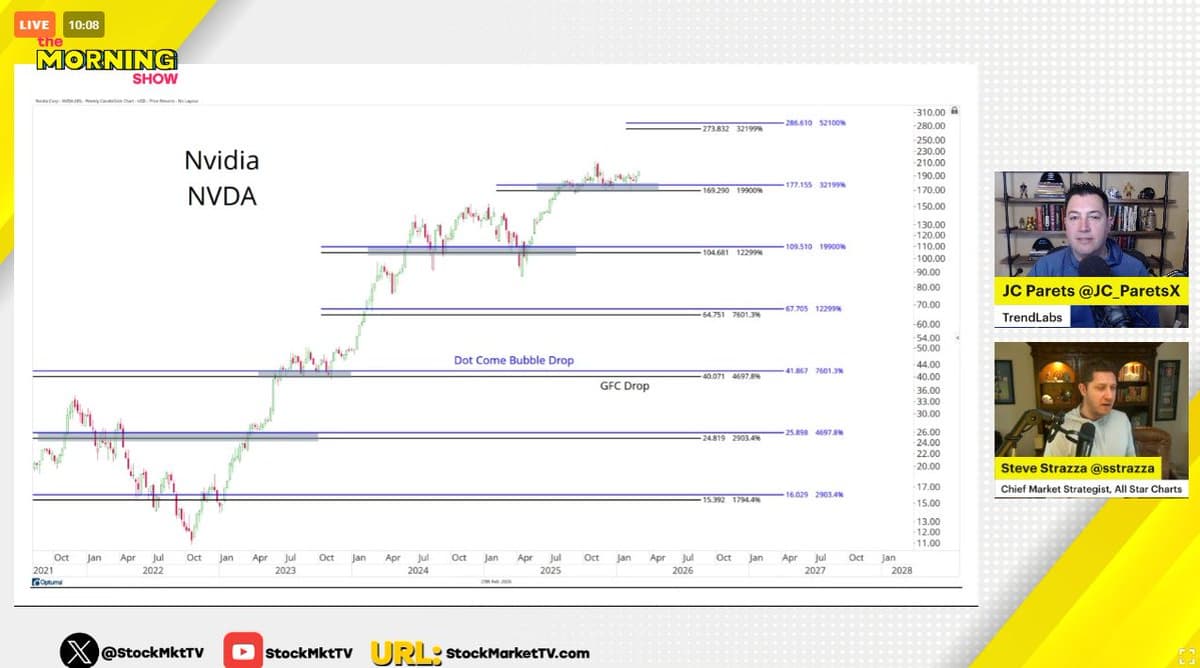
Few Use Fibonacci Extensions on Nvidia Across Crises
How many people are calculating Fibonacci extensions for Nvidia going back to the Dot Com Bubble and Great Financial Crisis? "Not enough", says @sstrazza LIVE on The Morning Show @StockMktTV Come hang out and let us know what you think...
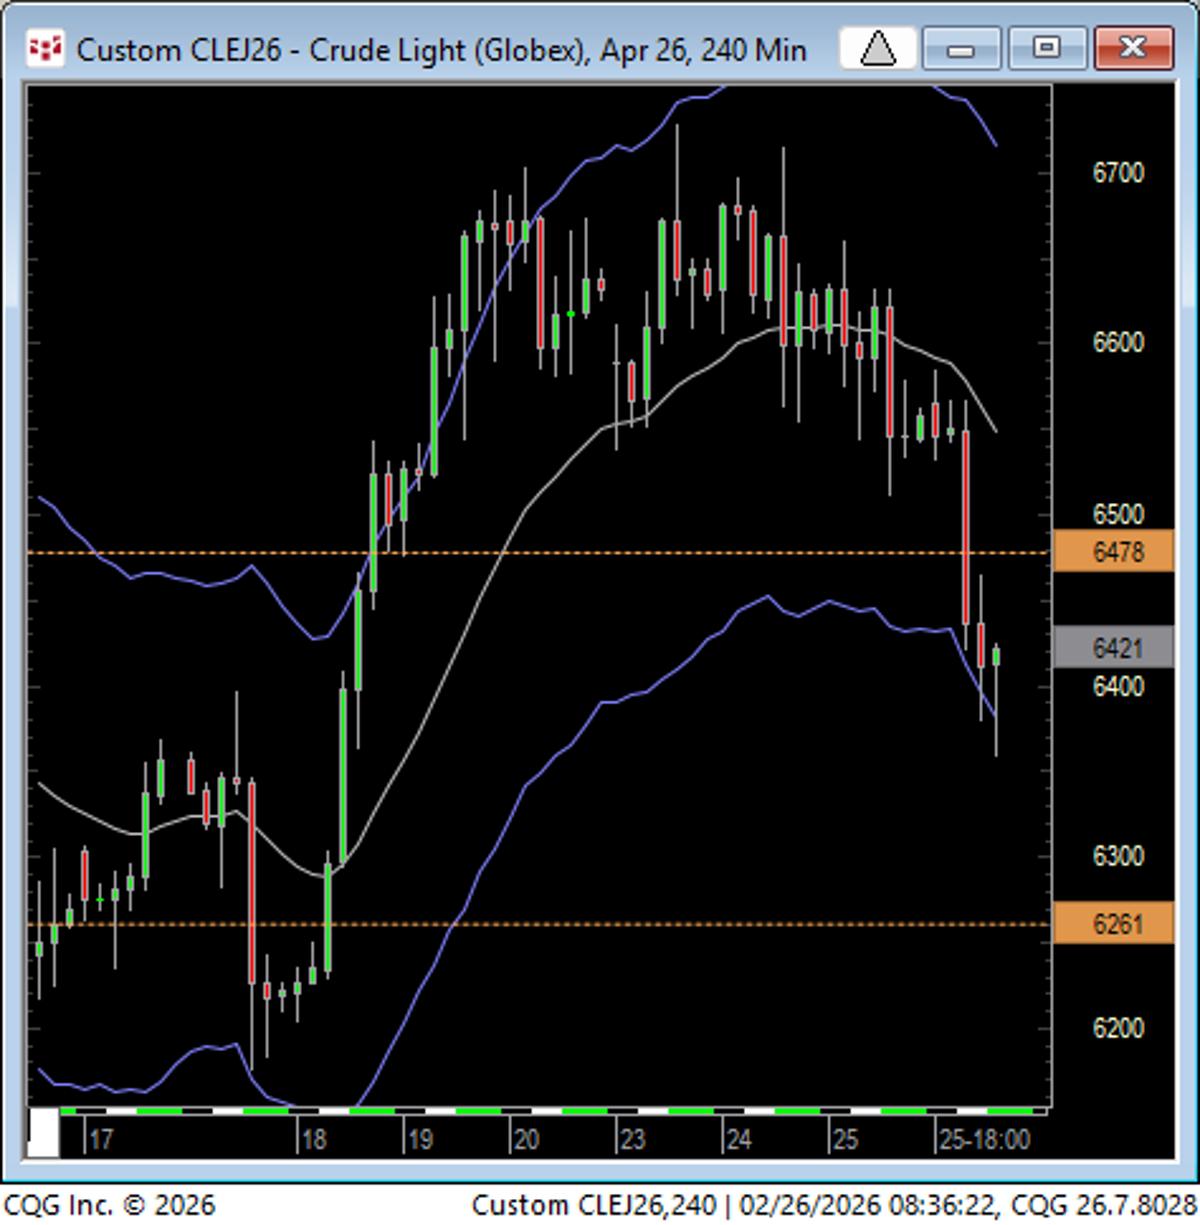
Crude Oil Slipped Into the Cave Overnight.
Crude DID end up trading partially into the cave last night....but of course, not when we were looking for this yesterday... https://t.co/BuN0hJWHds

Bitcoin Bear Market Still Early, Only 140 Days In
#BTC The shortest Bitcoin Bear Market lasted 365 days Bitcoin is currently ~140 days into its current Bear Market Any talk of the Bear Market being over already is probably premature $BTC #Crypto #Bitcoin
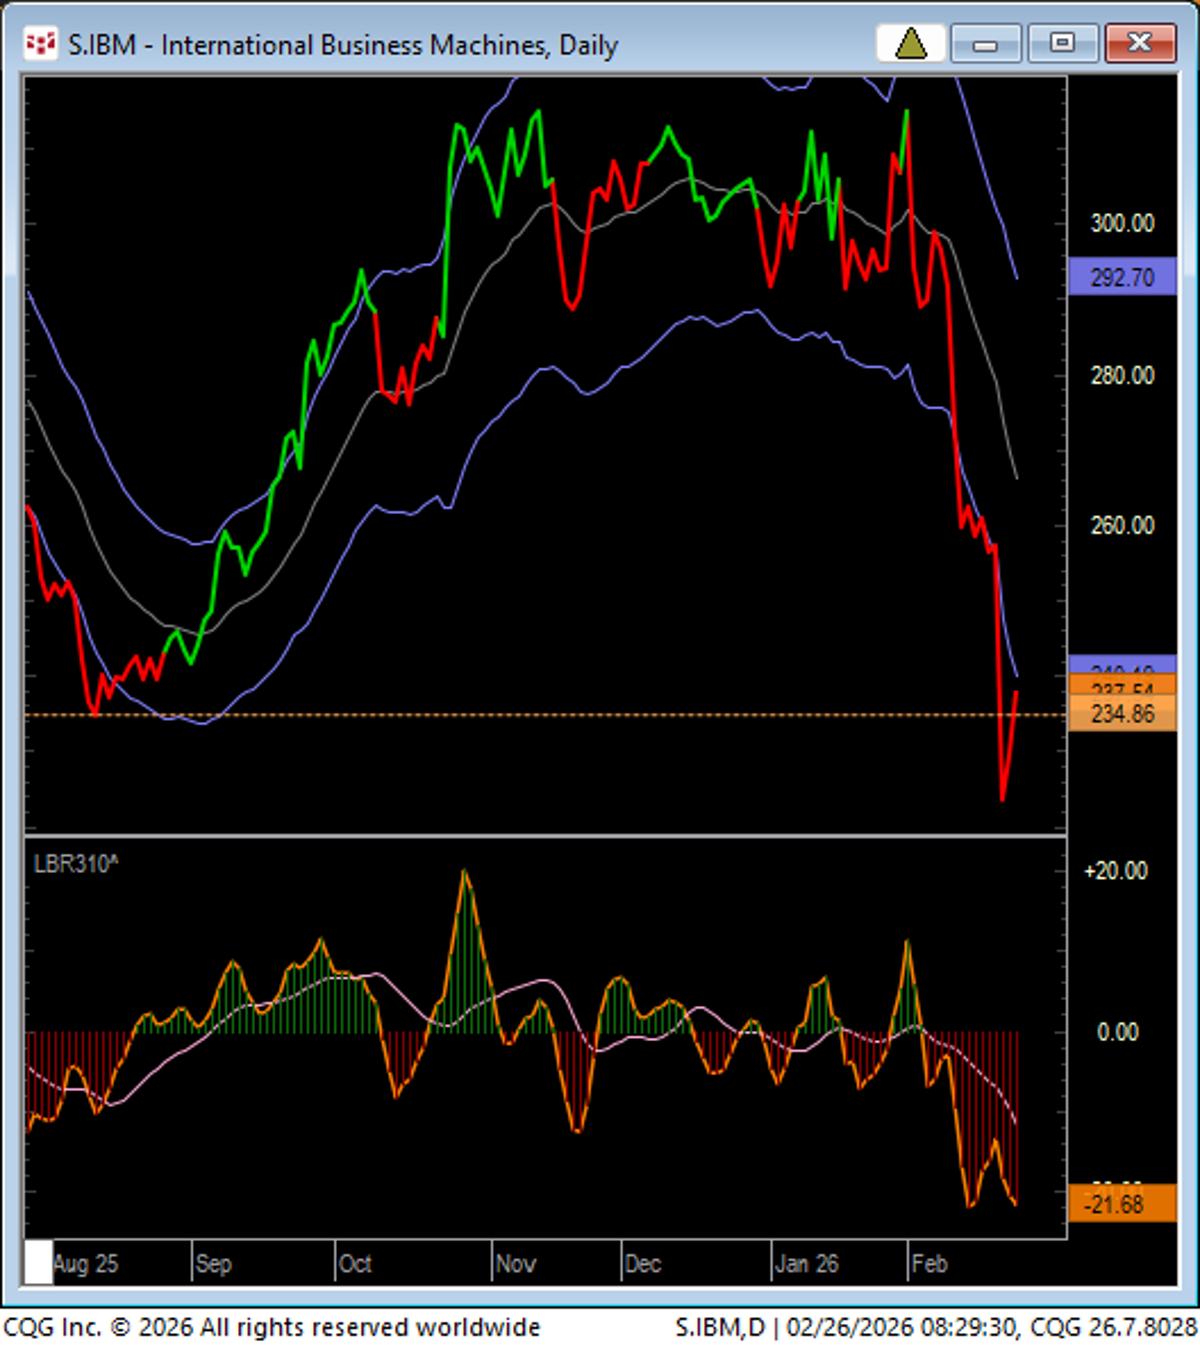
IBM Rebounds Above August Low, Showcasing Coil Breakout
IBM had close back above the low close in August. As an aside, the most notable thing about this line chart is the excellent example of the move out of the coil at the top or "sideways line". No...

2s10s Yield Curve Turns From Bull Steepener to Bear Flattener
anyone care that the 2s10s yield curve went from a bull steepener to a bear flattener this month?

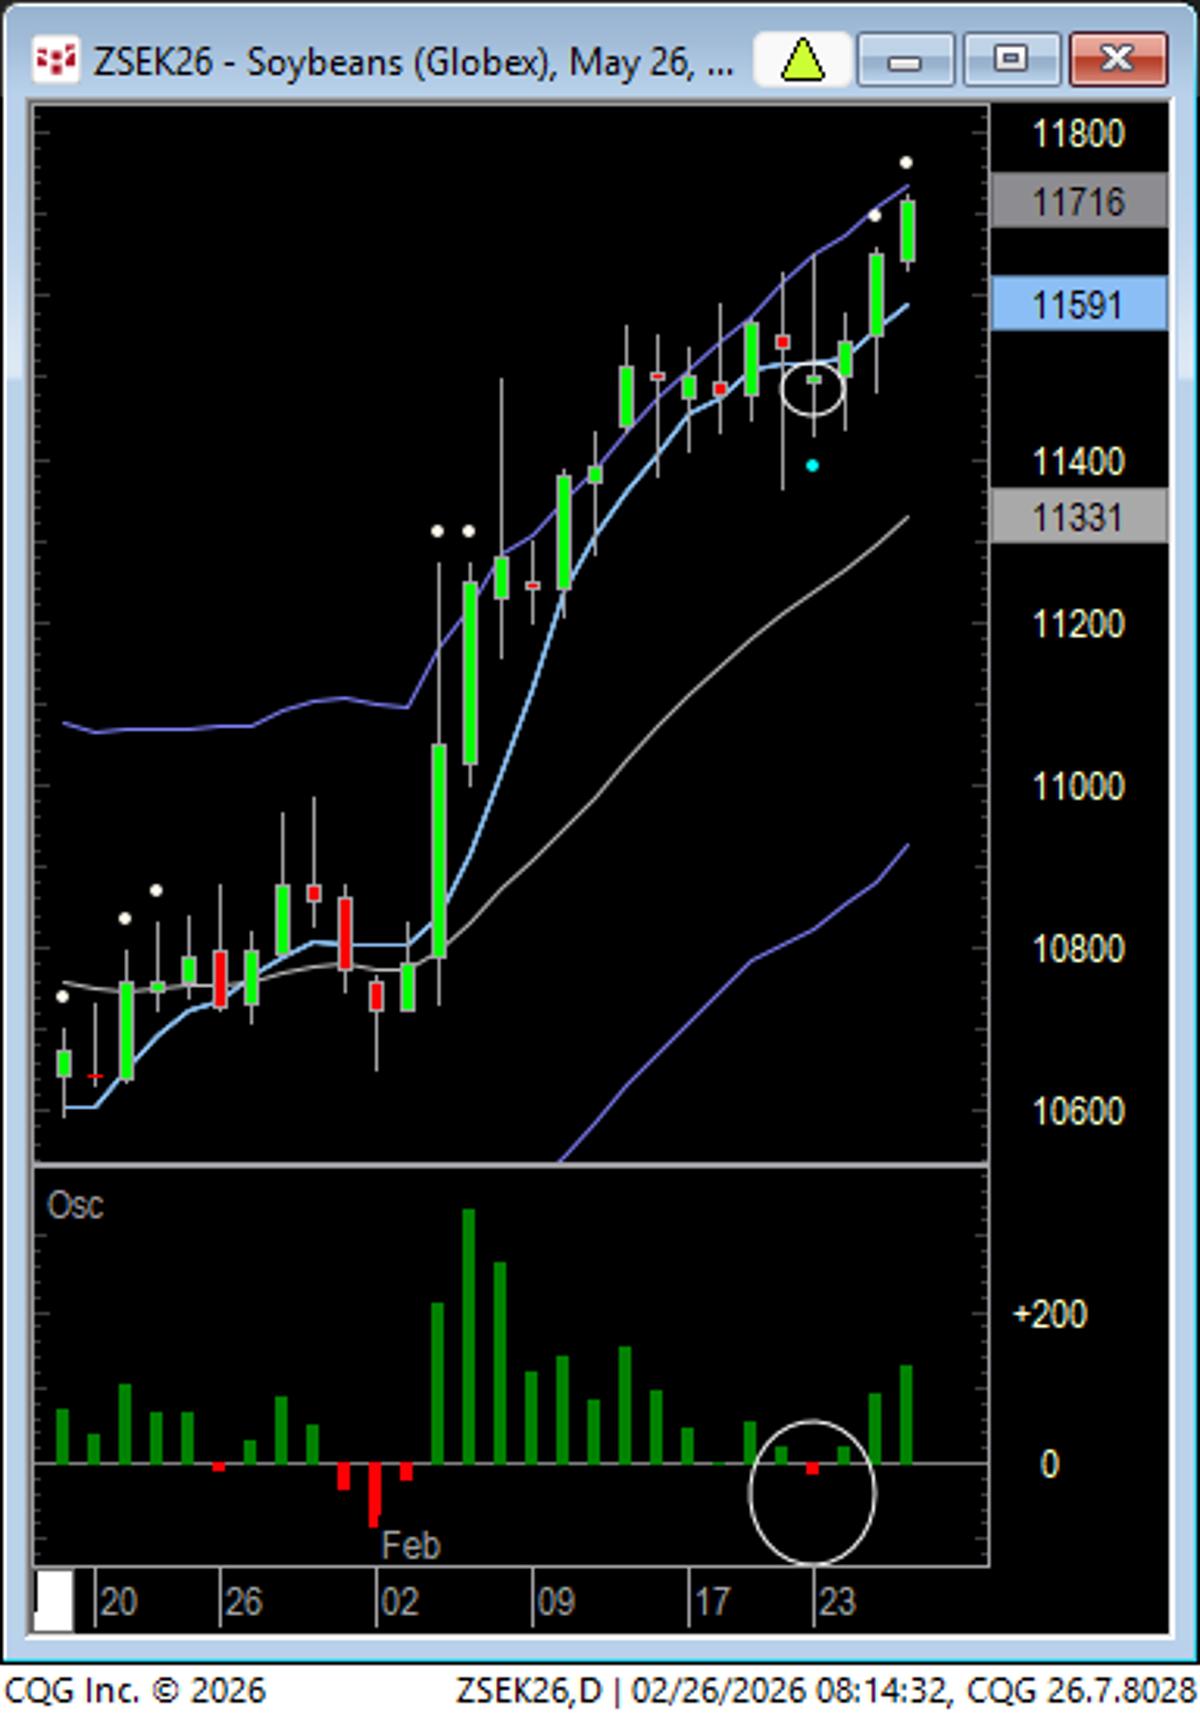
Soybeans Overextended; Funds Defend Upper Keltner Band
And for what it's worth, I even think the #soybeans are over extended here. Funds defended right at the upper keltner band yesterday, but wouldn't take much of a break to get below it leading to a possible break....
Beans Rally Post‑pullback, Breakout Confirms Uptrend
Beans still trucking after nominal pullback below 5 SMA. Yesterday was also an upside BO out of a "3-bar triangle". https://t.co/2ZNJQ8FBFP

Growth Stocks Show Early Signs of Resurgence
Since the beginning of the year, value-related stocks and the broader market (as seen by the Dow Jones Industrial Average, the NYSE Composite, the equal-weight S&P 500 ETF (RSP), Energy (XLE), and other defensive sectors) have performed better than growth...
Extreme Sentiment Spread Widening in S&P 500
New free article: Extreme Sentiment Spread is Widening $SPX #markets Link in reply below. 👇 https://t.co/V3H7WgpK62

Bitcoin's $65k Hold Boosts Software and Tech Prospects
A couple weeks later and Bitcoin has held that $65k area. If this turns higher (and I think it will), it will be a nice positive for software and tech. You know, the areas no one wants to own because...

Higher Jobless Claims and Fed Speech Dominate Thursday
Economic Calendar for Thurs. Feb 26th 8:30am - Initial jobless claims: Expected 216k; Prior 206k - Continuing Jobless Claims: Expected 1.86M; Prior 1.869M 10:00 - Fed’s Bowman speaks 1:00pm - 7 Year Note Auction: Prior 4.018%

Chart Reading Mastery Comes From Research and Experience
The ability to read a chart is a gift you can only earn through research and experience.

Focus on Optimizing Existing Strategy, Not Chasing New Ones
Once your strategy is working, stop looking for better strategies. Look to optimize what you already have. Chasing perfection will kill your edge. Protect what you've built through focus and discipline.
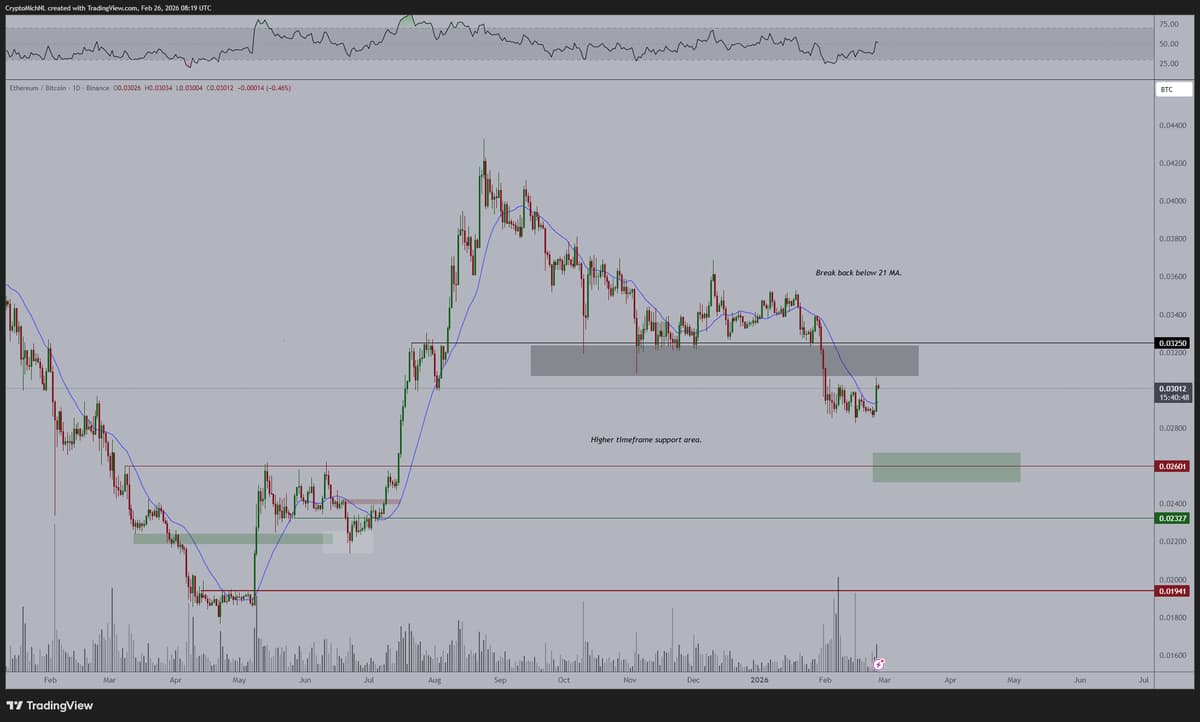
ETH Breakout Signals Rising Altcoin Market
The trend remains unclear, but $ ETH's move higher is a good sign. Ultimately, I'd like to see it clearly break through 0.03250. If that happens, it's a sign the markets are heading towards stronger #Altcoin prices. https://t.co/xClkrvC9CI
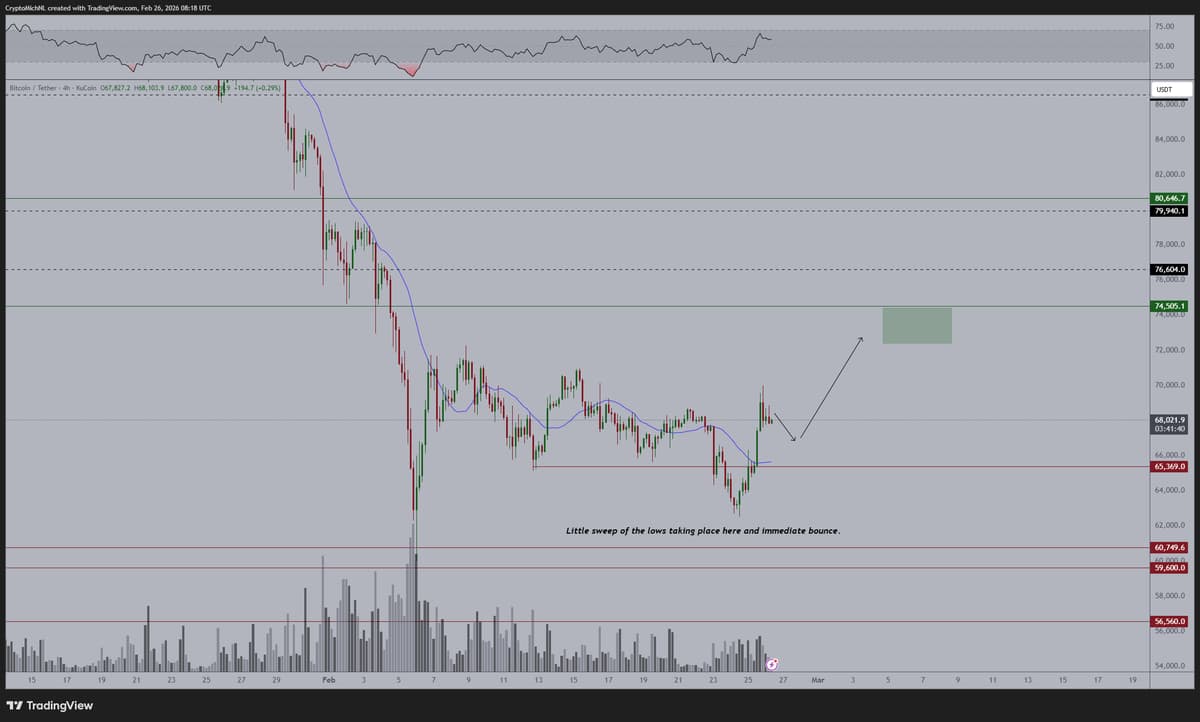
Bitcoin Resurges, Targeting $75K Rally by March
There we go, #Bitcoin grinds back upwards. Strong move and it's back into a lower timeframe uptrend. From that, I assume we'll start to see a rally towards $75K at the start of March. https://t.co/zfyGJh3xKV
Japan and Korea Hit Record Highs on Nvidia Rally
Asia stocks rally: Japan & S.Korea hit records as Nvidia lifts chipmakers; China/HK mixed, BOJ inflation data a risk. Trade: buy Korean memory names on pullbacks. 📈 — Viktor Kopylov, PhD, CFA More insights: t.me/si14Kopylov
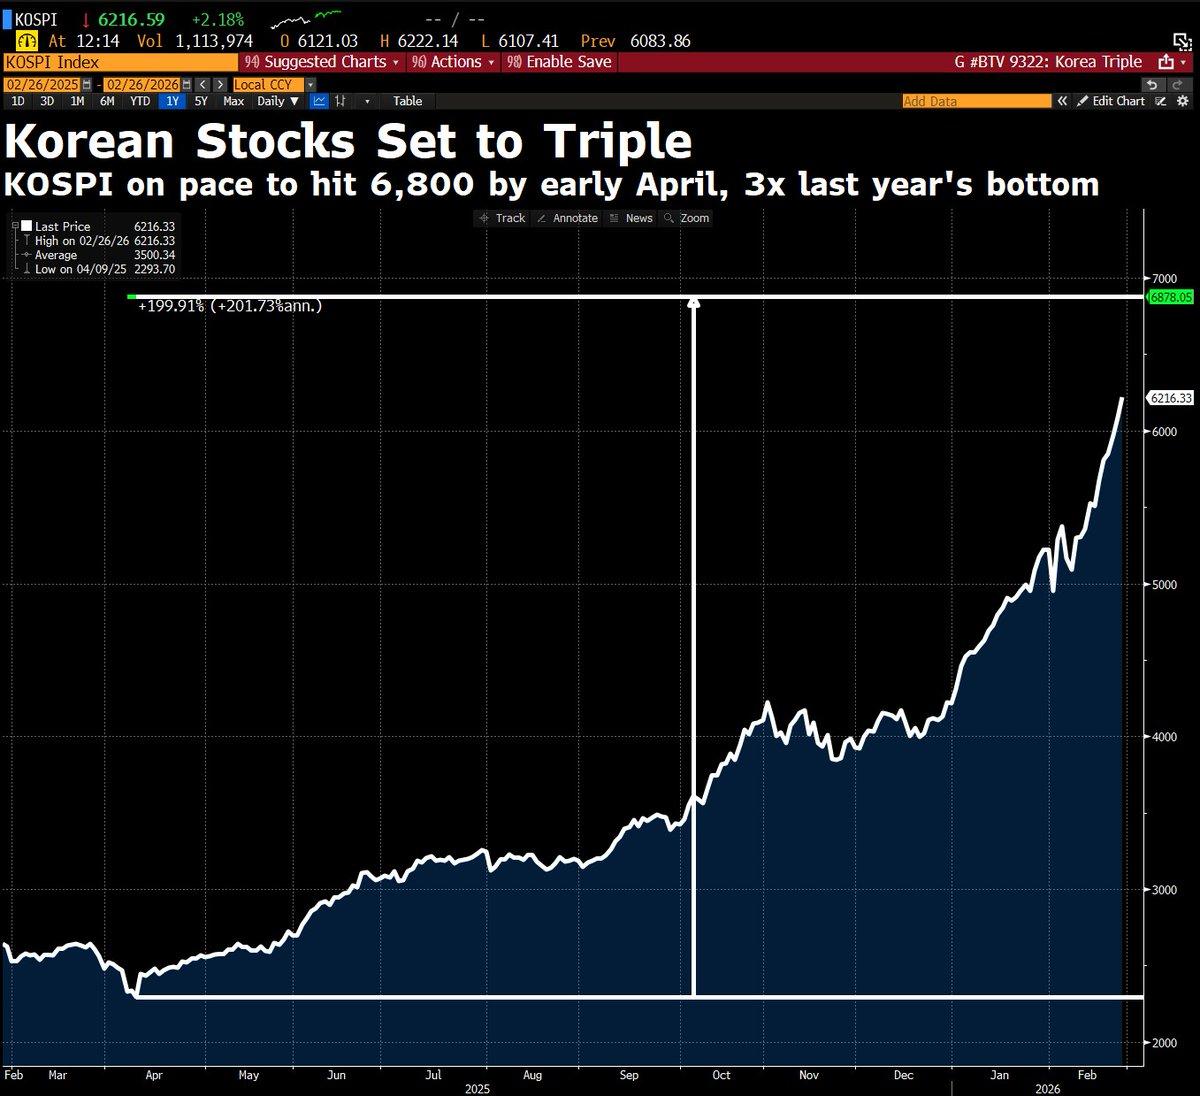
Korean Stocks Poised to Triple by Early April
Korean stocks are currently on pace to triple from last year's low by early April. 3X! Cray cray https://t.co/zYrHooCxrS

Amazon's $50B AI Bet Boosts NVDA Play
Macro: Big-ticket cloud/AI capital flows concentrate. Key: Amazon pledges $15bn now, $35bn tied to IPO/AGI. Risks: valuation/tech execution. Trading insight: Buy NVDA on AI infra demand. — Viktor Kopylov, PhD, CFA. More insights: t.me/si14Kopylov

Doubling on Profit Peak Is a Flawed Strategy
I love Claude, but it makes some really bad assumptions. For example. One strategy where the average holding period is 5 days. On the 5th day that is when the profits tend to peak. So the win rate on day...
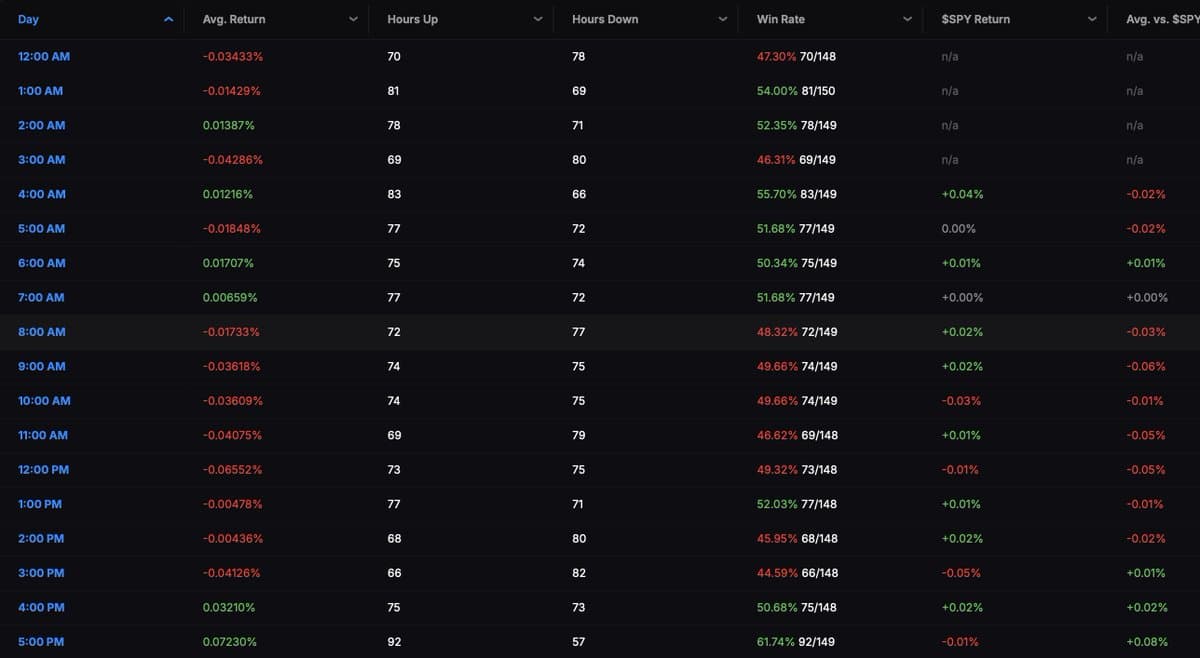
US Market Open Drags BTC and Equities Lower
Here is the hourly returns for $BTC since October. As soon as US markets open up, they'd pin it to lows and rape it all day. This negative whirlwind also affected US equities like clockwork https://t.co/8Xy4N6cYkt
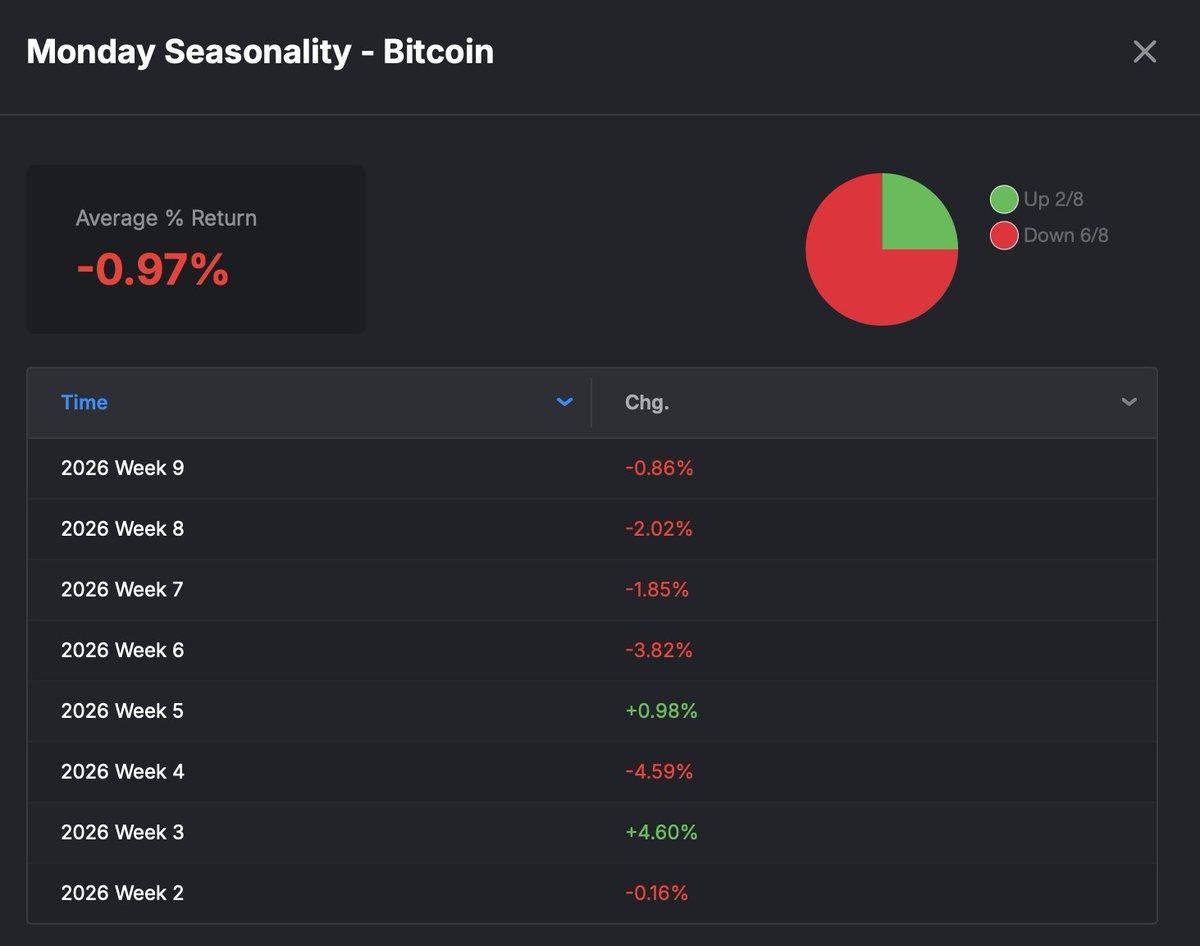
Jane Street’s Friday Puts Trigger Monday BTC Crashes
What the scum at Jane Street was probably doing was buying puts on $IBIT on a Friday and then crucifying $BTC when US markets opened up on Monday. That is the returns for $BTC on every Monday in 2026 https://t.co/h4GTmfLL7O

Stop Bad Timing: Fix Missed Opportunities
Ever take a perfect setup just to watch it go nowhere? Then it moves right after you exit? That's not bad luck - it's bad timing. Learn how to fix that https://t.co/fjBDMYb0AE https://t.co/8b9qHMu9bF
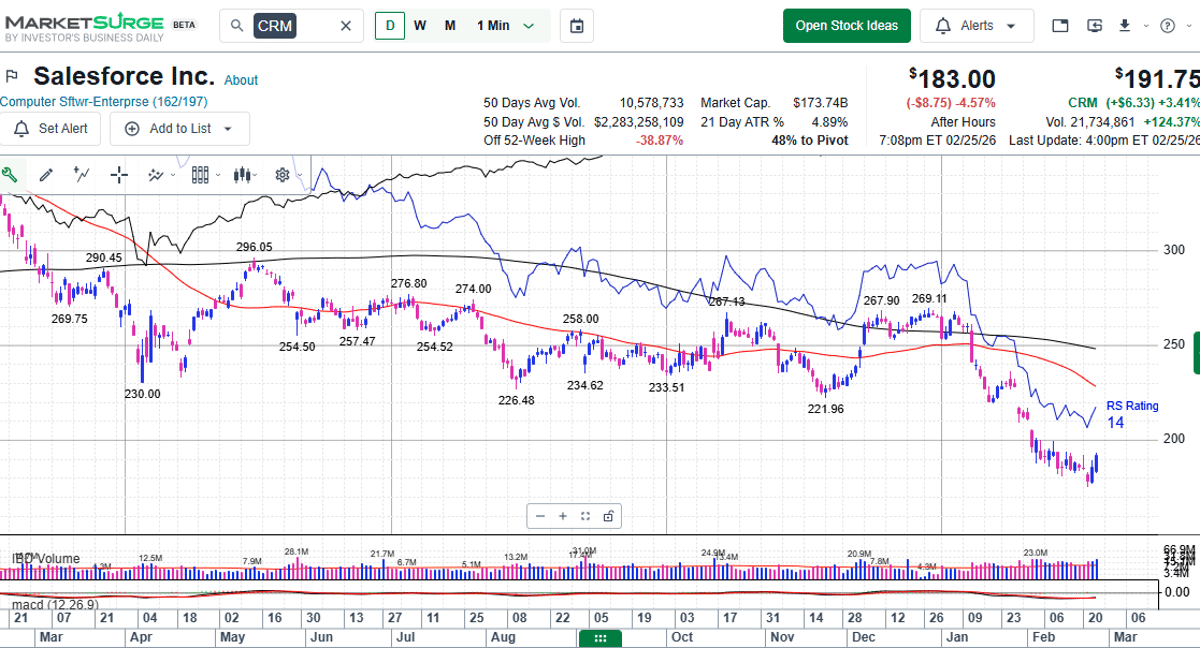
CRM Poised for Bounce; Dip‑buyers Eye Software Long
$CRM - Despite the post-mkt selling, CRM looks poised to bounce in the weeks ahead & i suspect Dip-buyers can finally position long in Software for some mean reversion vs market and also vs. Semis @IBDinvestors @marketsurge NEW Beta...
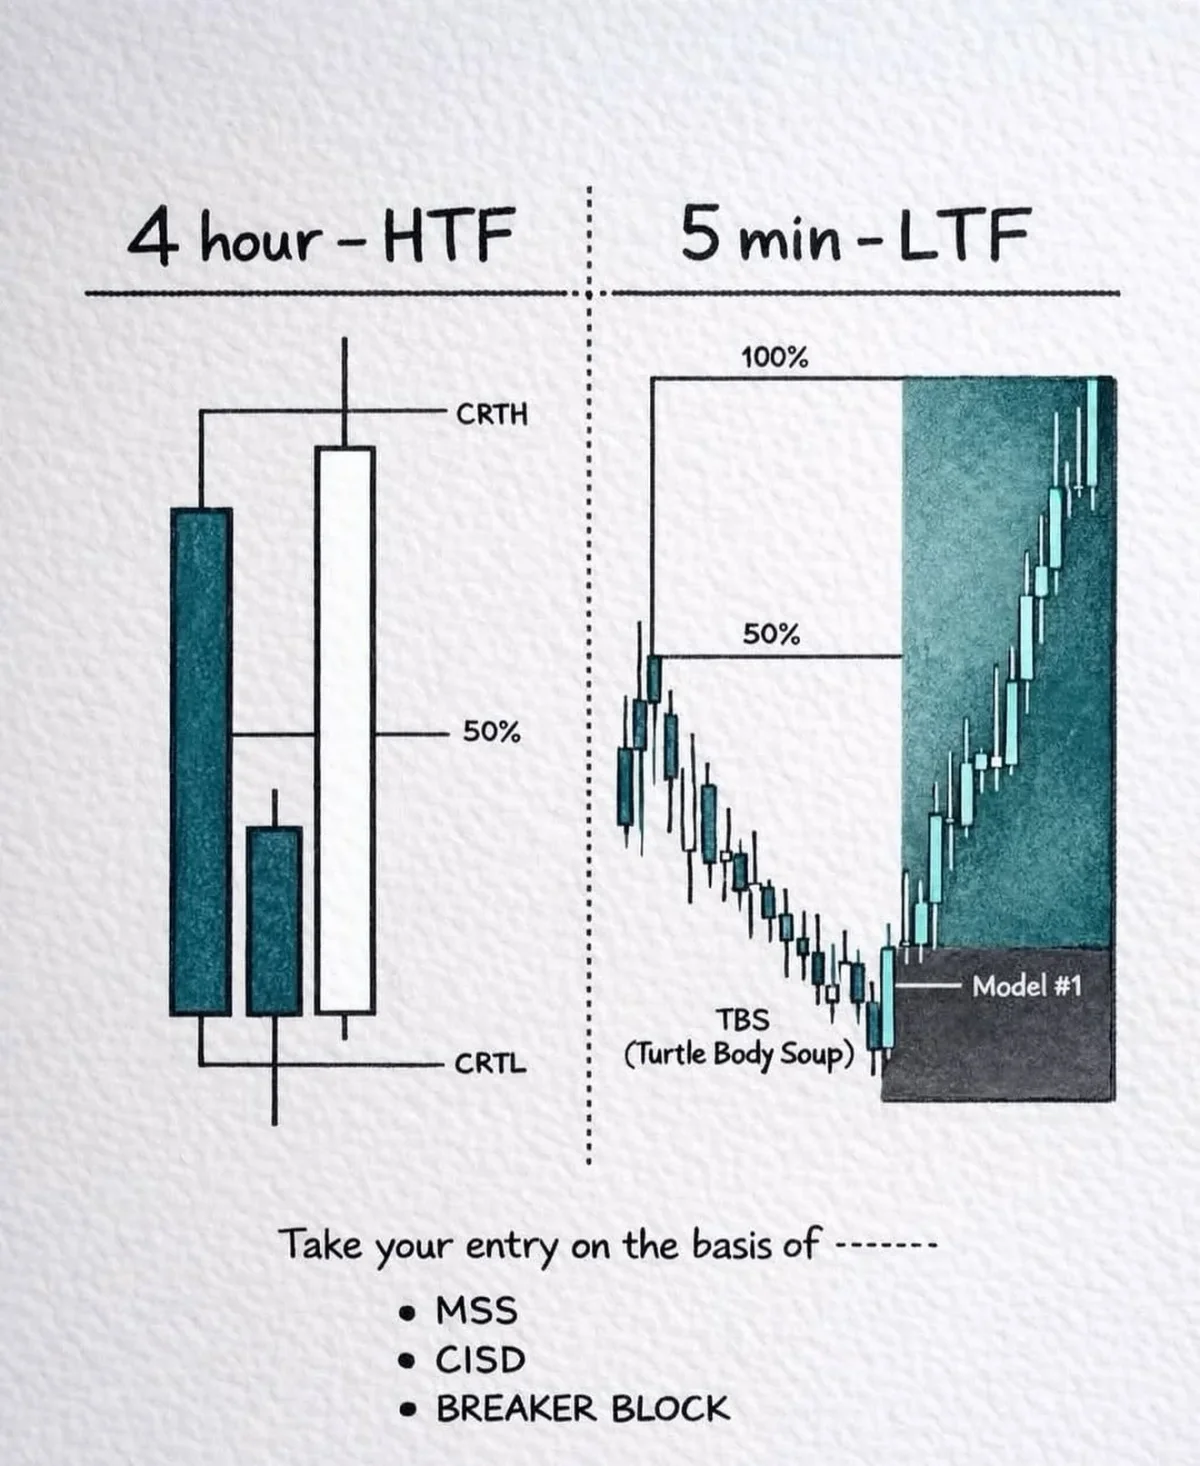
Combine HTF Trend with LTF Entry After Liquidity Grab
4H HTF = trend. 5min LTF = entry. Price hit 100% retrace, grabbed 50% liquidity. Model #1 + TBS = entry trigger. Wait for MSS, CISD, then enter at Breaker Block.
Small‑cap Rally Signals Leadership Rotation, Not Squeeze
Small caps just hit record highs. While everyone chases mega-cap AI, leadership may already be rotating. That’s not a squeeze. It’s a signal. @JDHatfield_ICAP @InfraCap explain why it matters: https://t.co/11ZhJg1jL3

Day Two Tech Bounce: Nvidia Holds the Key
We are in Day 2 of this toga party in oversold tech bounce chases - if NVDA doesn't muck it up.
NVDA Still Flat After Stellar Earnings, Beats Whisper
I’m surprised that $NVDA isn’t up big time after that masterpiece. Crushed the whisper, too.

Nvidia's Prolonged Rally Ends without Dramatic Swing
FWIW - After the kind of prolonged coil that we've seen with Nvidia since the summer, you would expect to see a dramatic move up or down as the tug of war between the bulls and bears is resolved. We didn't...

Nvidia's Explosive Q Growth Sparks Derivative Buying Interest
A great $NVDA Q with TR up 73%, DC growth up 75%, Compute up 58%, Networking growth up 72%. Only issue is it is well owned and sell side buys at 78%. Who is the incremental buyer? ...
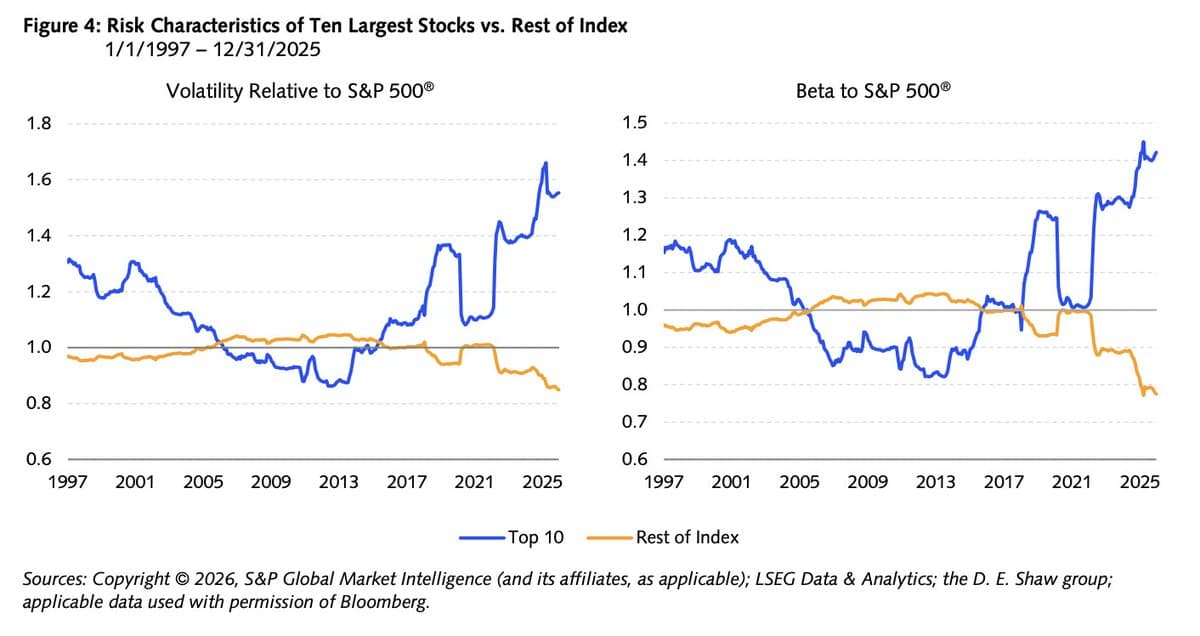
Big‑Cap S&P Leaders 50% More Volatile Than Index
The top 10 largest stocks in the S&P 500 are 50% more volatile than the S&P 500 itself right now. Important for risk... but more important for alpha right now. https://t.co/yqBR2QU8nK
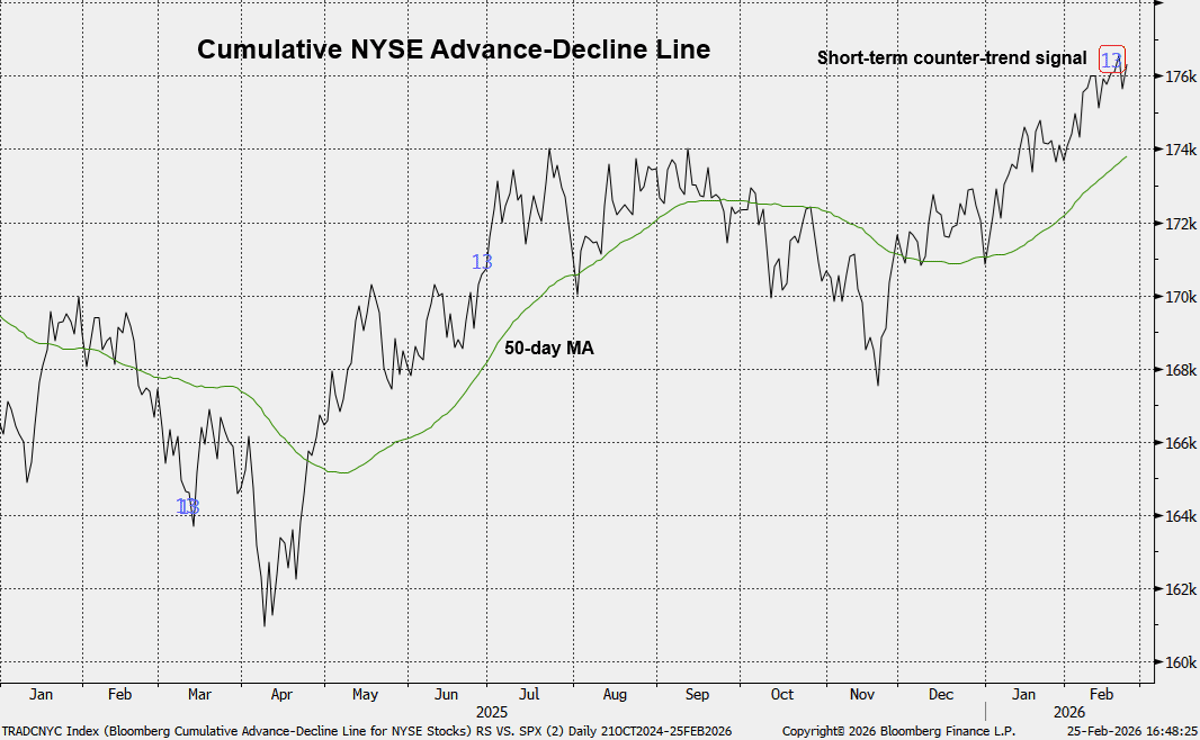
Narrowing Breadth Signals Megacap Recovery Pressure
Breadth looks set to contract near-term per the A-D line, but that's not necessarily bearish. It just puts more pressure on the megacaps to stage a relative recovery #fairleadstrategies https://t.co/bbTJhh0egy

Home First Finance Sells ~7.1M Shares At
BLOCK DEAL ALERT Home First Finance Offer Price ₹1246.8 to ₹1185 per share upto ~7.1mn shares; ~6.8% of current TSO #blockdeal #SocialMedia #Stocks #NSE #BSE
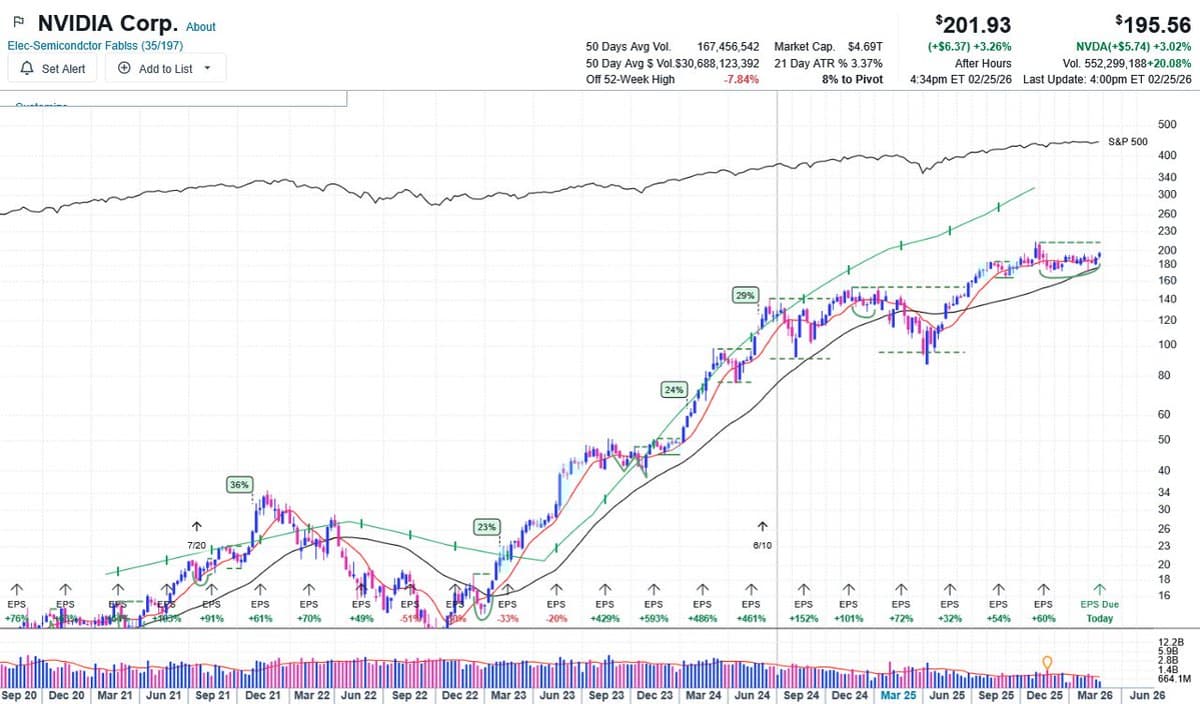
NVDA Posts Strong Weekly Numbers, Threatening Multi-Month Base
$NVDA @marketsurge #IBDPartner weekly -- solid numbers, enough for the king to leave this multi month base? https://t.co/lfP3O0srcn

AI Webinar Shows How to Spot Catalysts and Top Stocks
I just posted my @Deepvue AI Webinar where I demo how to: ✅ Find Catalysts ✅ Find Leading Stocks ✅ Analyze Themes ✅ Analyze Market Conditions Retweet 👇 https://t.co/Aa5sIh7RUR

DAX Holds Near ATH, Bullish EMAs Signal Potential Rise
#DAX small Up Candle and Sideways. Resistance ATH 25508. Support 24793, 24266. RSI 56 bit off Neutral. 13/21 day EMAs Bullish. Top Bollinger Band 25345. Midpoint Line 25030. Bottom Band 24721.
QQQ Holds Above 100‑Day MA, Eyes NVDA Earnings
$QQQ - Closed above the 100 day MA after a big up day. This marginal close above the 100 DMA with a big gap is fishy but it remains to be seen what happens tomorrow after NVDA earnings. If it...

Prioritize Risk Management Over Bottom‑Fishing Strategies
Bottom fishing gets a bad rap. Define your risk and swing the bat. Failed breakouts tend to have very large drawdowns just like failed bottoms. Risk Management > Everything Else

AI‑driven Stocks Like $TRI Can Spark Sharp Rallies
Right Tail Right Now😉 I set up why AI-pressured names like $TRI can stage sharp reflexive rallies And boy did it: +25% We covered lots of chase plays as well as my timing for next wave of volatility within a still fragile market...
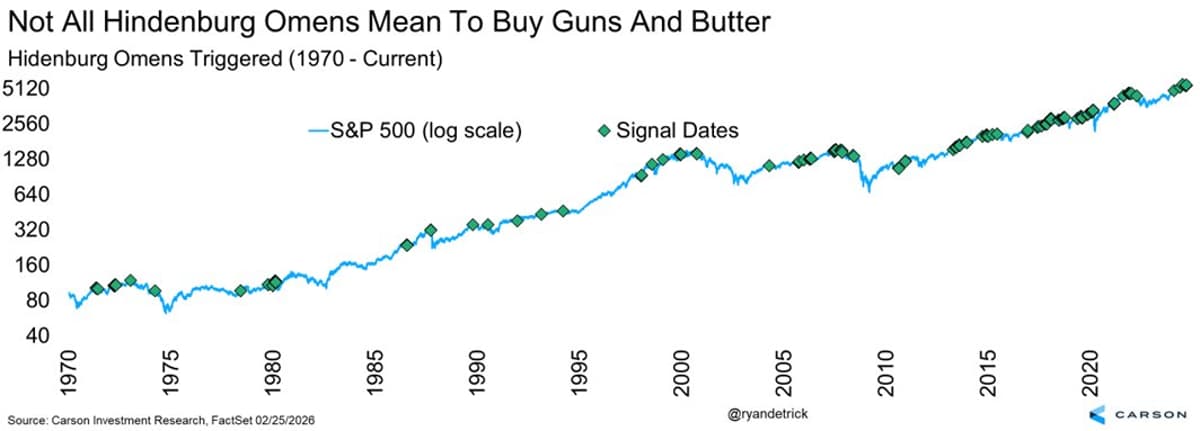
Don't Overreact to Hindenburg Omens at Market Peaks
Yes, some Hindenburg Omens triggered near major peaks. But a lot didn't. Don't get sucked into this clickbait. When semis are at ATHs, don't get too bearish. https://t.co/zLh8chvvQx

AllINsync Pool Surges 12% YTD, Beating Benchmarks
just received news that our #AllINsync pool hit a new high yesterday... YTD % change: #AllINsync: +12.0% $TSX: +7.1% $SPX: +0.7% 50/50 benchmark: +3.9%

Hindenburg Mentions Rarely Signal Imminent Market Bottom
Similar to the November lows, when they all start saying the word Hindenburg often, you know we are close to lows. We've seen 225 Hindenburg Omens since 1970 and if you look closely you'll see the great majority of them...
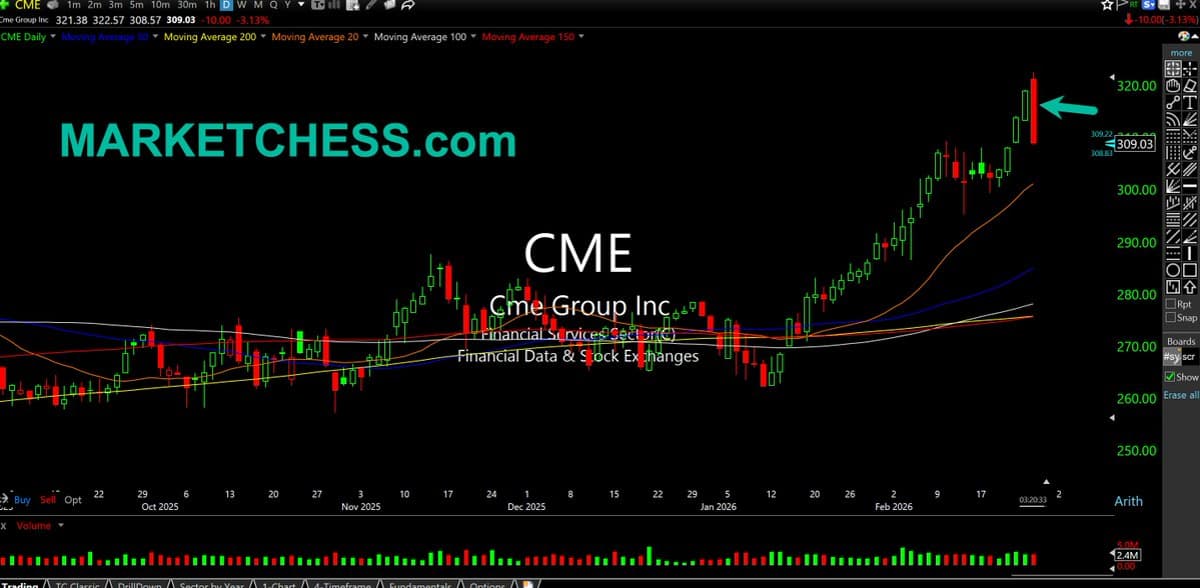
CME Shows Classic Bearish Reversal After Glitch
$CME Daily. CME putting in a classic bearish reversal candle today after exchange suffered glitch. But stock was due for a fade/consolidation: Steep on all timeframes. https://t.co/125tPQVBPX
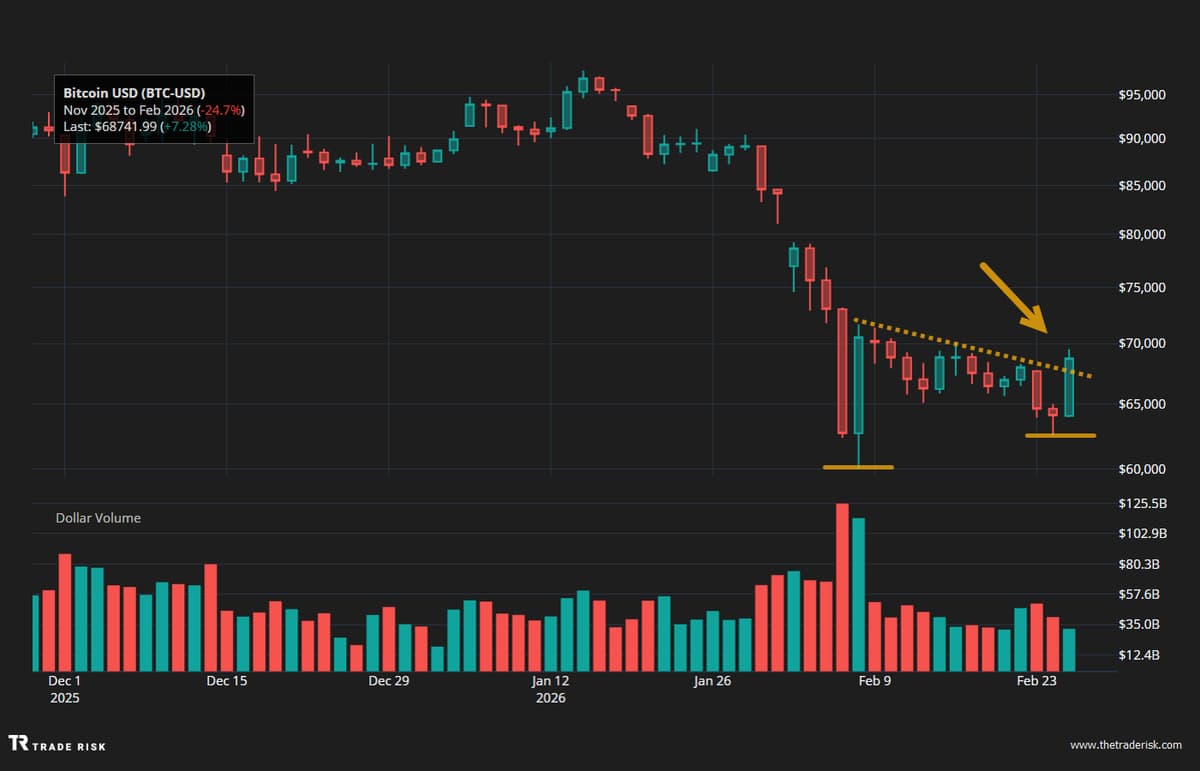
Targeting $70K+ Weekly Close for Bitcoin
Finally got something a bit more promising to look at short-term in Bitcoin and crypto more broadly. 70K+ weekly close would be the ideal next step $BTC $IBIT https://t.co/6FO7Dx0Cfx

S&P 500 Rises Ten Consecutive Months Amid Fear
The S&P 500 is currently up on the month on a total return basis. This would be 10 months in a row stocks were higher. It is simply amazing how much fear and worry we are seeing with this happening.
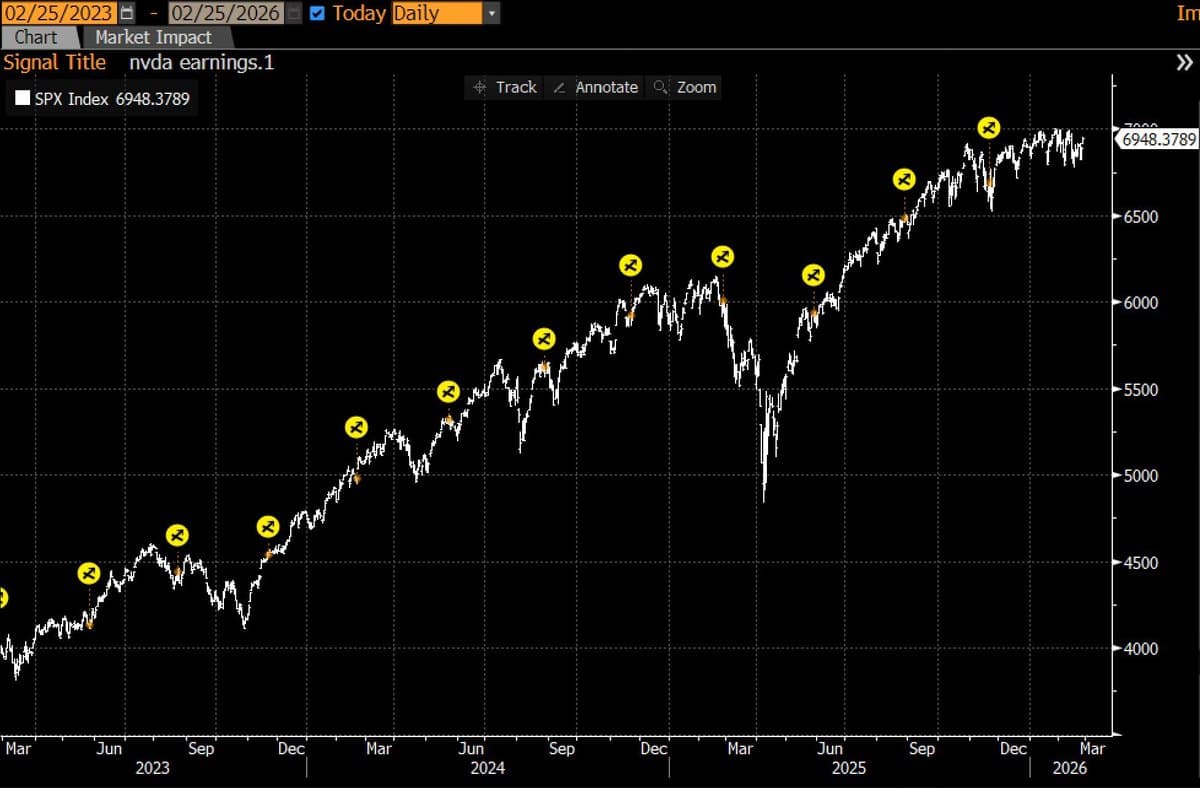
DSData: Cheapest Real‑Time Analyst Beats AI on SPX‑NVDA Insights
Better than AI we have DSData powered by @DanielSimonyi details in pinned tweet Cheapest reasearch analyst on the planet. Client prompt "have you looked at how spx moved with prior NVDA earnings reactions? on train so can't look closely, but...
AI Panic Bottom Hits; Workday Setups Emerging
the software AI panic bottom was earlier this week. i'll post a few charts and some of the better setups we discussed today in the pre-market meeting. $WDAY
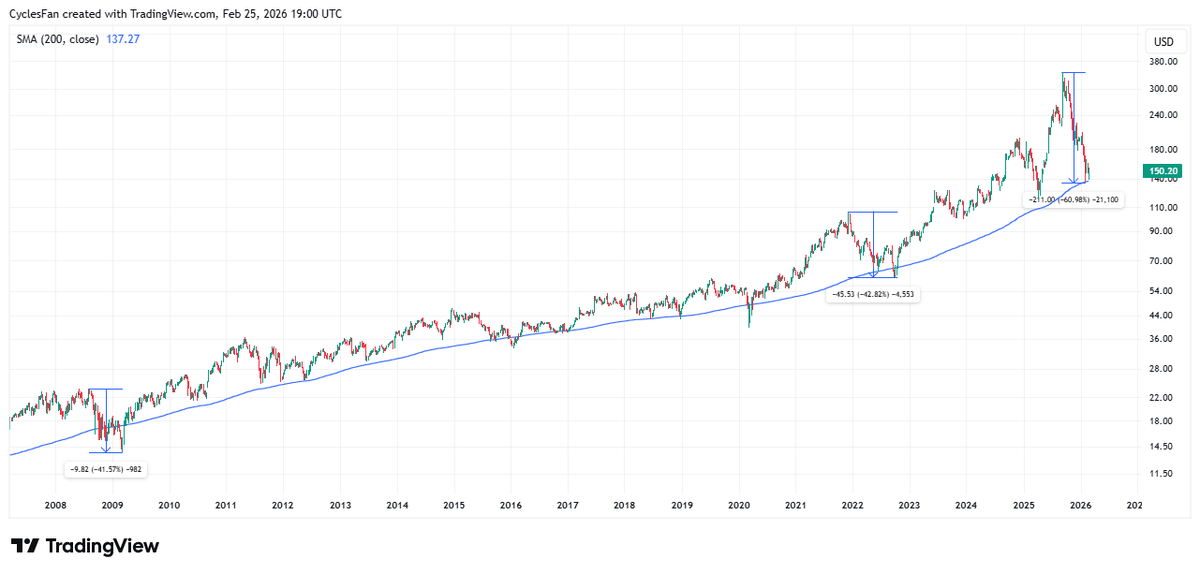
Oracle's 61% Drop Signals Bear Market Near End
$ORCL - Bottomed at the 200 week MA in early February. The 5 month crash from September to February was significantly bigger than the 2008-2009 and 2022 bear markets in which the drawdown didn't surpass 43%. The drawdown of the...
NVDA Lagging Hints Market Top, yet Breaks Out Pre‑earnings
using Nvidia $NVDA is lagging the market as a supposed sign of a market top is what it is... but seeing them break the stock out ahead of earnings? markets are fun...