
Massive SPY Put Purchases Drive Significant Gains
Top April 2nd (W) positioning form Hawk Database... SPY puts have seen massive buys since early March and are up significantly https://t.co/I2kbzAFe3I

Sugar Prices Poised for Explosive Breakout, Societal Impact
Sugar prices are just starting to move after rebounding from a key historical support level. This could turn into a highly explosive move in my view Few assets carry such significant societal implications if they begin to rally. Similar setups here: https://t.co/Z2VnzWMQwd https://t.co/u0ocJ7NrVj
Market Bottom Unlikely This Month, Likely in 2‑6 Months
Did a lot of tinkering this morning with backtests. Takeaway? Bottom not likely in the next month - much more likely in 2-6.
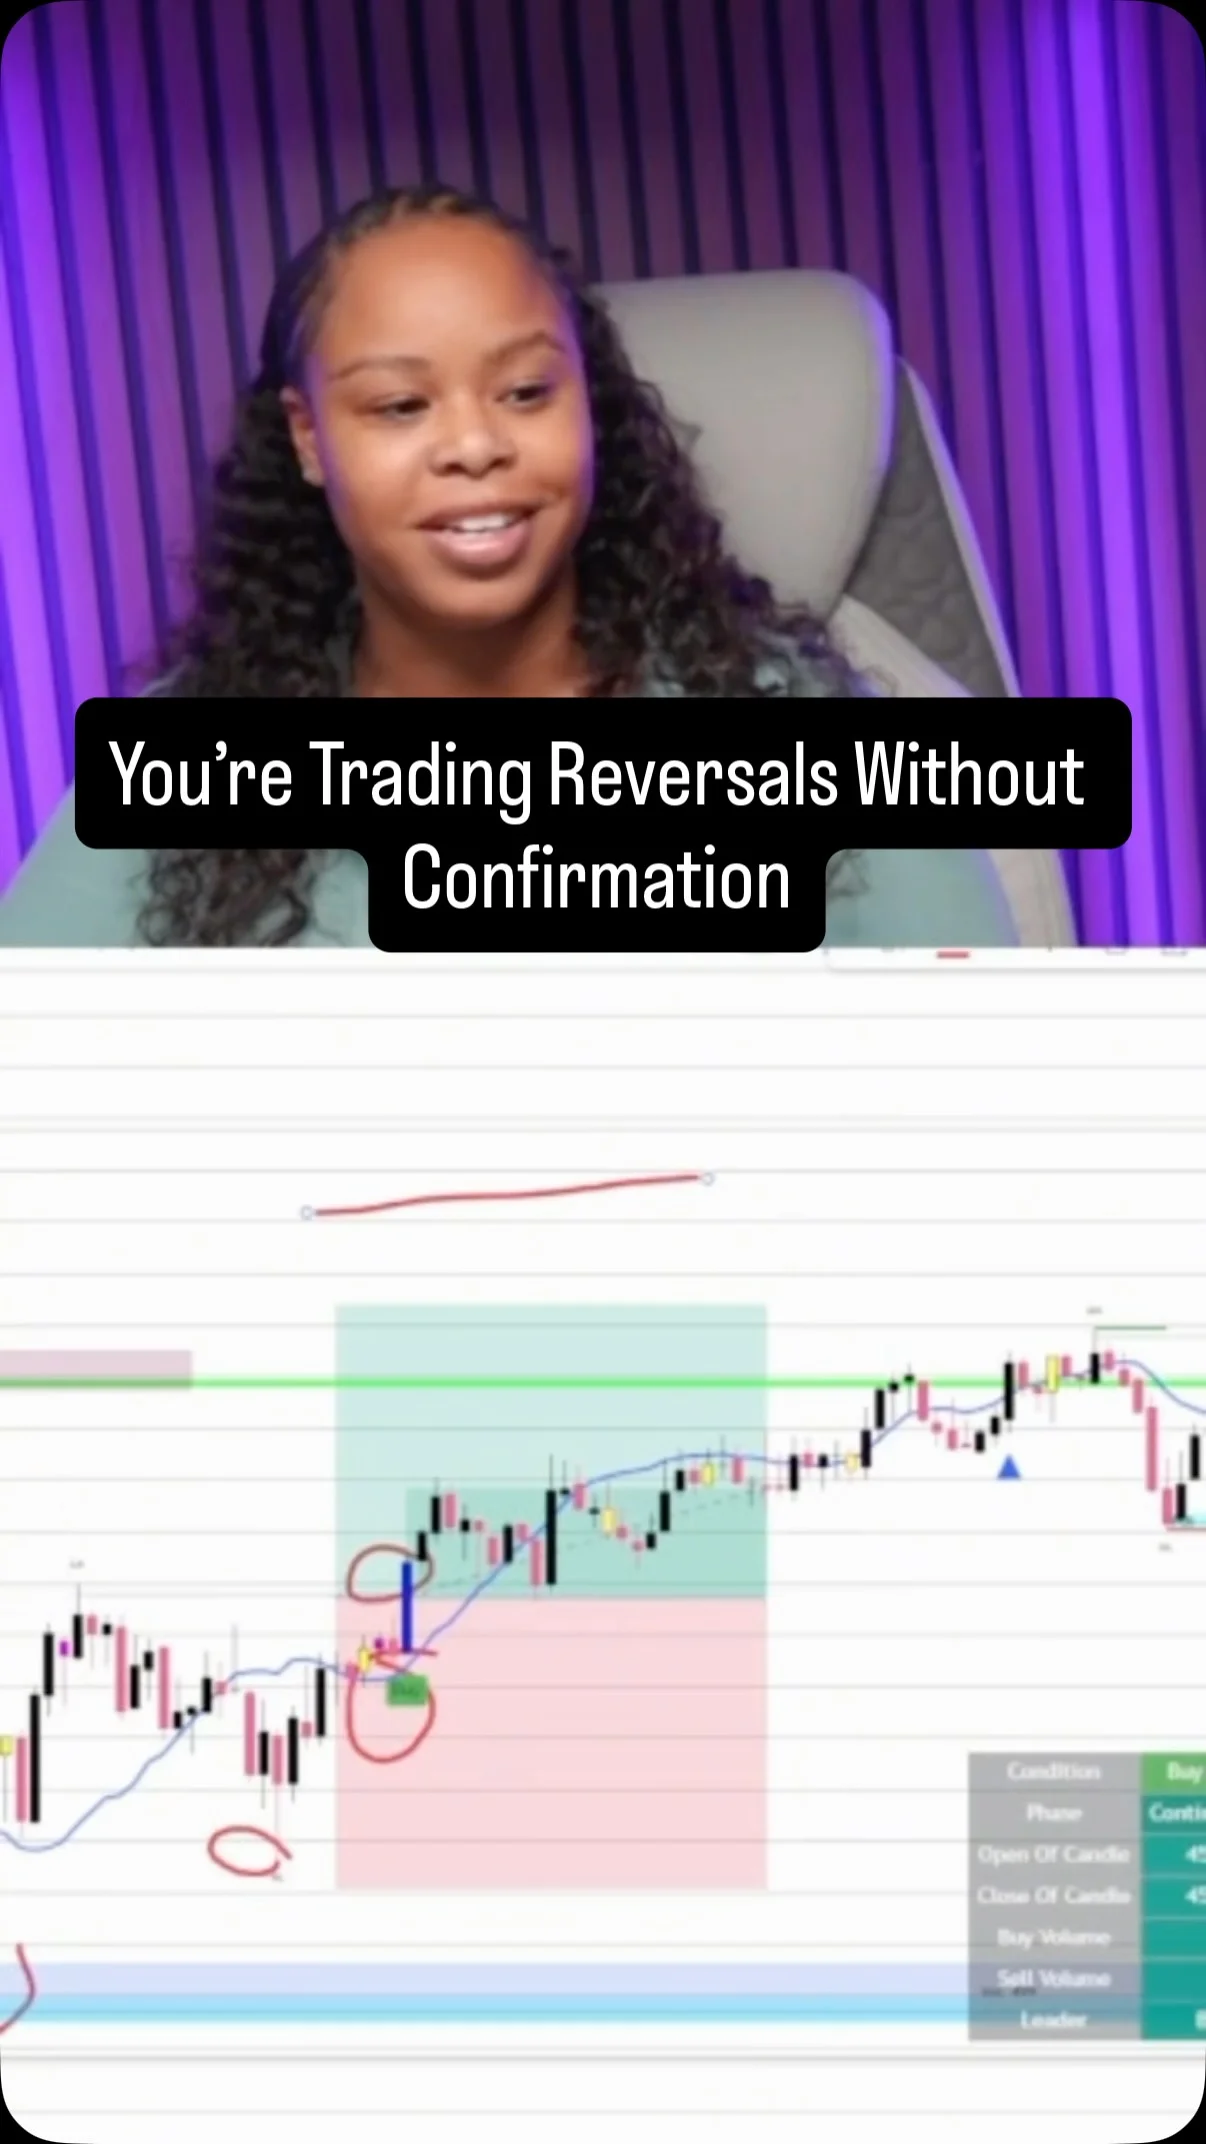
Break Market Structure Before Reversal, Not Just Zone Tap
Most traders try to catch reversals the moment price taps a supply or demand zone. But that’s not how a real reversal works. You need to see a shift in market structure first. Something has to break. Then when price comes back into that...

SolarEdge Revives Amid Tough Swing‑long Market
Not an easy environment for swing longs, but there are still small pockets of stocks working. SolarEdge seen here on @IBDinvestors MarketSurge is one of them coming back from the dead over the last few quarters. #IBDPartner $SEDG https://t.co/OvmfGgTEJi

200‑WMA Distance Trades: High‑risk, Low‑probability Longs
1 year later. 200 WMA distance stuff obv isn't always perfect but it's def one of the higher risk or say low probability longs that tend to occur when everyone gets bullish as well (crowd sorta can no longer deny it...

Market Signals Beats S&P: Small Weekly Loss, YTD Gain
Weekly Market Signals ensemble -0.8% this week vs. -2.1% for $SPX. +0.2% YTD vs. -7% for SPX. Details in reply below. 👇 https://t.co/6cQUuOUhsI
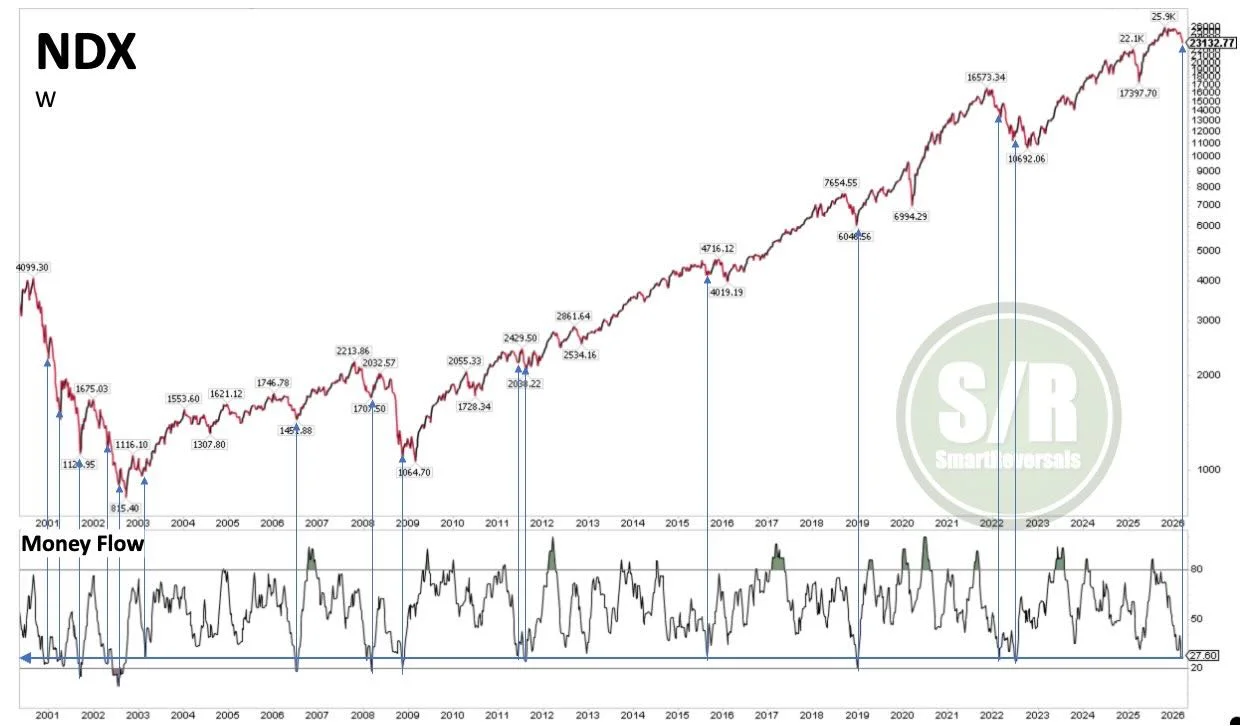
MFI at 25‑year Lows Signals Imminent Relief Rally
#NDX: Over the last 25 years, a relief rally has followed when the Money Flow Index reached current levels. There have been no exceptions, including the dot-com bubble in 2000, the 2008 Financial Crisis, and the 2022 bear market. The...
VIX Spikes on Gains Too, Not Just Losses
The VIX should spike on up days like it does down days. Volatility doesn't just happen one direction.
Stagflation Era Begins: Overweight Energy, Trim Tech
US Equity Market Weekly Report - Week Ending March 28, 2026 Markets just hit their longest losing streak since 2022! Nasdaq officially in correction, oil exploding past $100, and three brutal shocks (Iran, China trade, and tech capex) turning stagflation into the...

Oil May Rally to $109 Before Confirming Top
$USOIL - As I've already stated I think it made a major top at 119.48 but the top will not be confirmed until there's a weekly close below 90. The weekly candle is bullish and indicates that it may rally...

Silver Poised for Short‑term Bounce, Bull Market Ended
$Silver - Made a multi week low at the yearly pivot at 61. I expect a multi week bounce into late April/early May. The bounce could get to as high as the 1st yearly resistance at 94. The bull market...

Gold Poised for Multi‑week Bounce to $5,028
$Gold - The weekly candle is bullish and indicates that it made a multi week low this week. I think it made a major top in late January and is following the 2011 price pattern. I expect a multi week...

VIX Above 30 Signals Market Turbulence Ahead
VIX closed at 31, its highest weekly close since last year’s tariff sell-off. When $VIX holds above 30, things tend to break. In this episode, we talk through exactly what we’re watching and how to navigate this environment. Watch: https://t.co/WlGqDNQSk1 $SPY $QQQ...

Buy Market-Driven Drops, Not Market‑moving Losers
Winners in this market are really winning. Great chart from @AriWald this AM showing high beta winners (high momentum) reaching a new cycle high vs high beta losers (low momentum). "We like to buy stocks dropping because of the market,...

Trade Pullbacks at New Highs, Rallies at New Lows
“Buy the first pullback after a new high, sell the first rally after a new low.” — Linda Raschke https://t.co/zMHrNzYgBM

Hermes Gains Buzz, Poised for Breakout Weekend
I'm seeing so many positive messages about Hermes. Is it about to have its breakout weekend like Open Claw did a couple of months ago?

Chinese Stocks Show Resilience, CSI 300 Leads Surge
Chinese stocks will be relatively resilient amid the March selloff. Heard this view a lot on shows this entire month. It's turned out to be on the money. CSI 300 is set for biggest monthly outperformance since middle of last year...
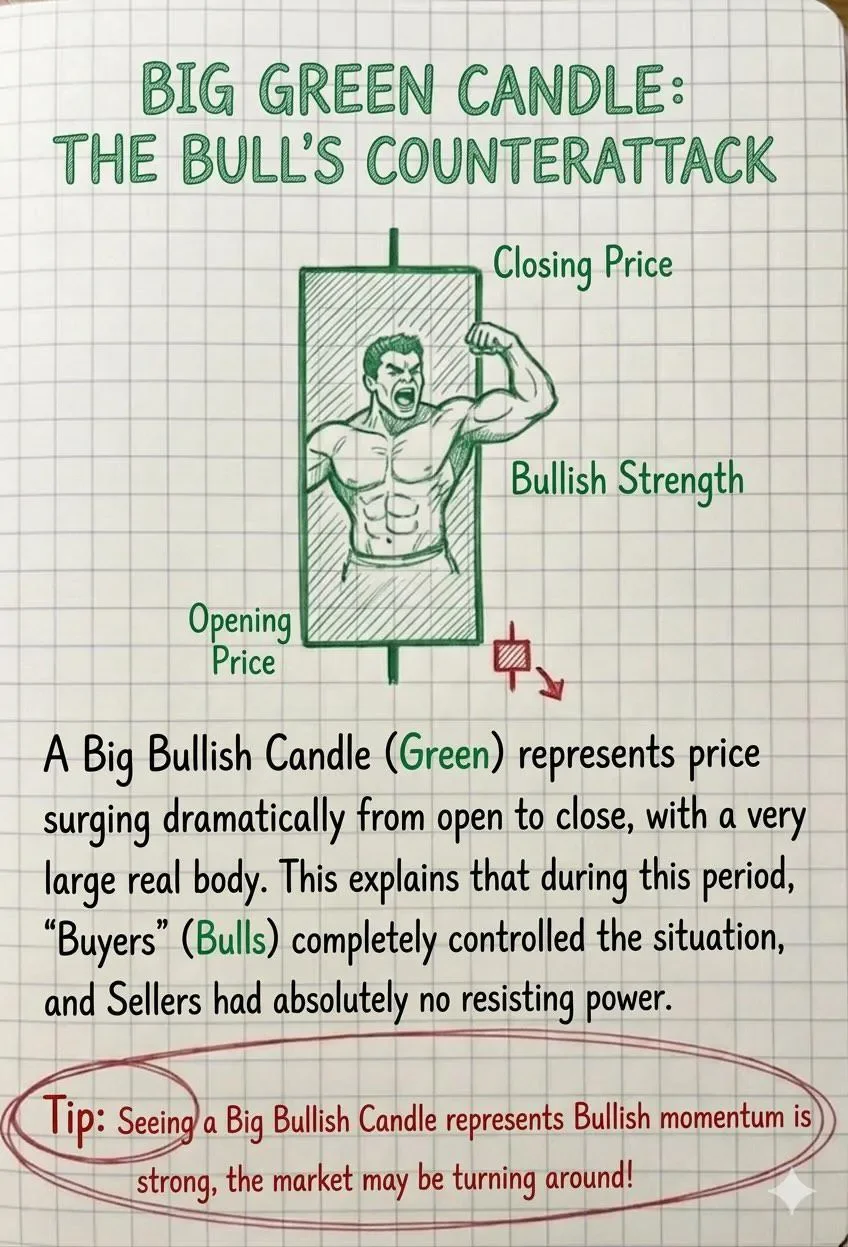
Big Green Candle Signals Bull Counterattack and Short Squeeze
BIG GREEN CANDLE: THE BULLS COUNTERATTACK 📊 Aig Read: The Trampling of Shorts 📊 The Real Body of a K-Line The Secret of Energy 📊 The Shadow of the K-Line : Traces Traces of Struggle 📊 Doji Star: The Face of Indecision 📊 K...
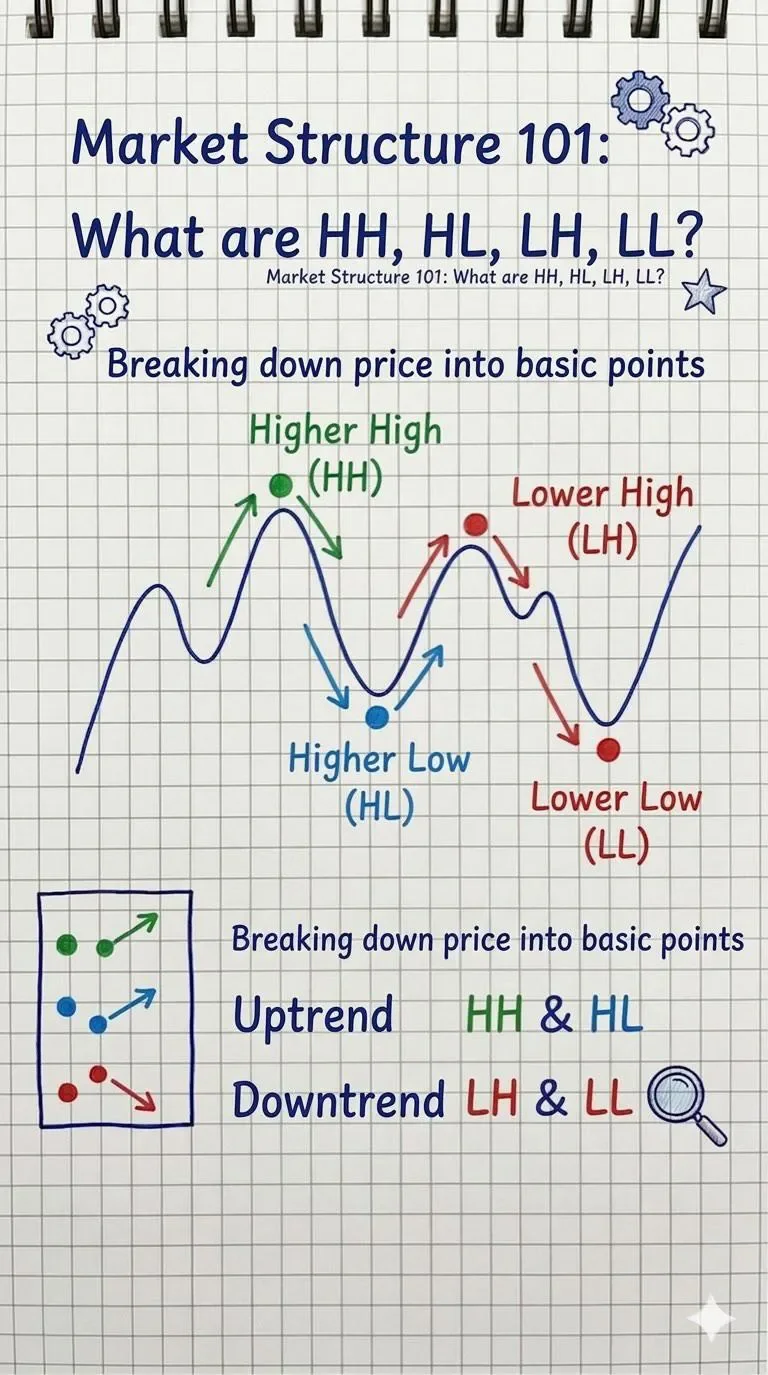
Identify Higher Highs, Lower Lows and Breaks
What are HH, HL, LH, LL 📊 CREATE HIGHER HIGH & HIGHER LOWS📊 Lower High & Lower Lows📊 Prince Stuck in "MUD" 📊 (Break of Structure-BMS) 📊 (Break of Structure-BMS) 📊

ARK Pivots From Chips to Biotech, Trims High‑beta Semis
Macro: ARK shifts from semiconductors to biotech. Key: sold ~$38M NVDA; bought $0.34M ARCT. Risk: tech momentum reversal. Trade: trim high-beta semiconductors. — Viktor Kopylov, PhD, CFA More insights: t.me/si14Kopylov
7-Day System Turns Trading Guesswork Into Clarity
From confusion to clarity in 7 days. ⚡ No more bouncing between strategies. No more guessing. Just a system that made sense… and actually worked in real time. That’s when everything changed. 📊 #TraderLife #Futures #VWAPWave

Consider Extending Your Long VIX Position
Well worth a read. I've been long VIX for a few weeks now - but maybe not enough.
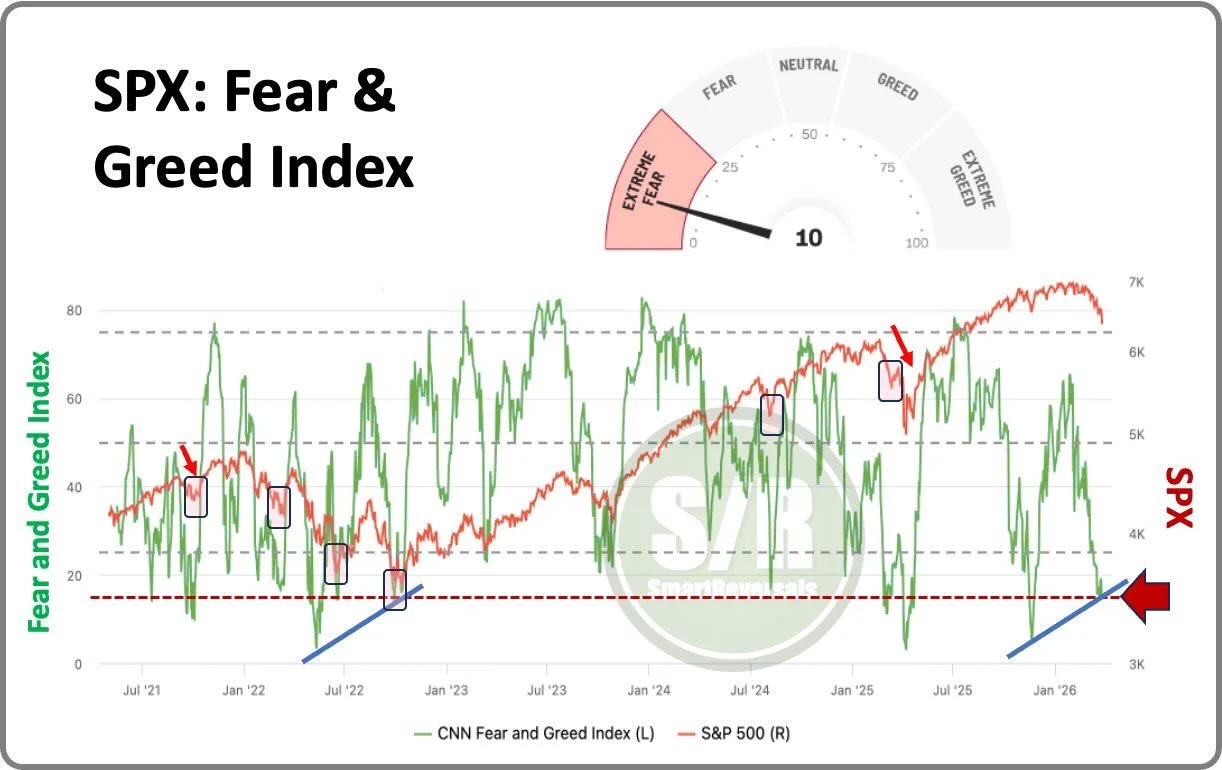
Extreme Fear Level 10 Signals Upcoming Bullish Turn
#SPX: This level of extreme fear (10) has been seen at previous bottoms, including those that preceded bear market rallies in 2022. The shortest bounce before lower lows occurred in 2025. A bullish divergence is now appearing, which validates the...

NVDA Drop Threatens Tech, Watch SMH Support Level
$NVDA breakdown problematic for Tech as Equal-weighted Tech ETF $RSPT also violated support today @IBDinvestors @marketsurge New charts like below found here: https://t.co/XW54gpjWXm While this might find strong support initially near 160-3, it will be important for SMH to hold 370. ...

Avoid New Longs on Lantern Amid Manipulation Risk
Lantern -47% after false CEO-exit claim; company denies. FDA IND and orphan status support pipeline. Risk: market manipulation. Trading insight: avoid new longs until webcast clarity. — Viktor Kopylov, PhD, CFA. More insights: t.me/si14Kopylov

Communication Services Hit Record Oversold Level Since 2021
Communication services didn't get this oversold during the Covid crash or last April. In fact, today's record oversold reading breaks the record from November 2021, when XLC was just starting its 47% drawdown https://t.co/XAW6pr2t4B

Nasdaq Slides Into Correction Amid Rate Hikes, Geopolitics
Nasdaq officially in correction territory as rates push higher and geopolitical tensions keep markets on edge. We break down what’s driving the volatility, key levels to watch, and how to navigate this swing trading environment in this week's episode $SPY $QQQ $IEF...
Ondas' Strong Balance Sheet Fuels Revenue, Buy on Pullback
Macro: Ondas' stronger balance sheet reduces dilution risk; revenue accelerates. Key: $1.5B cash, backlog +240%, FY26 guide $375M. Risks: 35% short interest, elevated OPEX. Trade: buy on pullback; target $23. 📈 — Viktor Kopylov, PhD, CFA More insights: t.me/si14Kopylov

Our Signals Use Fractal Algo, Not Simple Momentum
I get that you're trying to learn. That's great. You're also quick to pass judgment on both the Signals and my teammates (sometimes innacurately). That's not how I roll. TRADE, TREND and TAIL Signal Levels are built using a proprietary Fractal...
Avoid Fake Breakouts; Use Confluence for Reliable Trades
Learn my 9 year breakout trading strategy in LESS than 60 seconds ⚡️ Everyone is always chasing the wrong breakouts and getting faked out, the fact is, you’re chasing over highs with zero confluence. Let’s fix that. #daytrading #stockmarket #momentum #tradingeducation...
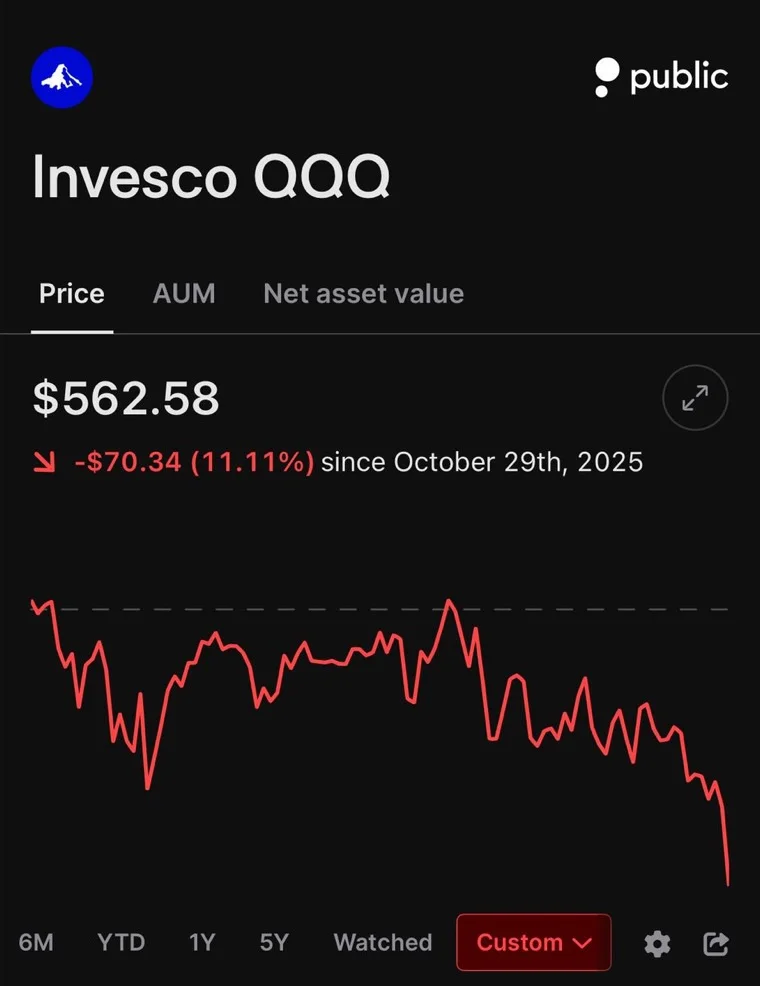
NASDAQ 100 Enters Correction, Down 10% From October Highs
NASDAQ IN CORRECTION TERRITORY The NASDAQ 100 $QQQ just closed the day down by 10% from its most recent October highs the technical definition of a Correction 🔴🔴🔴🔴🔴🔴🔴🔴🔴🔴

SPX Hits Predicted Support Faster Than Expected
March 21st: With the macro & fundamentals laid out, I gave my crash risk levels last week on break of 6508: "Let’s just say $6427 SPX is my next level for ‘support’ bounce before $6215 SPX with overshoot to $6100 by mid-May." Clearly,...

QQQ Mirrors 2022 Slump, Poised for Further Decline
Nasdaq $QQQ dropped brutally this week Seems to be mirroring 2022 Lost 50W MA Will drop more if we keep following 2022 https://t.co/0ZNXkfEUjm
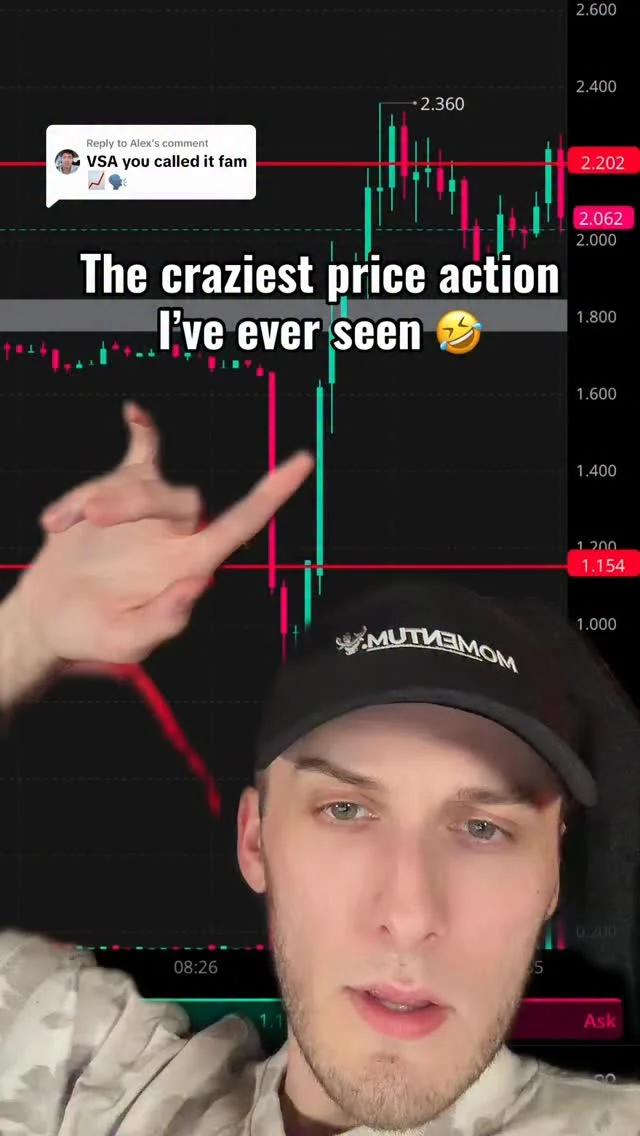
My Top Stock's 3 Wildest Price Moves
Top 3 craziest price action I’ve ever seen, on my top stock at that 🤣 #daytrading #stockmarket #momentum #tradingeducation #howtotrade
NVDA Breaks 200‑Day Average at $167
$167 $NVDA now and cut through the 200 DMA like butter. The updates can now conclude.

Live at 5pm ET: How to Spot Market Bottoms
I'll be going live at 5pm ET Talking through my process for spotting a stock market bottom. Tune in! https://t.co/wEveAsmn98

Bulls Must Hold 630, 625 Break Triggers Vacuum
Some hopeful bull AVWAP levels still in play as price pulls into the Post-Election Night + pre-Liberation Day anchored zones. Bulls need to hold 630. Break below 625 and we enter vacuum territory. $SPY https://t.co/rtPIsNhfEN

Unfilled QQQ Gaps and Grim SPX Signal Warn Contrarians
And so we go into the weekend with two unfilled gaps in $QQQ and a rather ominous-looking $SPX chart. I suspect that absent a dramatic tweet sentiment might be pretty gloomy over the weekend... and that contrarians might take notice. https://t.co/voHUQKVB2z

Bitcoin's RSI Hits Record Lows; Bounce Needed Next Week
The #Bitcoin vs. Gold chart is still in a bounce area. On the weekly and monthly, the RSI's are the lowest it has ever been. Perhaps we're also just in a world that's so uncertain, that it provides those ridiculous indicators, I...

S&P 500 Breaks Low, Eyes 6,212 Target
$SPX - Today it broke below last week's low and closed at 6369. The minimal target is the August low at 6212 but it could drop to as low as the late 2024 high at 6100 which preceded the tariff...

Energy, Materials, Utilities, Consumer Staples Lead Gains; Tech, Communications Falter
$XLE $XLB $XLU $XLP nice gains this week $XLRE $XLV $XLI $XLY $XLF modest losses $XLK $XLC rekt @KoyfinCharts https://t.co/3l41610FAi

VIX Hits Highest Since 2025, Predicts 2.2% Rise
1-day $VIX highest since Tax Day 2025 33.5.. implying a 2.2% move by Monday's close https://t.co/VEUpmCMZmc

QQQ Mini Crash May Dip to 540, Testing 2025 High
$QQQ - The mini crash continues. The minimal target is the August low at 551 but it could drop to as low as 540 and retest the early 2025 high that preceded the tariff crash last year. https://t.co/DCFzwtREO5

Homebuilders, Banks, Utilities, Materials, Europe Rally Amid QQQ Dip
This week: $QQQ -3.3% $VEU -0.2% $IJR +1.1% Homebuilders, regional banks, Utes, Materials, and Europe(!) nicely up last 5 days. https://t.co/5i4ZlLx6rI

Gold Likely to Hit Multi-Year Low, 75% Chance
Hey @PeterSchiff I am giving it a 75% probability that this week's low or maybe slightly lower will be the low for Gold for years to come https://t.co/tXbWvueWh7
S&P 500 Faces Rare 5‑Week Dip Near All‑Time High
Random: The S&P 500 is going to record a 5-week losing streak while closing within -10% of its ATH weekly close. The precedent: 3/27/2026 10/6/2000 4/11/1997 2/10/1984 5/28/1971 1/3/1969 3/18/1966...

EUR/USD Selloff Accelerates; Bottom Remains Unclear
Euro Q2 Outlook: EUR/USD Selloff Accelerates – Where Is the Bottom? https://t.co/tcAqDgTQxZ $EURUSD Weekly & Monthly Charts https://t.co/o5x5v4BsVL
S&P Short‑Range Oscillator Improves, Less Oversold
The S&P Short Range Oscillator again moved to be less oversold at -2.85% vs. -3.13%
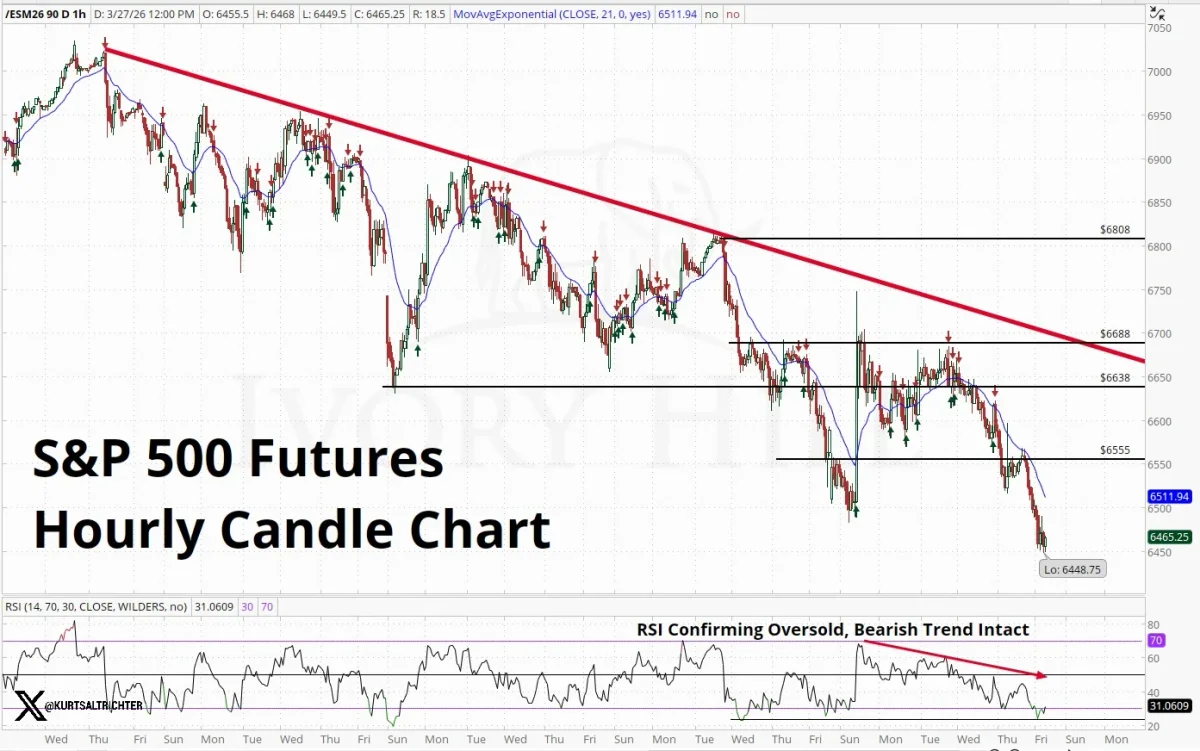
Bears in Control: Downtrend Unbroken, Stay Bearish
The bears own this tape. The 90-day downtrend line has not been challenged once from below. The 21 EMA is pointing straight down. $6,555. $6,638. $6,688. All broken. All flipped to resistance. RSI at 31 is not a buy signal. In a...