
S&P Futures Target $655‑$657.5 Amid Pressure
Good morning. I’m on the road so limited contact from me. Spx futures-25 as “Boots on the ground” gets floated. Simplify it for today. Do we reclaim $655-$657.50 to relieve pressure. Or do we see $650.50 which looks like a big spot https://t.co/MJzBR4kKjb

Oversold Markets May Signal an Emerging Bottom
the selling has slowed, the markets are oversold, sentiment has turned quite bearish, fear is running high... let's watch for opening selling to turn into buying as a bottom forms... notice i said "a bottom", not "the bottom", the latter of...

2026 Asset Ceilings Set by Q1 Highs, Volatility Soon
Sell 1Q, Buy 4Q26? Bitcoin, Copper, Gold, Silver, Crude, Stocks - Inklings of 9/11, 2008 and 2022 are gaining traction in 2026, while US stock-market volatility is near decade lows. Akin to 2008, post-inflation deflation may trickle down from the...

USD Rebounds After Over‑reaction; Short Positions Risky This Weekend
$USD was bought aggressively on a hawkish read of Powell's press conference on Wed and was sold harder yesterday in what seems to be an overreaction to the ECB and BOE. It has come back bid. Who wants...

Gold Volatility Peaks as Nasdaq Hits Low, Signaling Market Reversion
Crocodile Jaws May Have Begun Biting in Gold vs. NDX Volatility - Gold's highest 180-day volatility since 2009, juxtaposed with the lowest for the Nasdaq-100 index (NDX) since 2018, forms a crocodile-jaw pattern ripe to bite. My graphic highlights what...

Canada 5‑Year Yield Surges to 14‑Month High
it's 6am. i'm drinking black coffee. a @tradingview alert just buzzed in my pocket and appeared on my screen to tell me the Canada 5-year yield just broke out to 14-month highs > ~3.1%... 🧐 cool. https://t.co/IHj3aa1dV0

Master Trading Patterns with Structured, Data‑Driven Practice
How to better develop the skill of pattern recognition as a trader: Define 5–10 setups only → there is no edge in randomness Screenshot + tag every trade → build visual memory Study in clusters (20–50 trades) → learn conditions, not just patterns Replay...

Indices Rebound over 1% After Crash: Recovery or Relief?
Sensex, Nifty 50 & Bank Nifty rebound over 1% after Thursday’s crash Is this the start of a recovery or just a relief rally? 👉 Tap to read more - https://t.co/QzdTrL0beu https://t.co/l3GZ0D6R2Y

Rare Unpredictable Catalyst Shakes Oil and Gold Markets
Months ago well before the war inside the oil thread there was this. At the time you simply cannot predict a catalyst let alone this one but the larger pt is odds and setups. $CL_F $GLD https://t.co/tdubAxcT6a
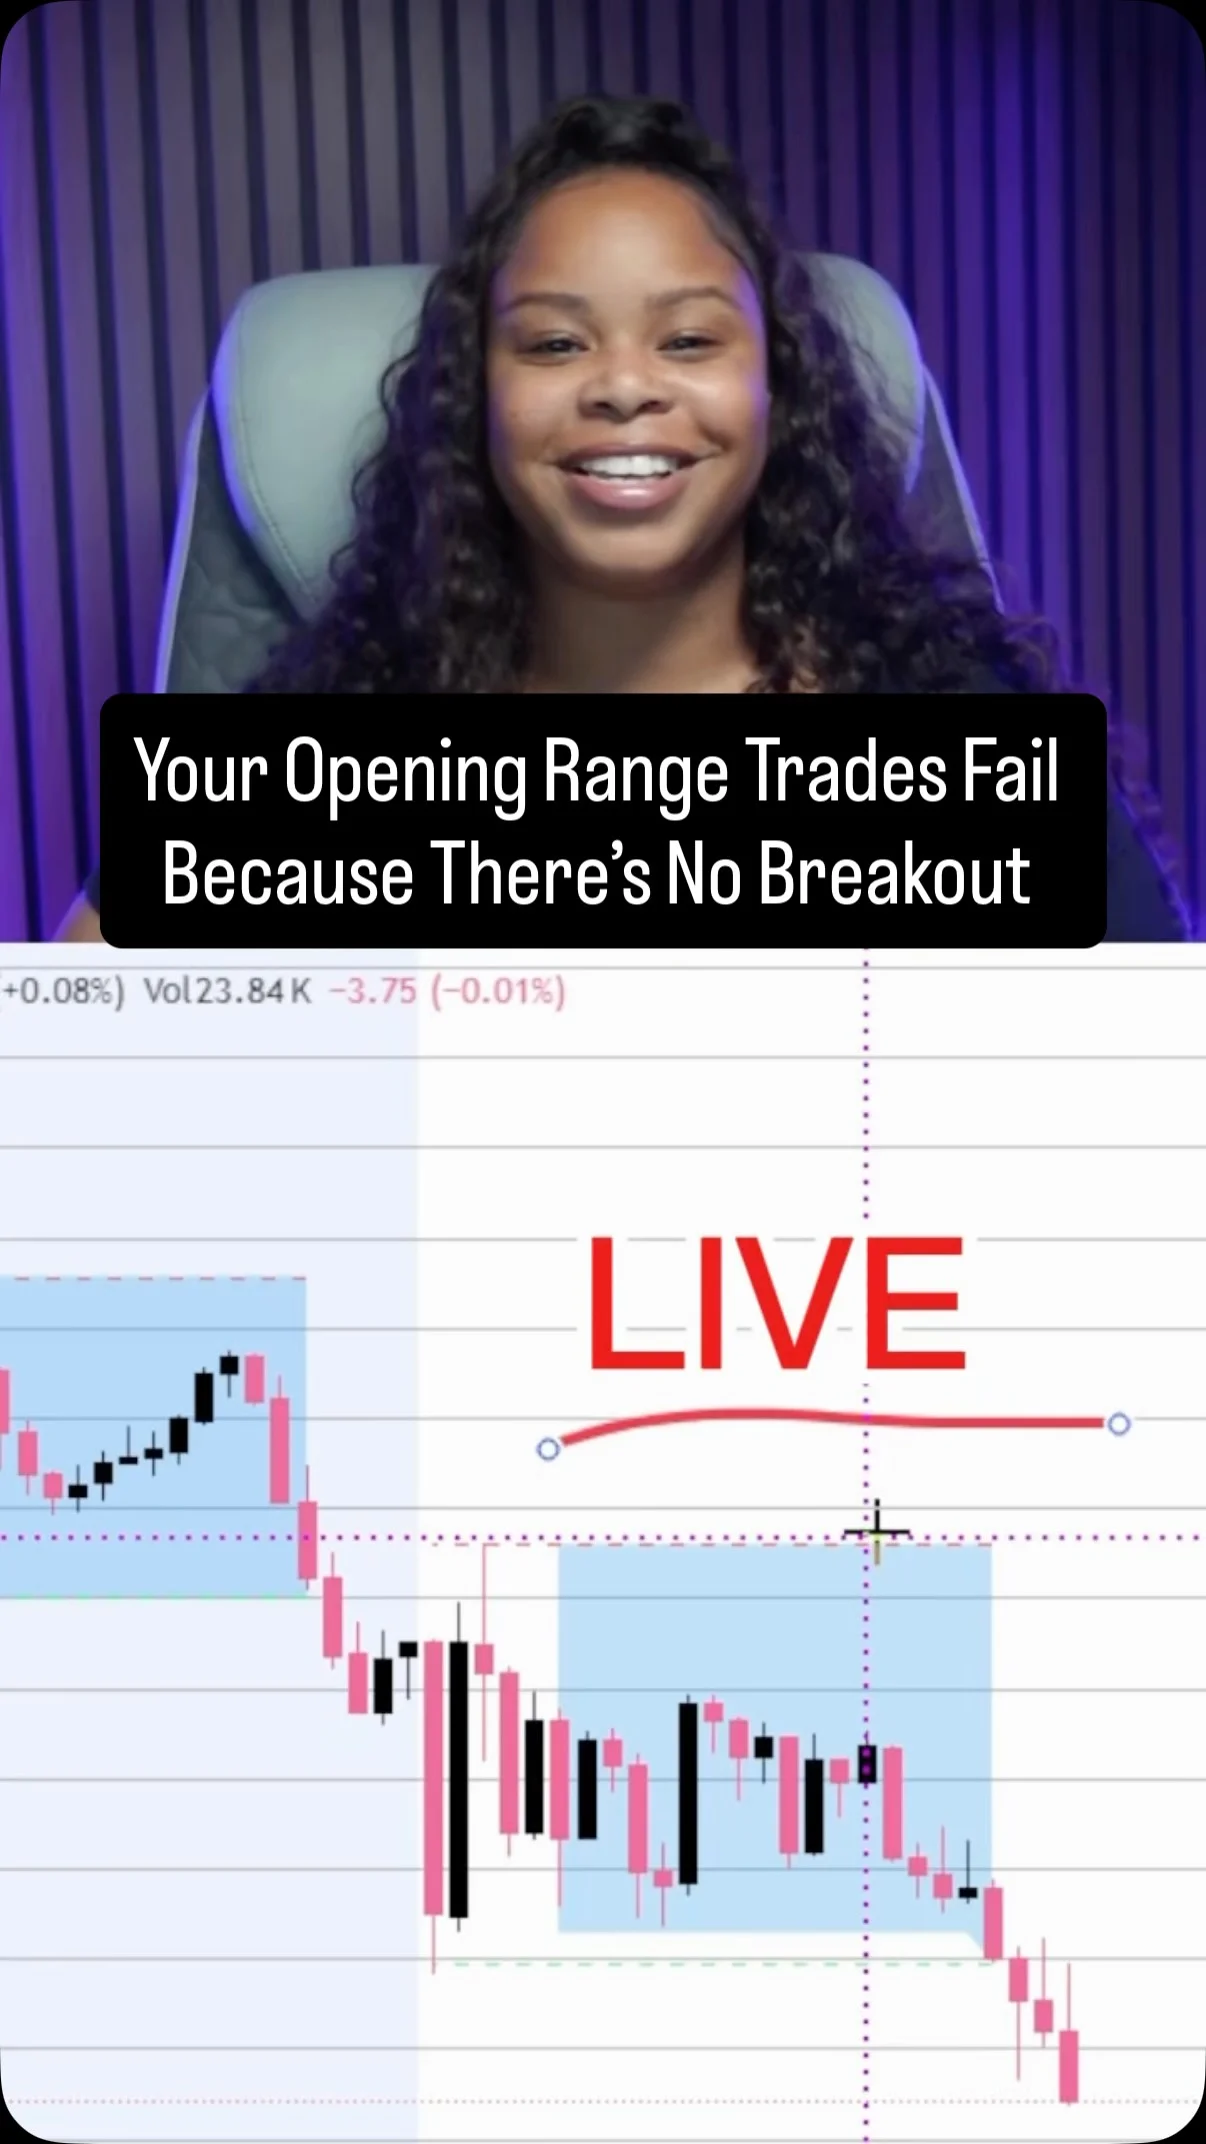
Trade only After Opening Range Breakout with Momentum
Most traders force trades inside the opening range. When price stays within the range, the market is choppy, low momentum, and directionless. This is where traders get chopped up and overtrade. If there’s no break of structure or clean breakout from the opening...

AUM Spike Fueled by Speculative Leveraged Stock Bets
Half hearted look at some cycle indicators, partly bc everyone is so zoomed in, partly bc bulls finally dropped. I'd just add that Long AUM spike was from everyone jumping into those garbage 1X and 2X quantum type single stock...

Dollar Near 100; Break Higher Tightens Liquidity
Dollar pressing range highs just below round 100. Break higher and liquidity tightens. Reject and risk can breathe a bit. $DXY https://t.co/ZvkycsmahB

PL Shows Serial Gapper Pattern with Climbing Volume
$PL Weekly View of the model book move This is a "serial gapper". Note the increasing average volume https://t.co/EBBHr8HVJK

PL Jumps Post‑market on Volume Half of Daily Average
$PL Gapping up post market. Post Market Volume is over 50% an average day's vol

Super‑nonlinear Flexibility Lets You Avoid Rapid Snap‑backs
yep super nonlinear which gives you flexibility to stop worrying about a rapid snap back (ie, you can be short european cyclicals)

High‑Yield Spreads Break Out of Historic Range
The chart below shows that high yield spreads appear to have broken out of its longstanding range. https://t.co/XDtyd2lmpz

Russell 2000 Reaches 2024 Highs; Bulls Must Hold
Russell 2000 back at the 2024 highs. Bulls need this to hold. Lose it and there’s 7 to 8 percent lower in play. $RUT $IWM https://t.co/DDXQ9EAN6x

Quadruple Witching Ahead; Options Hedging Fuels Today's Volatility
just a reminder that tomorrow is "quadruple witching" volatility today may in part be attributed to the hedging of options traders

R2k Rebounds >0.7% Despite 1.
R2k was down 1.4%, yet finished up more than 0.7%. Interesting it happened near the late '24 peak and the 40-week MA. https://t.co/HJ6HMSKM0f

SPX Below 200‑Day MA Yet Bullish on Cycle Signals
$SPX - Closed below the 200 day MA which is a red flag but I'm still bullish for 3 reasons: 1. We are 79 trading days from the November low which is equal to the duration of the last 16 week...

SNDK and WDC Nudge Higher, Hold Your Positions
$SNDK and $WDC inched up let it ride stops. $WDC still own a slice of trade shares

Netflix Gap & 21‑Day MA Backtest Shows Continued Hold
$NFLX back test of the gap and 21ma. See what tomorrow brings. Still own let it rides. https://t.co/z4uC0tlksb

Critical Technical Levels Signal Do-or-Die
$VXUS holding 76 overshoot of 20sma. Same look as $QQQ rallying into resistance, $NVDA holding 200sma. This is a do or die level for a lot of stuff we are watching https://t.co/ppXrYUZW6g

Follow McGough: Short on Green, Long on Red
Especially in a #Quad3 Bearish $SPY TREND, if you're going to buy Longs on red, you should be re-loading on Core Shorts on green... Coaching Notes: I'll almost always go back to McGough @HedgeyeRetail in a market like this His fundamental research...

NVDA Holds 200‑Day SMA; Tomorrow Determines Direction
$NVDA : A+ for effort to keep that 200sma -- tomorrow big day for followthru or breakdown https://t.co/V5CeiyXZhD

QQQ Near Resistance; Breakout Boosts Bull Confidence
Right at resistance. Close here and move thru would do wonders for bull confidence $QQQ Otherwise next support 575 https://t.co/zFYrs6ZsBO

SPX Weekly Close: Above or Below 200‑Day MA?
Poll question of the day... Does $SPX finish the week above or below its 200-day moving average?

Record $64B Outflow From SPY, QQQ in 3 Months
The boat is getting tippy. About $64 billion has come out of SPY + QQQ over the past 3 months. That's nearly double the previous decade's extreme. Still not all that extreme as a % of assets tho. https://t.co/Ep1DBUQEqI
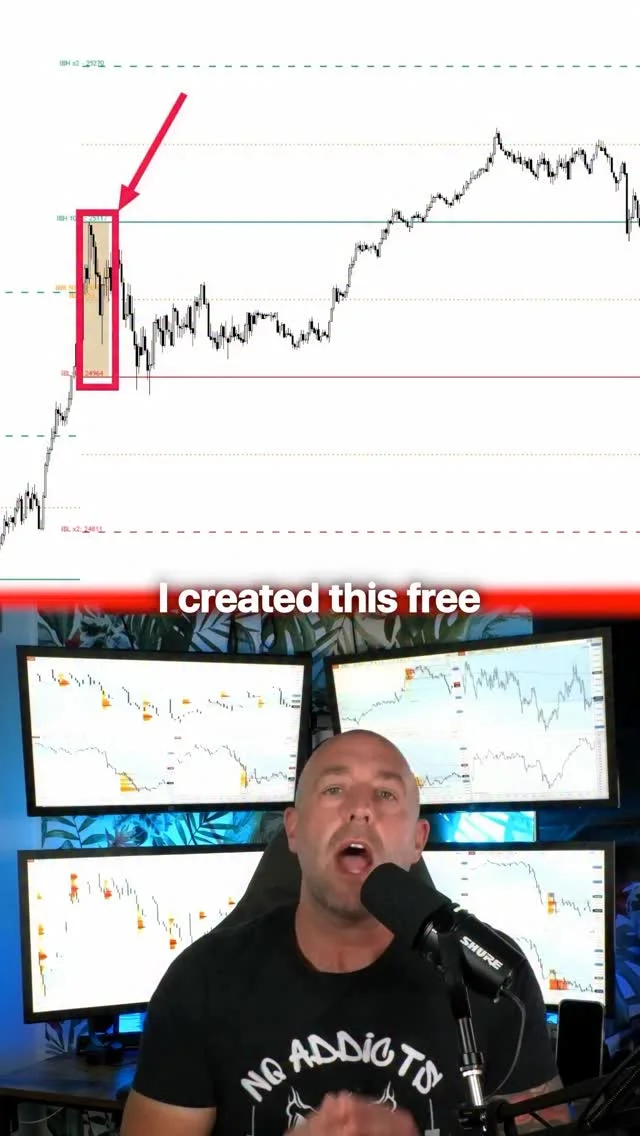
First Hour Reveals Trend, Chop, Fade via IB
Stop chasing breakouts ❌ The first hour tells you everything: 📈 Above IB = trend 🔁 Inside IB = chop 🎯 Edges = fade Comment IB and I’ll send you the free indicator 🔥 #daytrading #futures #tradingtips #priceaction #vwap

When Price and Earnings Momentum Align, Opportunities Soar
Price momentum and earnings momentum are not the same thing... but the best opportunities often happen when they align. Alex Carteau @EpsMomentum joins me on the pod to talk about timing, earnings gaps, and post-earnings drift. Worth a watch. ...

Mag 7 Holds; Break Lows Threaten Broader Market
My focus continues to be on the Mag 7, which has remained in its narrow range since last October. Should we break the lows, the broader indices will be at risk of a deeper correction. https://t.co/DCwPOyMXCH

Kyle's FLR Buy Hits New Afternoon Highs
Kyle came up w nice Buy in FLR 3 days ago....gap fill areas overhead. It's making new highs in the afternoon. https://t.co/j9h7t93ayn
USO Soars Post‑$124.50;
$USO incredible since $124.50 clear out. Wish $SLV had been this damn friendly. $SLV had so many V shape reversals and very easy to minimize trades if only covering 1/3-1/2 etc.
Calls Surge
Calls doubled on that move but reject at VWAP, likely round trip them waiting for the rip yo face off that never comes lol. But, worth the risk if it does 🤷♂️

BE Shows Strong Move Off Key Pivot Level
$BE remains a focus (and a wild one) Nice action off the 50 & prior base pivot level https://t.co/yaovLcqxUf
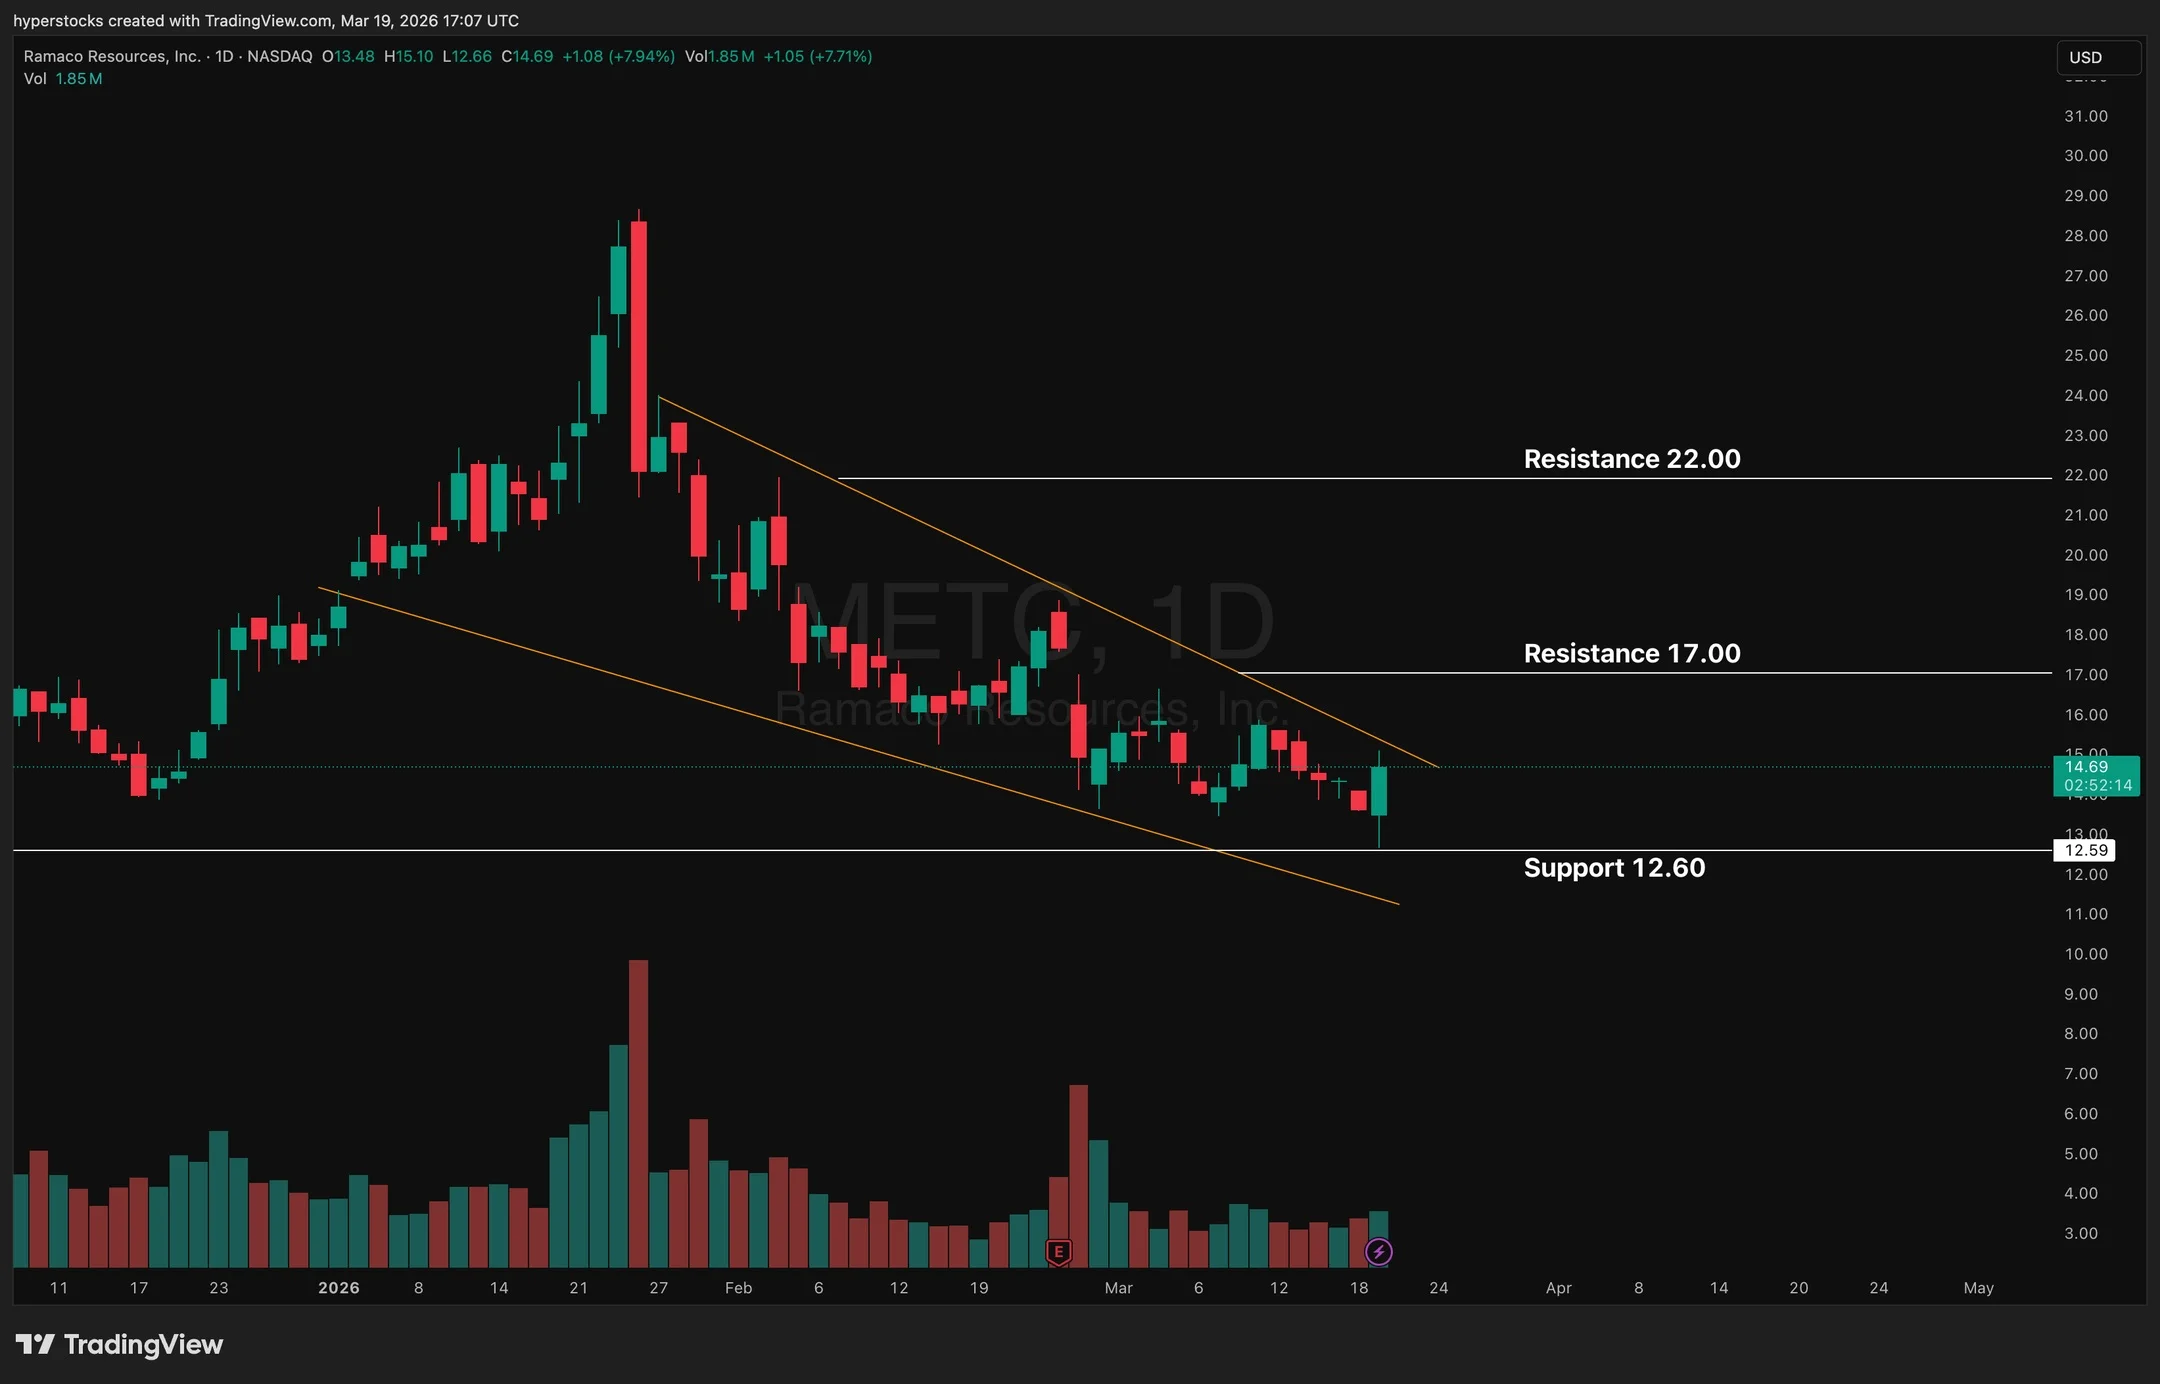
METC Poised for 2026 Earnings Turnaround, Shorts May Unwind
$METC - coal stocks gaining traction. 2026 is expected to be a turnaround year for them, with EPS set to turn positive in the second half. Short float is at 27%...these short sellers may start closing as the company begins to...

Modest S&P Drawdown Leaves Market Vulnerable to War Mis‑read
The heatmap below shows that the drawdown for the S&P 500 remains modest at -5.4%. The market is only modestly oversold with 32% of stocks above their 50-day moving average. Sentiment is mixed and both earnings expectations and margins remain...

Gold Slides 17% as Key Support Crumbles
Gold Price Short-term Outlook: XAU/USD Plunges 17% – Key Support Break Sparks Risk https://t.co/oj3h71da7v $XAUUSD Daily & 240min Charts https://t.co/ehqks3gynu
Adobe Stock Plummets to 7‑year Low as AI Loser
Adobe Stock Hits 7-Year Low After It's Branded AI Loser https://t.co/CDZou0lrKO $ADBE $DOCU $HUBS $MSFT $ORCL

Canadian Solar Nears Breakout After 28% Decline
Canadian Solar $CSIQ shareholders quietly singing to themselves, "the sun will come out... tomorrow??"... the stock is -27.9% and trading right back to the Oct 1/25 breakout bar... https://t.co/SKgnzJIXax
Energy Stocks Overbought After Mid‑January Surge
energy stocks seem a tad (short-term) stretched and pretty cleary overbought... since they took off (no, not when Iran was attacked) but instaed in mid-January as they broke out, they've had little in the way of pullback... $XEG $XLE

S&P Hits Q1 Record, yet Undercuts Prior Q4 Lows
Random: Calendar years where the S&P 500 sets a new ATH in Q1 - yet also trades to a lower quarterly low than Q4 of the prior year? $spx Mar-25 Mar-22 Mar-20 Mar-94 Mar-90 ...

YPF
YPF now seeing buyers 3500 May $42 calls for $3.15 to $3.20, nice run already from last week write up https://t.co/4fVGR5BExA

VIX Plunge Signals Rising Market Complacency Amid Stress
$VIX: 27.85 on March 13. 21.51 now. A 6+ point collapse in one week while oil trades near $100, the Fed just held, and private credit is cracking. Complacency doesn't announce itself. It just shows up in the $VIX. https://t.co/QOUSwv6YZ0

Heavily‑shorted Oil Services Rally as Iran Concerns Ease
$RIG Daily. Heavily-shorted oil services play still consolidating well in uptrend. Market sorting out Iran issues, but Transocean remains in play for new leg higher https://t.co/EZ3IJqVcHW

VXUS Holds 76, Eyes 20‑Week SMA Breakout
$VXUS holding this 76 support is a good start, would like to see it go back over 20sma weekly. If it does not hold the bounce next support is 70 zone https://t.co/TnlCPcH9W4

Silver Holds Above $64, Poised for April Rebound
$Silver is trading below its 100 day MA for the 1st time since its April 2025 low. However, I don't think it's relevant since it retested the February low earlier today, so unless it breaks below 64 it probably made...

QQQ Repeatedly Breaks Pre‑Market Support, Turning It Into Resistance
$QQQ has failed 3X at pre-market support. *support becomes resistance*. why does this happen so often? https://t.co/0jxQyPgMtd

Emerging Markets Hold Up, S&P Bounces After Pullback
emerging markets $EEM vs. S&P 500 $SPX still looks legit and bounced after the first "pullback against"... let's keep an eye... https://t.co/2tOH6LJWWS

Gold and Silver Spike After Panic V‑Pattern
$GLD and $SLV incredible panic opp today, started in and then scaled right side of the V @IUTraders https://t.co/eHPwo4cI94