
SPX Downtrend Likely Extends to August Low
$SPX - Time wise we're still in the timeframe for an 80 trading day low, but in my opinion the weekly close below the 200 day MA and breakdown of the November low has invalidated this cycle. The downtrend is likely to continue into April and reach the August low at 6212. https://t.co/OJkq80IOFd

QQQ Expected to Extend Downtrend to April, Target 551
$QQQ - Today's action has changed my expectations for a bottom this week. The bullish outcome was eliminated given the weekly close below the 200 day MA and break of the November low, which means that QQQ made a major...

Start Your Day with a Single Powerful Number
Most people start the day with headlines. I start with a number. Because one good number can tell you more than 20 opinions ever will. One chart. One number. One takeaway. Read it in under 2 minutes, before the market opens. It's free... It's...

XLK Tech ETF Hits Six‑month Low, 12% Drawdown
$XLK tech ETF aims for its lowest close in more than 6 months... look at that gap @stockcharts A 12% drawdown.. https://t.co/WnAoCjYRPP

Patience Required as SPY Pulls Back From ATH
Tier#1 BOS account going in today on close. For those who use this as a barometer, it’s first time since ATH. $spy $650ish is about 7% off $spx highs. $spy highs. Thats the start. I want to be early...

QQQ's GMMA Shows Sustained Uptrend Since April
This is the GMMA chart of the $QQQ since last April Uptrend = Red over white space, over blue Downtrend = Blue over white space, over red https://t.co/OX8FRHZybi

S&P 500 Slips Below Recent Lows, Support Vanishes
🚨 S&P 500 breached the October & November 2025 lows. This is a nasty break for bulls heading into the weekend. Support vaporized. Fear ramping. Expect a bounce or deeper pain? Your bias? $SPY $SPX https://t.co/0YEkEMWsD5

Retail Hype Shifts, but Latecomers Still Suffer
While retail mania rotated from Silver $SLV to Korea $EWY, the outcome is likely to be the same. Pain for FOMO latecomers. Artwork courtesy of my boy @CavanXy. https://t.co/8ff8rIpWpd

SPY Holds Above 652, Next Bounce Target 637
$SPY $SPX $ES_F Now below 652 and the 200 day MA (which is still upward sloping). If no failure here, the next logical bounce spot would be 637 and the AVWAP from the TT lows... https://t.co/EiIW0iYugM

S&P Forms Bear Flag
SPs "ate the tail": (This also appears as a bear flag on 2 - 4 hours charts). Rus only index not to have taken out PDL...yet... https://t.co/He4PxAzRWd

Momentum Surged as Investors Chased Capex Stocks
True to form the momentum came out of these once everyone started searching for momentum stocks and the capex trade https://t.co/RSigVToqMT

TNX Breaks Triangle, Bullish Spike Ahead
$TNX Monthly. Head-fake lower last month. Surge higher this month. At apex of multi-year triangle. This is ideal bullish setup for rates on 10-Year to explode higher https://t.co/aCdWZY5Kd9
SPY Tests $650 MVC, Likely to Keep Chopping
$SPY is testing the MVC at $650 after a full day of chop. There's not much momentum going into this move, would not be surprised if we continue to chop.

QQQ Fades at 21‑EMA, Targeting November 21 Level
For now for the $QQQ, the pattern is that we fade at the 21ema and undercut key upside reversals The Nov 21 level is approaching https://t.co/mxcUisB0Cx

Price Action Confirms Scenario Two Will Persist
Price action currently making my latest thoughts a tad cringey. I laid out three scenarios. We are in scenario two and I think we stay there. 🙏

FTSE100 Slides, RSI 37 Signals No Oversold Condition
#FTSE100 took a whack today and 10,000 taken out. However, it's currently around RSI 37 which isn't low or Oversold.

Track Implied Delta by Comparing Poly to Futures
a quick little trading inspiration.. track the implied delta of the >90 market on poly compared to the corresponding futures price by tracking its price change. For example if the market went to 75% on a $1 rally then it's a...

Alphabet Stands Alone as Magnificent 7 Holdout, Short Target
$GOOGL Daily. With $AAPL $TSLA weakness this week, Alphabet is now THE holdout amongst the Magnificent 7. It's a "catch-down" short idea. Possible major top. https://t.co/1SLVQkyaV1
200 EMA Drops Below 200 SMA: Warning Sign
200EMA daily is currently 173.79 and as you said it lost the 200sma. Not good

SPY Tests Weak Horizontal Support, Next Level 644
$SPY at horizontal support here which is not looking great thus far, next support 644 zone. https://t.co/EYQT5Domk7

USO Call Butterflies Signal Strong Oil Upside
USO trades in January and March 2028 are actually call butterflies today as 125/185/245 seeing plenty of upside for Oil

QQQ Faces Do‑Or‑Die Day, Support Fading to 574
Day is young but all the resistance spots held, and all the support is slowly fading away on the do or die day. $QQQ next support 574 zone https://t.co/MSb3kpos7u

SPY Hits 2025 Low Levels, Signals Possible Bounce
We are at an interesting level on the $SPY. The current level coincides with the October 2025 and Nov 2025 lows. There’s not much to do with this info besides that it can be a short-term bounce area that reminds...

Dr. Kaminski Reveals Secrets of Effective Trend Following
A discussion on trend following and an interview with Dr. Kathryn Kaminski. by @jordonezjr https://t.co/bFssSmL7OE https://t.co/kfvFidDWjF

CMG Must Clear 10‑EMA Gap for Bullish Breakout
Burrito Season $CMG Needs over the 10ema and the small overhead gap and then might have something using the daily chart. https://t.co/U65cpWuwU9

Vertiv's Buying Surge Hits
Last week i wrote about S&P 500 index rebalance which happens today. Vertiv $VRT, Lumentum $LITE, Coherent $COHR and EchoStar $SATS are all going into the index today. Vast majority of the trading will happen around market close. Vertiv buying...
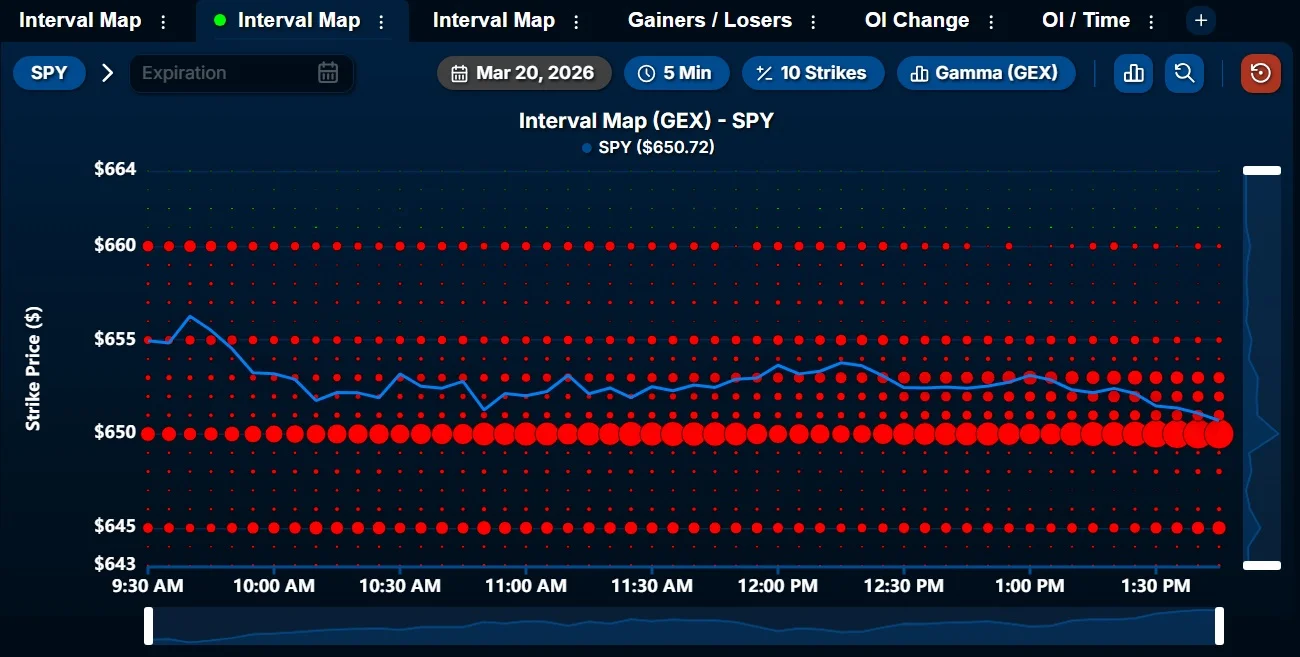
Interval Map Levels Predicted 1,000% SPY Call Trade
Here's how I took a 1,000% trade on $SPY today. $660 had the greatest exposure on the Interval Map. $655 was the downside target. $SPY rejected near $660 and dropped near $655. Multiple times. That range held all day. In the afternoon, I entered...

Most Traders Can't Consistently Draw Support/Resistance—Use an Objective Method
Traders, If I deleted every support/resistance level on your chart, could you redraw them exactly the same? 90% can't. -They can’t choose between wicks or bodies -They can’t choose the right timeframes -They can’t choose which influencer to listen to -They can’t choose which indicator to...

Short‑term Traders Eye 580 Close, Expect Monday Panic Low
from a short term trading perspective best case would be a close closer to 580 than 590 and a panic low monday morning. $QQQ https://t.co/FgpBvybxaM

NET Holds Above New Base, Shows Relative Strength
$NET working on the right side of its new base and showing decent relative strength lately. Chart courtesy of @marketsurge @IBDinvestors #IBDPartner https://t.co/xkioAgDMWQ

Optimistic War Rhetoric Triggers Short Cover, Fuels Downtrend
Trump, Bibi, Hegseth's 'everything's going great' reassurances on the war feel exactly like a CEO hyping the stock in a downtrend. Triggers knee jerk buying ➡️ shorts cover ➡️ big players sell into the rip ➡️ another lower high, lower low...

10-Year Yield Climbs Steadily, Market Bets Tighter Longer
10Y yield is still ripping higher in a straight line from that brief 3 handle tease. Market says, tighter for longer. $TNX $IEF https://t.co/dbZrSwrwwr

Uniform Plays Yield Same Outcome; SMCI Expected Fade
Plays of day - all same concept all same result -> $CRCL $AXTI $IBRX With a side of $SMCI fade

Chart Signals Near‑term Market Bottom
When I start looking at charts like this we must be close to near term bottom 😂 https://t.co/zeOh4y6Cnl

Gold, Silver, Copper Forecasted Below 5‑Day SMA
GC, SI and HG will all have 7 closes below the 5 SMA today. https://t.co/9wuK7cjvOG

Pinball SELL on EC, BUY on $JY; Early Success
Yesterday as of close there was a Pinball SELL on the EC and JY a pinball Buy on the $. so far so good.... https://t.co/jyYJz5ELJT

Two Great Trades a Month Outperform 20 Weekly Trades
Most traders think they need constant action. They don’t. Earlier this week I said: You don’t need 20 trades a week. You need 2 great trades a month and most of your yearly gains come in just 3–4 weeks. My PNL update is...

GEV Targets 890 Hold, Eyes 893‑894 Upside
$GEV watching for a move and hold over the 890 area then 893-894 on my radar if price wants higher. Follow thru today https://t.co/IITb9BCPkn

Earn Quick, Low-Stress Gains by Compounding Small Trades
Made $112 this morning knife catching $TSLA again I'm up $230 in the last two days in less than 5 minutes of effort and zero stress After having one of my best trades of the year on Tuesday I'm happy to compound...

10-Year Yield Hovers at 4.3%, Poised for Breakout
The 10-year couldn't close above 4.3% yesterday, but is trying again this morning. Lot of whipsaws (in both directions) with this chart, but this would sure look like a breakout https://t.co/17G6Y8TtLa
SPY Likely Rebounds to $660 Despite Support Test
Negative Exposure across the board on $SPY at the open. Testing support at $655 right now; the next level is $650. I am hesitant to short $655; I think a move towards $660 is more likely, given the strong exposure...

FDX Call Spread Trade Targets 10x Return
$FDX "Trade Idea 2: Buy the March 347.50/352.50 Call Spread ($3.50) and sell the March 325 Put for 50 cents." puts expire, sell call spread near $5 or watch max out at a 10x

Cut Losses, Preserve Capital Amid SMCI Downturn
Caught in the $SMCI gap down. I took 40% off for a 27.3% loss I have divided the other 60% in half and will watch the first 30 mins and 60mins. To place a stop I...

Nasdaq, S&P Open Lower, Slip Below 200‑Day SMA
It looks like we are going to have a spicy close to the week with the US session opening with a sharp gap lower on the Nasdaq 100 and S&P 500 that dropped both below their 200 SMA. Some serious...

QQQ Dips Below 595 for First Time in Months
4hr bars. this is the first time $QQQ has spent more than a few hours below 595 the past few months. https://t.co/hLFzKzlkWn

Gold Bullion Faces Potential Peak, Bearish Engulfing Forms
did gold bullion peak? monthly bearish engulfing (in progress) & "biggest bar against" in motion #chartcrime... https://t.co/KU8aiYgVE8

Below 200‑Day MA Sparks Extreme Market Volatility
Stocks’ technicals continue to weaken, and for the first time in the post-Liberation Day bull market, U.S. large cap stocks are testing their 200-day moving average. Drops below the moving average have historically triggered more volatile trading. Extreme returns, both positive and...

Long‑Only Investors Dump $9.6B in Record Five‑Sigma Selloff
From GS on Flows: - Long-only investors sold $9.6B across GS’ trading floor on Thursday, the biggest wave of selling in the firm’s data history (2022). - Thursday broke the prior record from July 2025, and marked a rare five-sigma event. https://t.co/sasYSAIUL0

Breadth Spike Near 30% May Trigger Short-Term Rally
We're getting close to 30% of $SPX members above their 50-day MA. Even if the longer-term trend continues bearish, bombed out breadth conditions like this can lead to short-term upside reversals. https://t.co/pCLd1WlCZh

Iceberging: Concealed Large Orders Drive Silent Market Moves
Iceberging Iceberging is placing large hidden orders that execute in small visible portions. The goal is to conceal true supply or demand. At resistance → silent selling. At support → silent buying. ↓ https://t.co/sUSNktvszp