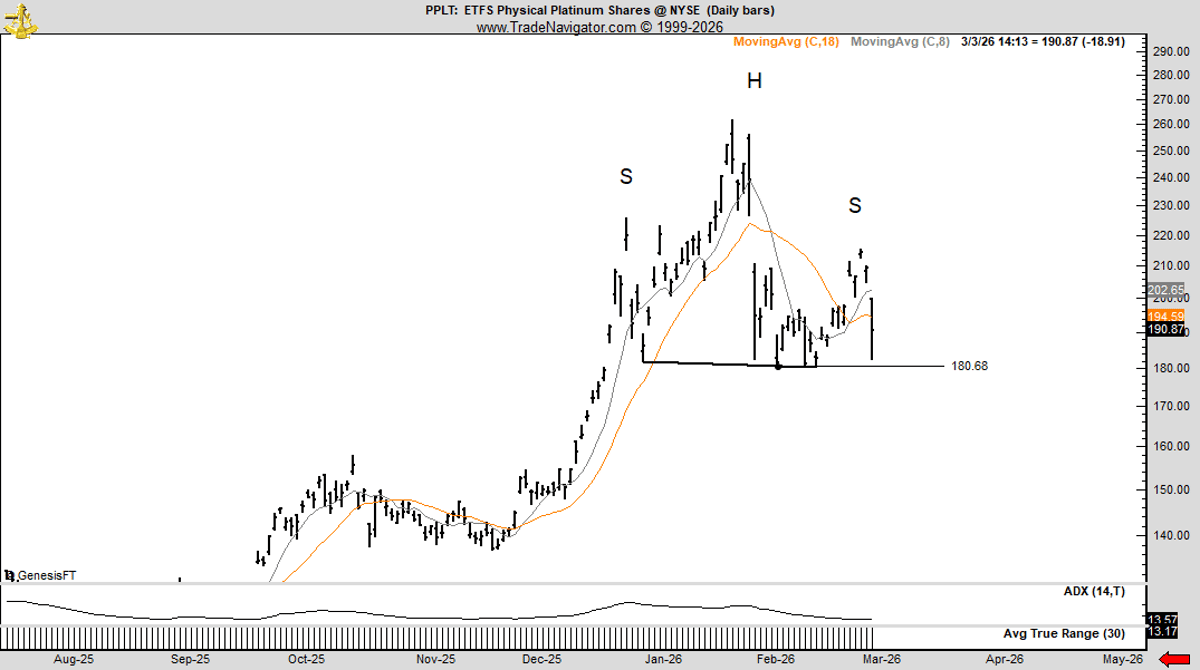
Platinum Chart Signals Impending Head‑and‑shoulders Reversal
Charts can always morph, but it looks to me that the Platinum party is about to be interrupted by a head and shoulders pattern. I am not allowing replies on this because I have no interest in reading what you trolls have to say $PPLT https://t.co/xtw2hTIfq9
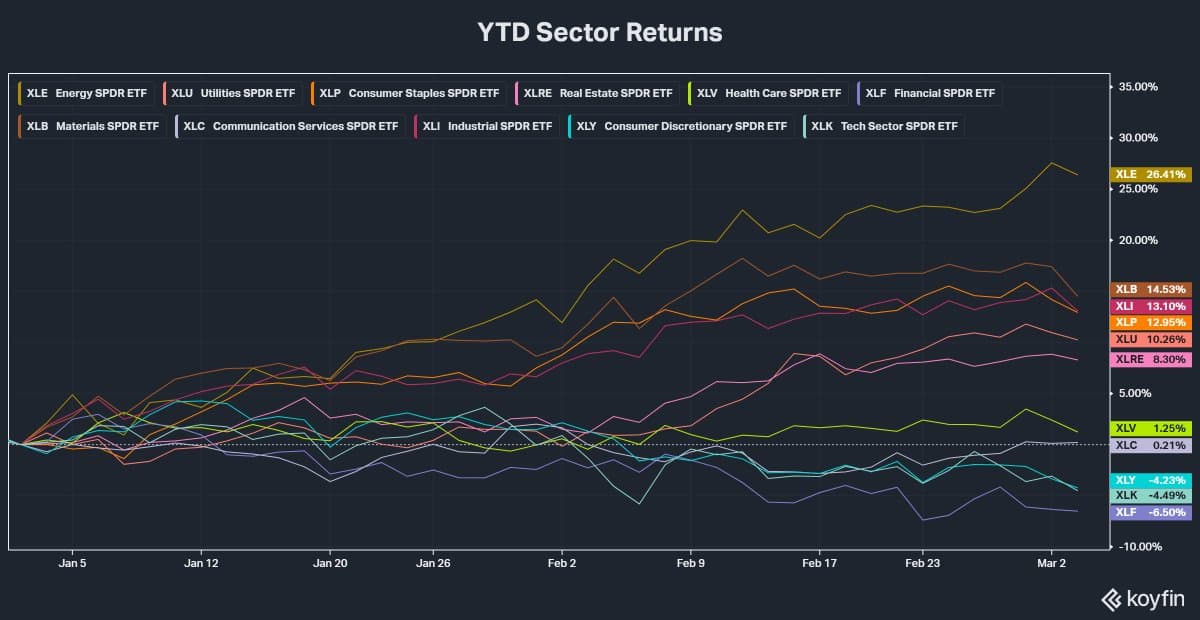
Defensive Tilt Masks Weakness in Tech, Financials, Discretionary
$SPY - The part that's tough for me is the defensive tilt that's taken place this year in the S&P 500. It's easier to "ignore" these days as "event driven" etc. when that isn't the case but with $XLK, $XLF,...

V‑shaped Rebound Likely, but Deleveraging Extends Beyond One Day
Rooting for the immediate v shaped recovery in KOSPI/Nikkei but, in my experience, violent deleveraging events are seldom limited to a single session. Held off on any aggressive dip buying today.
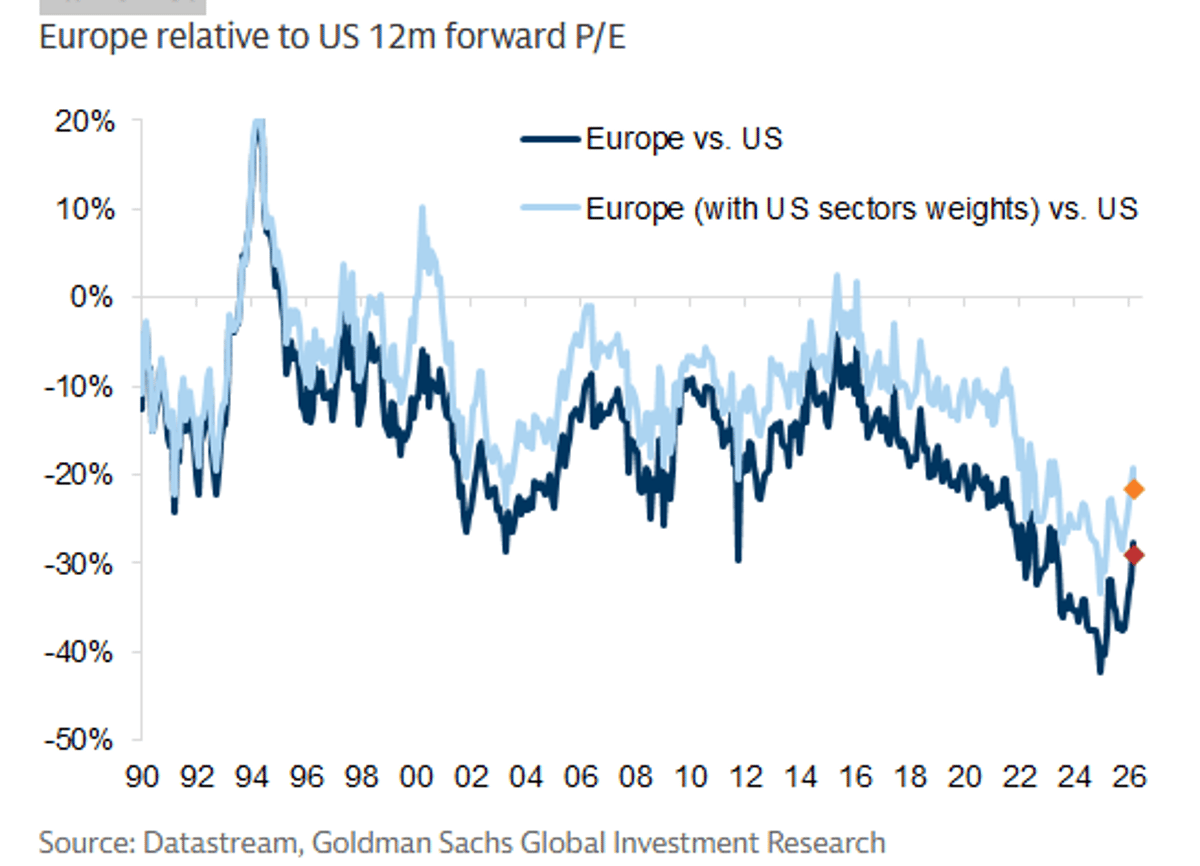
Europe's US Discount Shrinks, yet Gap Persists
GS: While Europe remains on a discount to the US, this discount has narrowed https://t.co/MWh0XnVJBZ
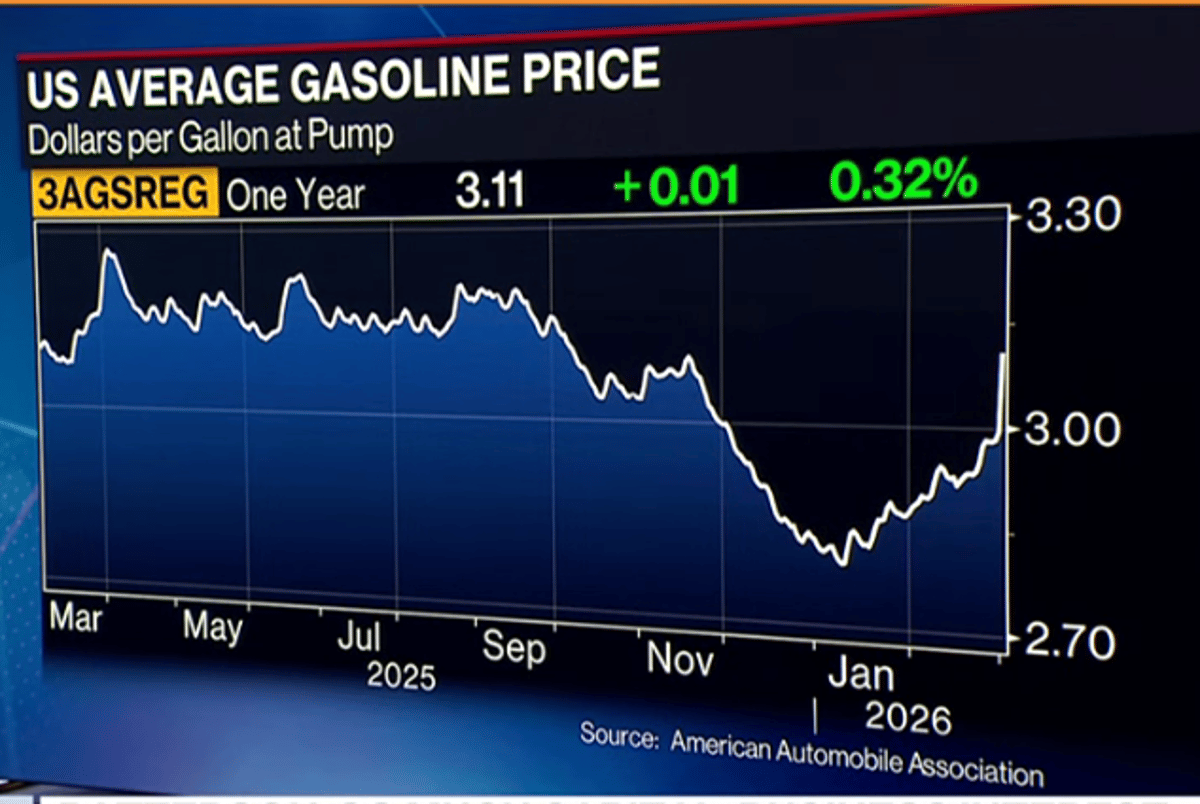
RBOB Contract Roll Added 25¢ to Gasoline Price
Gasoline prices... remember the March-April RBOB contract roll was +25 cents on its own https://t.co/WAOPFvCQdz

CRCL: Dead Cat Bounce or Emerging Bull Trend?
$CRCL (per request) I honestly can't decide if this is a dead cat bounce in a downtrend or the start of a new bull trend. Wish I had a better read. https://t.co/PD7HPiHYFV

FTSE250 Shows Bearish Momentum, EMA Cross Looms
#FTSE250 big Down Candle. RSI 44 bit off Neutral. Could be lining up 13/21 day EMA Bear Cross. Closed below Bottom Bollinger Band which is unstable.

Good Analysis, Poor Timing: Sold Too Early
$DG (per request) This chart is a great example of good analysis and bad execution. I sold way too early. Up 50% from that support. Noted. Lesson learned. https://t.co/3gkMNvaqn7

FCX Chart Suggests Upside Target Near $80
$FCX (per request) Beautiful chart. Clean price action. Measured upside target is closer to $80 https://t.co/w3xHEH085E
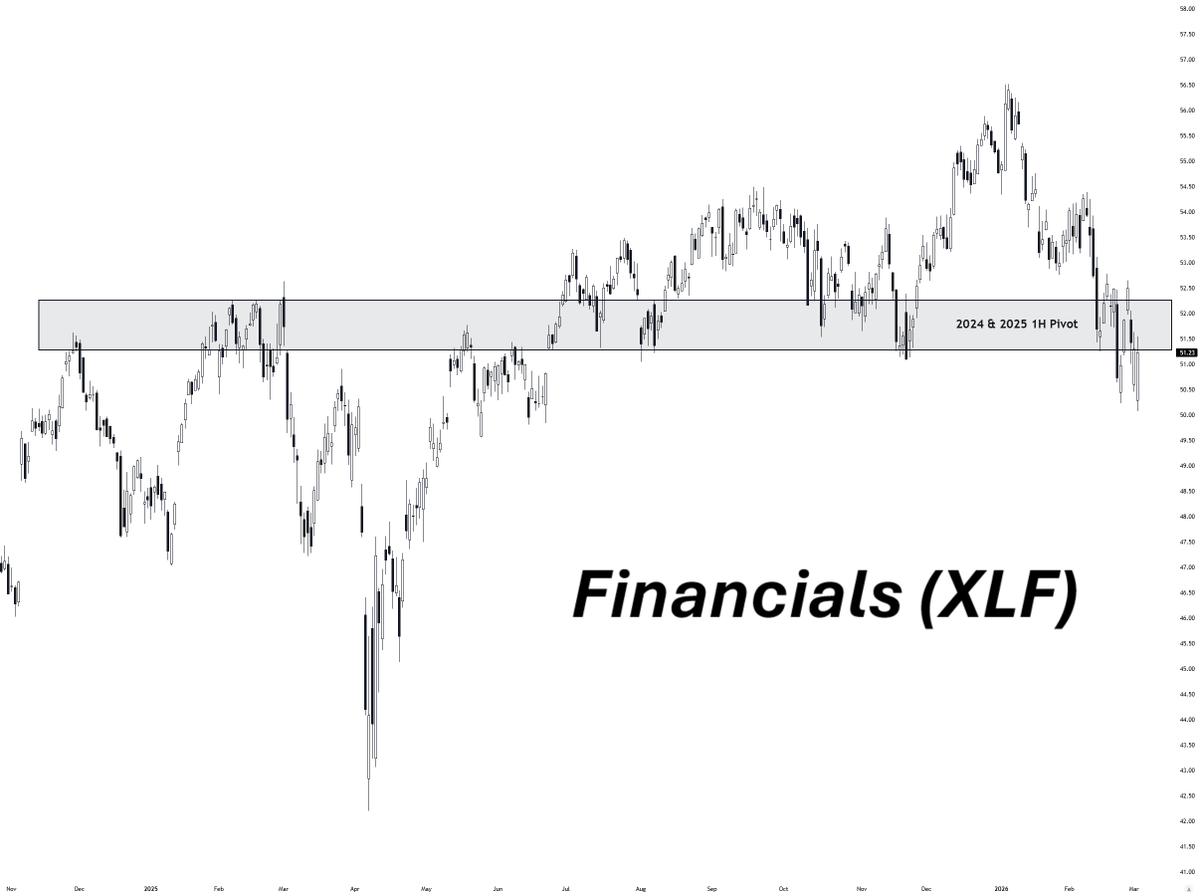
Financials Surge, Magnetizing 2024‑25 First‑Half Pivot
Financials rally back to the underbelly of the 2024 and 2025 1H pivot. So far it’s acting like a magnet... $XLF https://t.co/jXBzQnKMxZ

HYPE Faces 99‑SMA Resistance After Mini Spring
$HYPE (per request) Followed through on the mini spring I posted earlier. But now just struggling with that pesky 99smma resistance. not a good sign if it can't break https://t.co/pa5x3GyItL

BofA Predicts Weak Feb Jobs, Fed Stays on Hold
BofA: We forecast a below-consensus Feb NFP print of 35k (private: 45k). The u-rate should remain at 4.3% Fed response: wait and watch stance under Powell https://t.co/qQ28IUZLsk

OKLO Holds Mid‑Range, Potential Support Below
$OKLO (per request) Doesn't look great but doesn't look terrible locally. Mostly just hanging in the middle of nowhere. Has an untapped support below. I'd be more interested in buying the yellow line reclaim if it does something like this. https://t.co/1Wtg9vINKt

PSX Breakout Signals Continuation After Clearing Resistance
$PSX (per request) Looks like a nice base breakout and should see continuation. Levels noted in chart. One more resistance needed to take out for more price discovery. https://t.co/YmKPMsfiHV

NVO Breaks Support, Faces Downward Continuation Pattern
$NVO (per request) Has lost all monthly and weekly support and just broke down from a harsh range. Looks like a continuation pattern to the downside unfortunately. Needs to reclaim this range as a starter for any bullish scenario. https://t.co/G49aFKlG3c
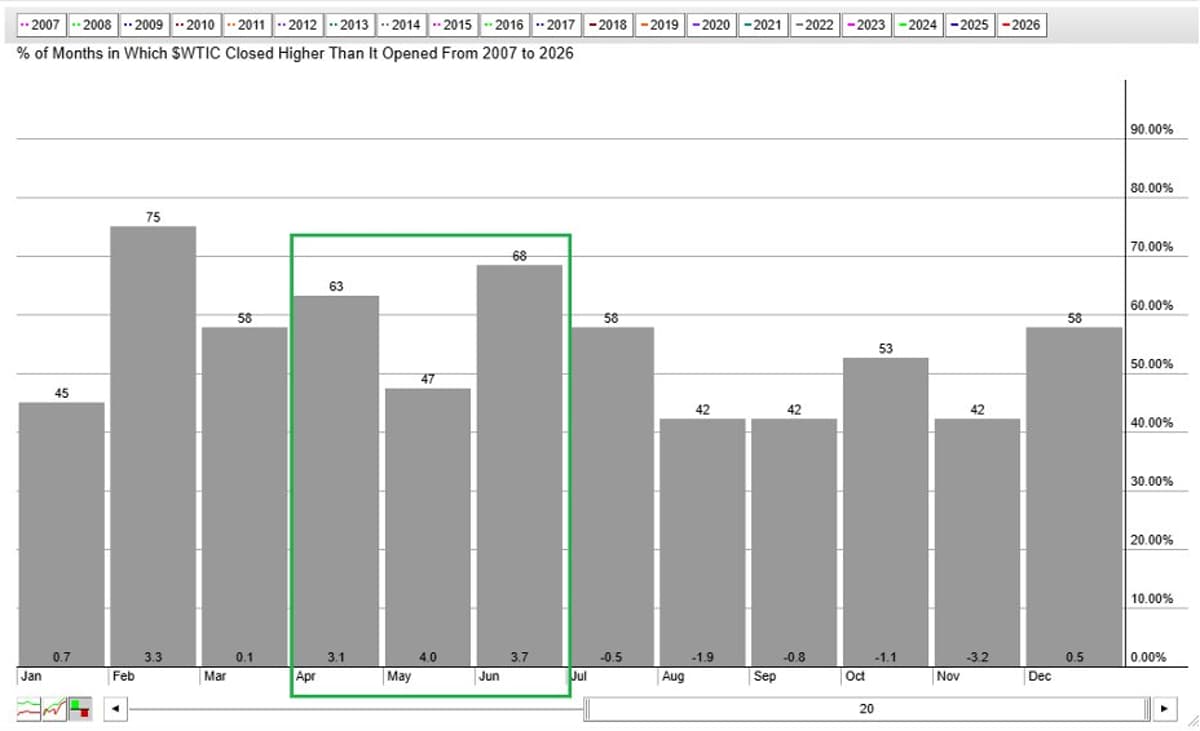
Oil Approaches Its Most Bullish Season Yet
We are nearing oil's most bullish time of year. $CL_F $USO $WTIC More from me on @stockcharts: https://t.co/2c4CuouCWe https://t.co/o1k2jBw7MM

32 Large‑Cap Hits New Highs, 14 Slip to Lows
there are 32 large-cap stocks hitting the 52-week new highs list today... there are 14 large-cap stocks hitting the 52-week new lows list... #FinanciallyINsync #HighLowShow #marketUpdate #investing
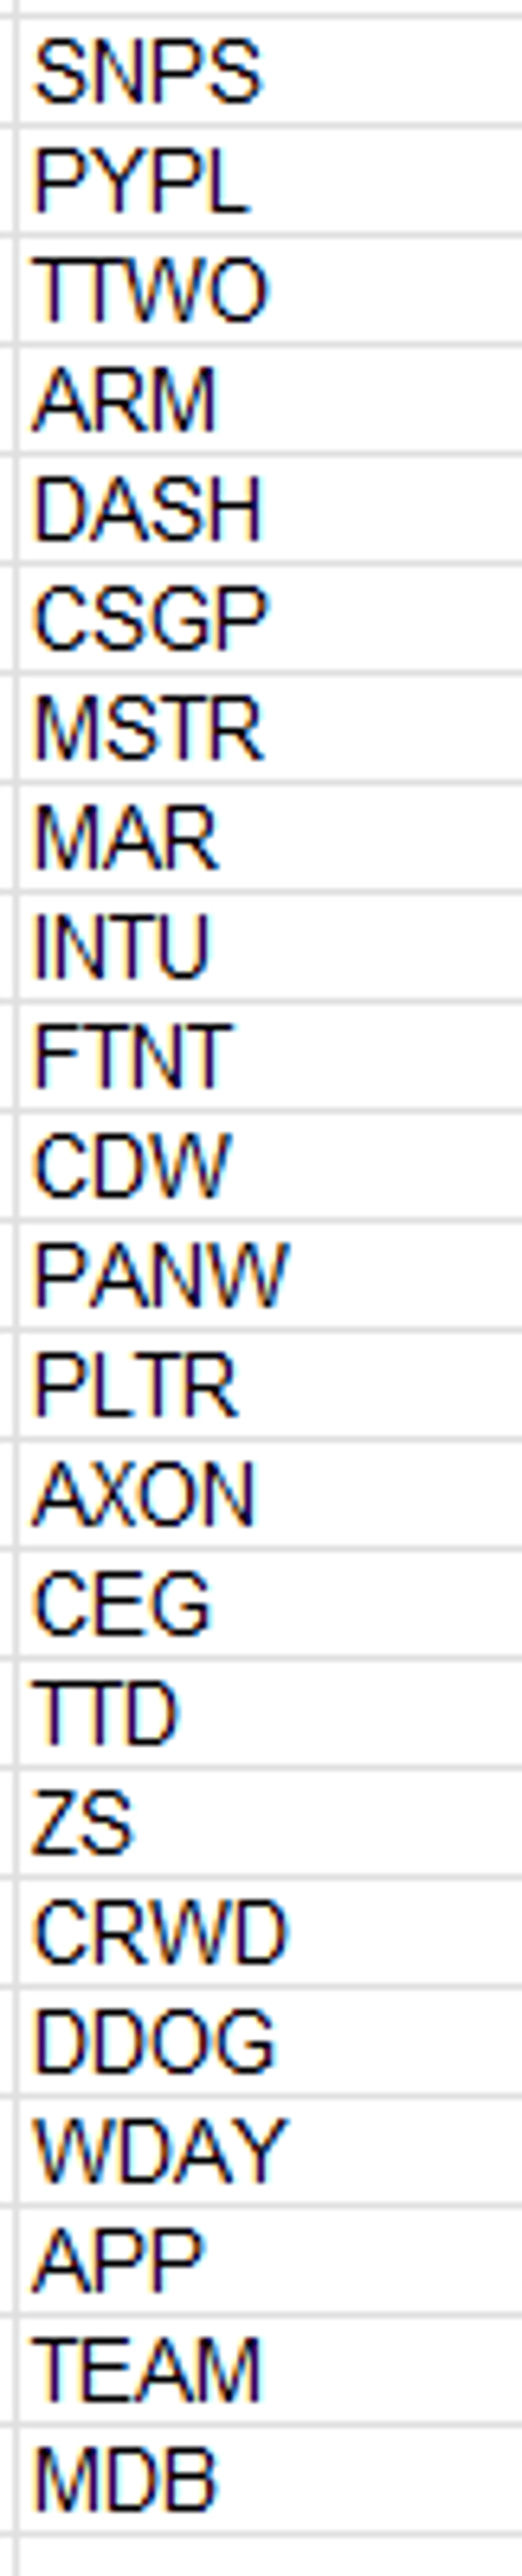
23 QQQ Stocks Rally over 4% From Intraday Lows
there are 23 stocks in the $QQQ that are +4%+ from their intraday lows... https://t.co/SGN4Kt6jhn
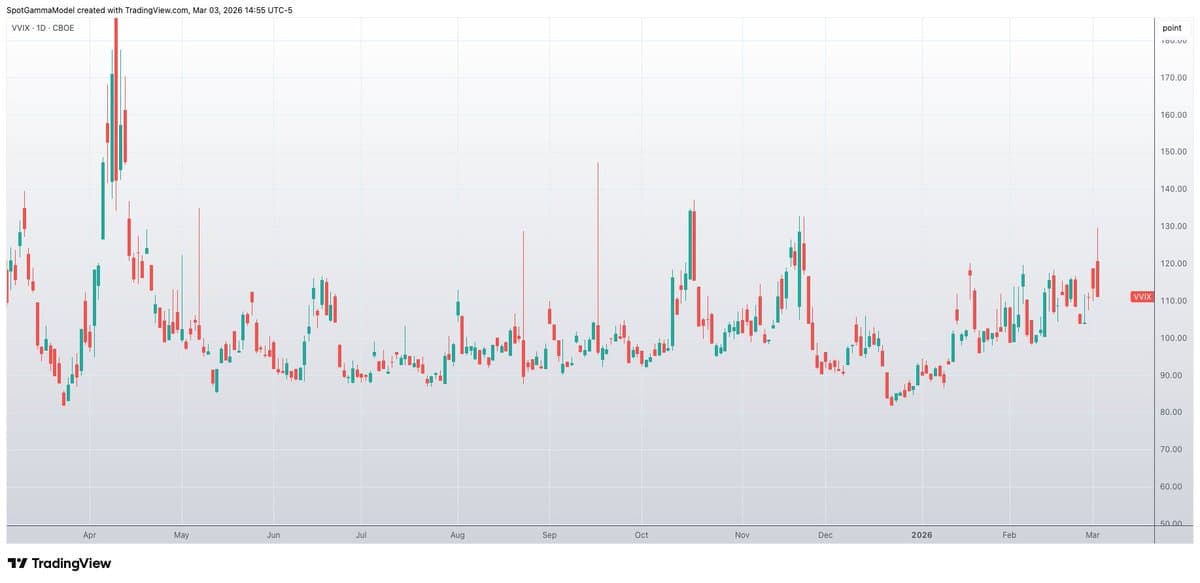
VVIX Above 125 Signals 5‑Day Positive Returns
VVIX >125 this AM correlates with pretty positive forward returns >=5 days out https://t.co/FCX5fvZMOi https://t.co/Tn8krhl4YQ
BAC Hints at Reversal; I Hold Personal
$BAC showing signs of reversing. I have some in my investment/spec/gamble account. None in trade account.
IGV Holds $80, Forms
$igv held $80 and made a higher low like many Software names including $msft $now $orcl. For tactical Cash flow
SPY Rebounds to $682, Easing Market Pressure
Yes. Pretty amazing that $spy reclaimed $675 to relieve some pressure. Now it’s $682+ to manage
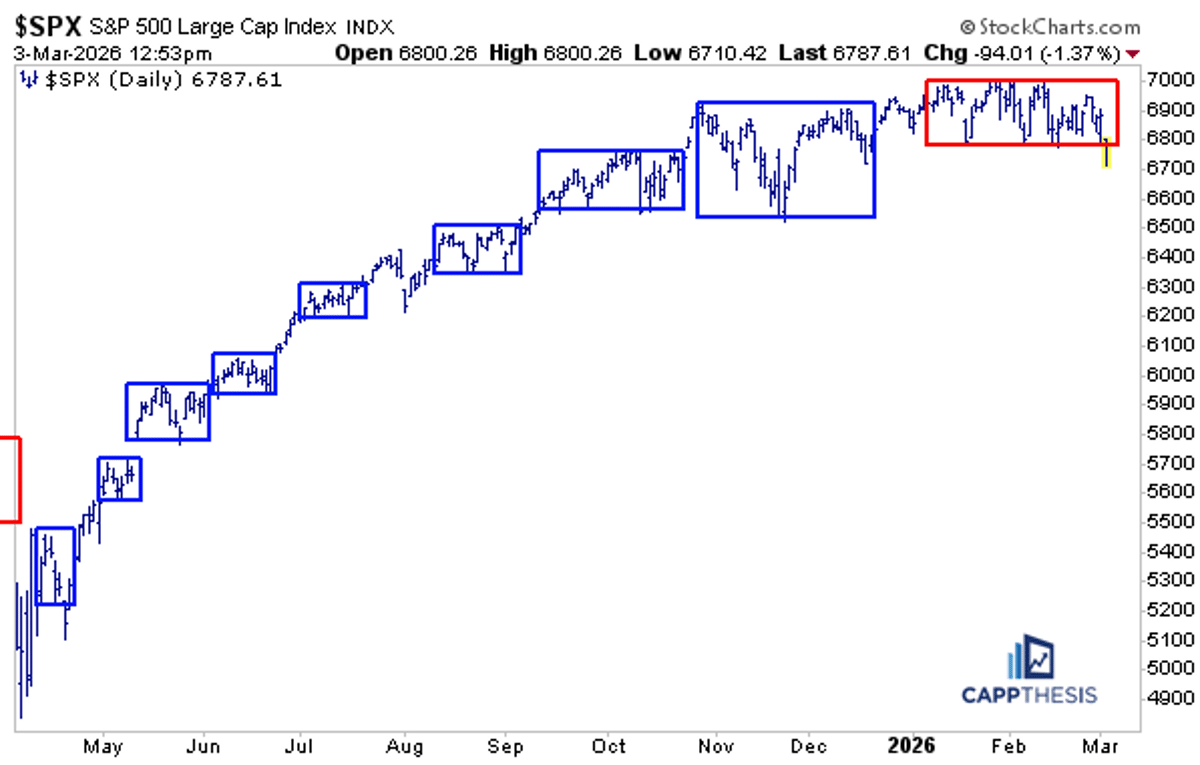
SPX Tests Lower Box Edge, Echoing 2025 Breakout
Given this week’s early price action, the $SPX now is testing the lower boundary of its latest trading range — what we classify as a trading box. As most readers know, we view these ranges as important reference points for risk...
Nifty50 Faces Crucial Support Tests Amid Volatility
Based on Monday’s India VIX and the geopolitical mess, I see 3 key supports for Nifty50 tomorrow (4th March): >> 24,500 >> 24,150 >> 23,450 Gift Nifty hints we may open below 24,500. If 24,150 holds, bulls survive....🔥 If the last support breaks, we’re not talking...

V Stock Forms Tight Base, Eyes 21‑MA Breakout
$V updated chart nice basing high and tight. A move over the 21ma next on my radar. https://t.co/0PKkcb17YC

Trade Your Own Way, Own the Outcome
Always make a call out or chart you see on X your own. Use your own style, time frame and rules. This might mean the buy is at higher levels like my $SOFI. My rules, my trade...
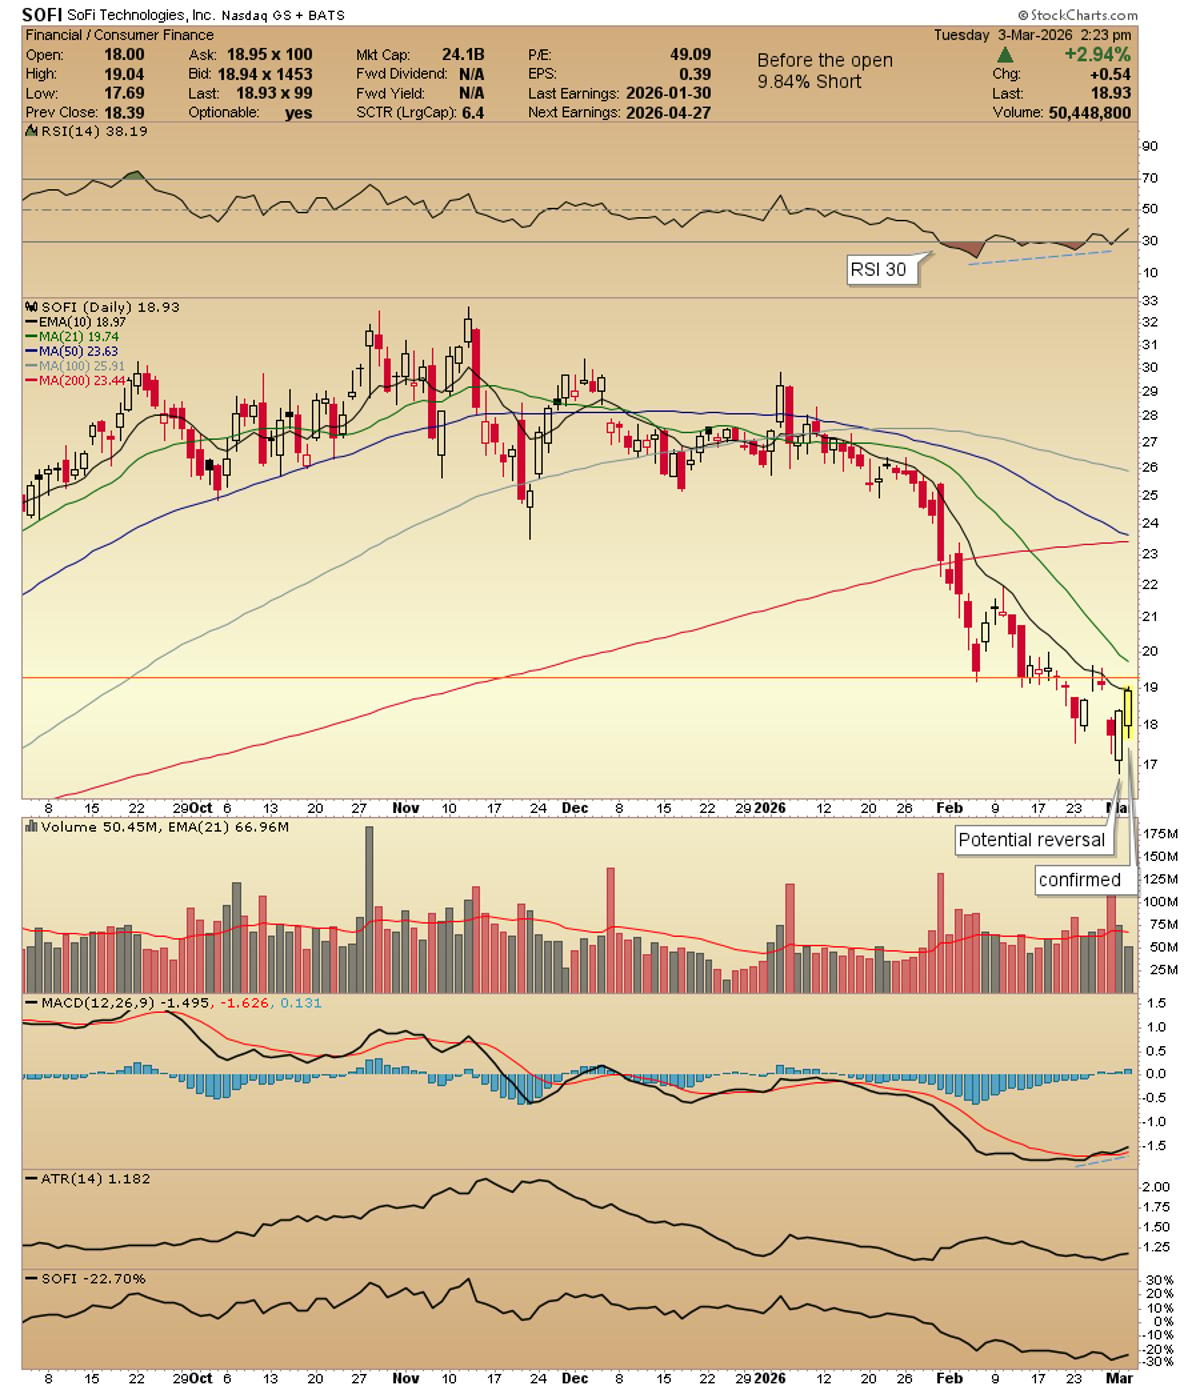
SOFI Awaiting Confirmation Above 10‑EMA and Key Level
$SOFI I have a trading pal who brought this name up and bought it recently. I had to wait for the confirmation stick. A move and hold over the 10ema and the horizontal line on the chart...
ONDS Rebounds From Base, Retests Support Level
$ONDS once again touched the bottom of the base, broke higher and now back in the base. Watching it close

JPM Stock Holds Firm; Re‑enter Near Close
$JPM stops are stops. Looking at the daily again and my jump back in see closer to close
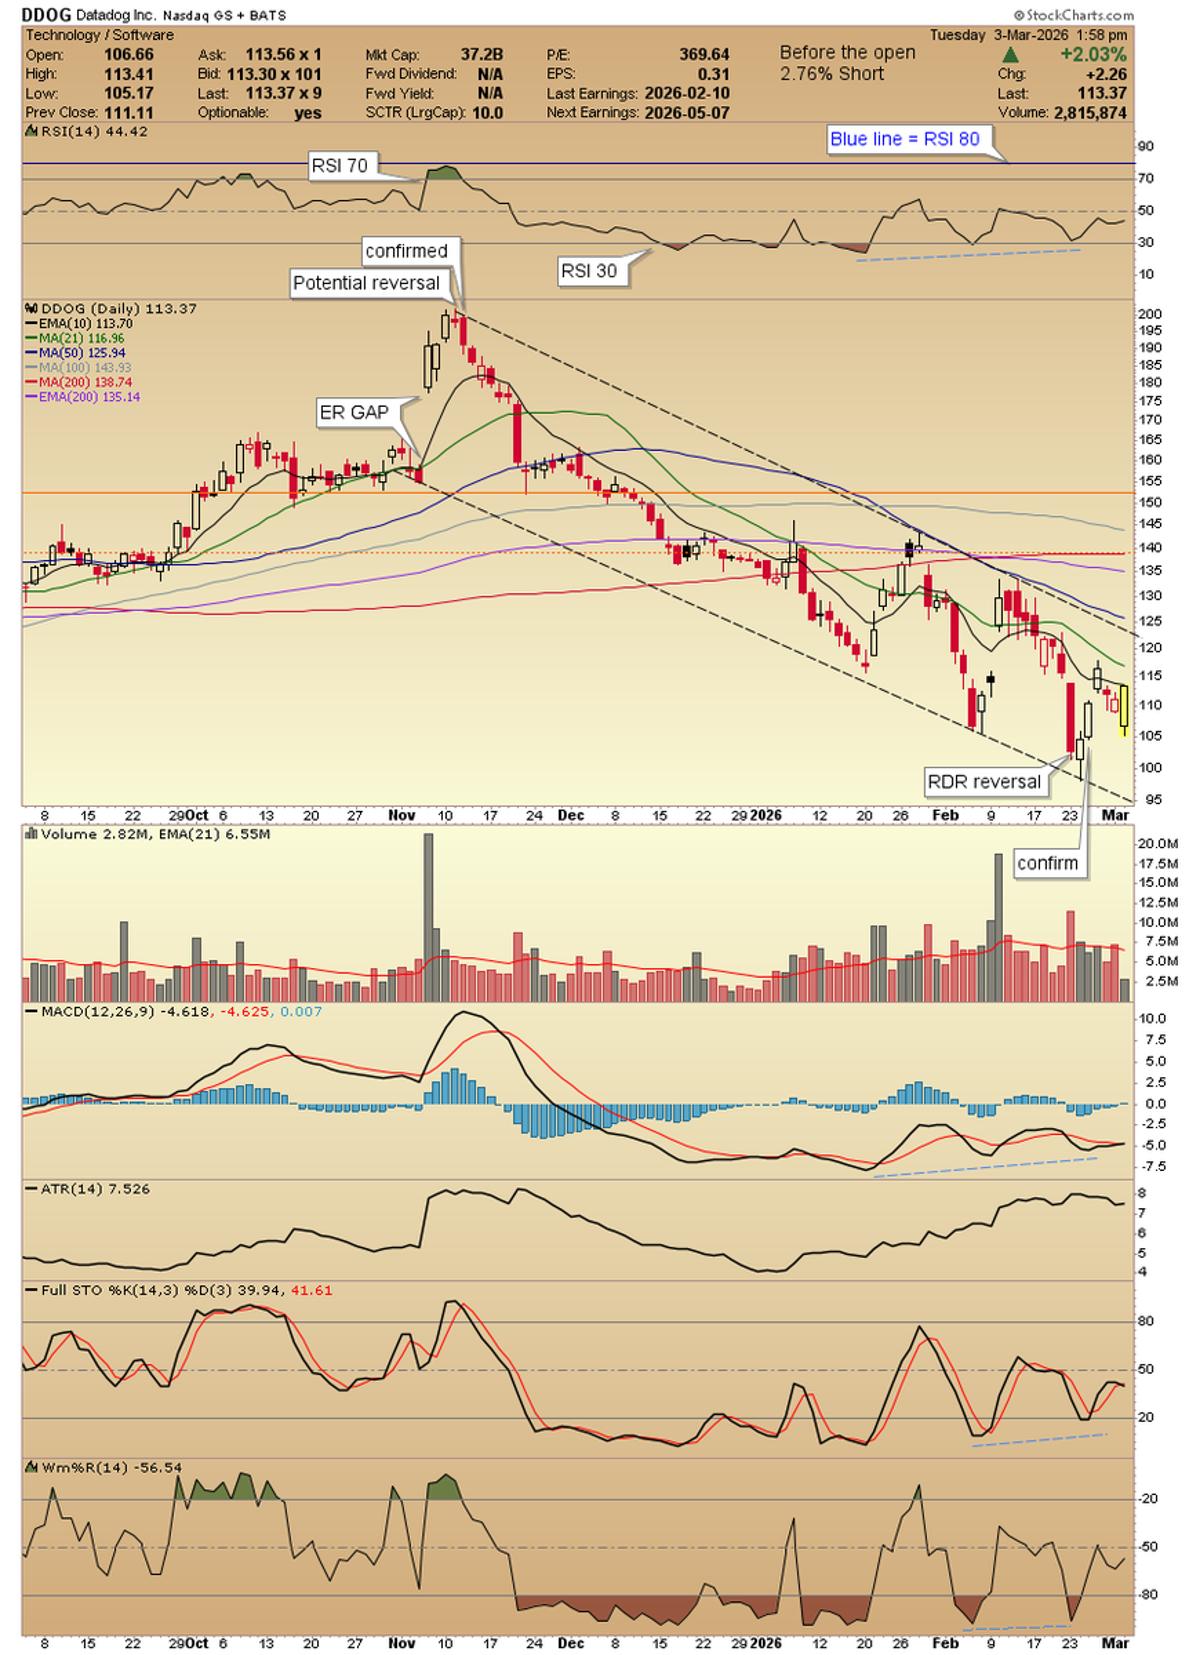
DDOG Stuck in Base, Needs
$DDOG continues to sit in the base. a move and hold over the 10/21ma's needed and then maybe the trade works. https://t.co/7vFbUIP7xA

IWM Gains 7 Points Yet Remains $3 Below Prior Close
$IWM Seven points off the lows, but still down $3 from the previous close. That is the new up. https://t.co/66p4vPZcEF
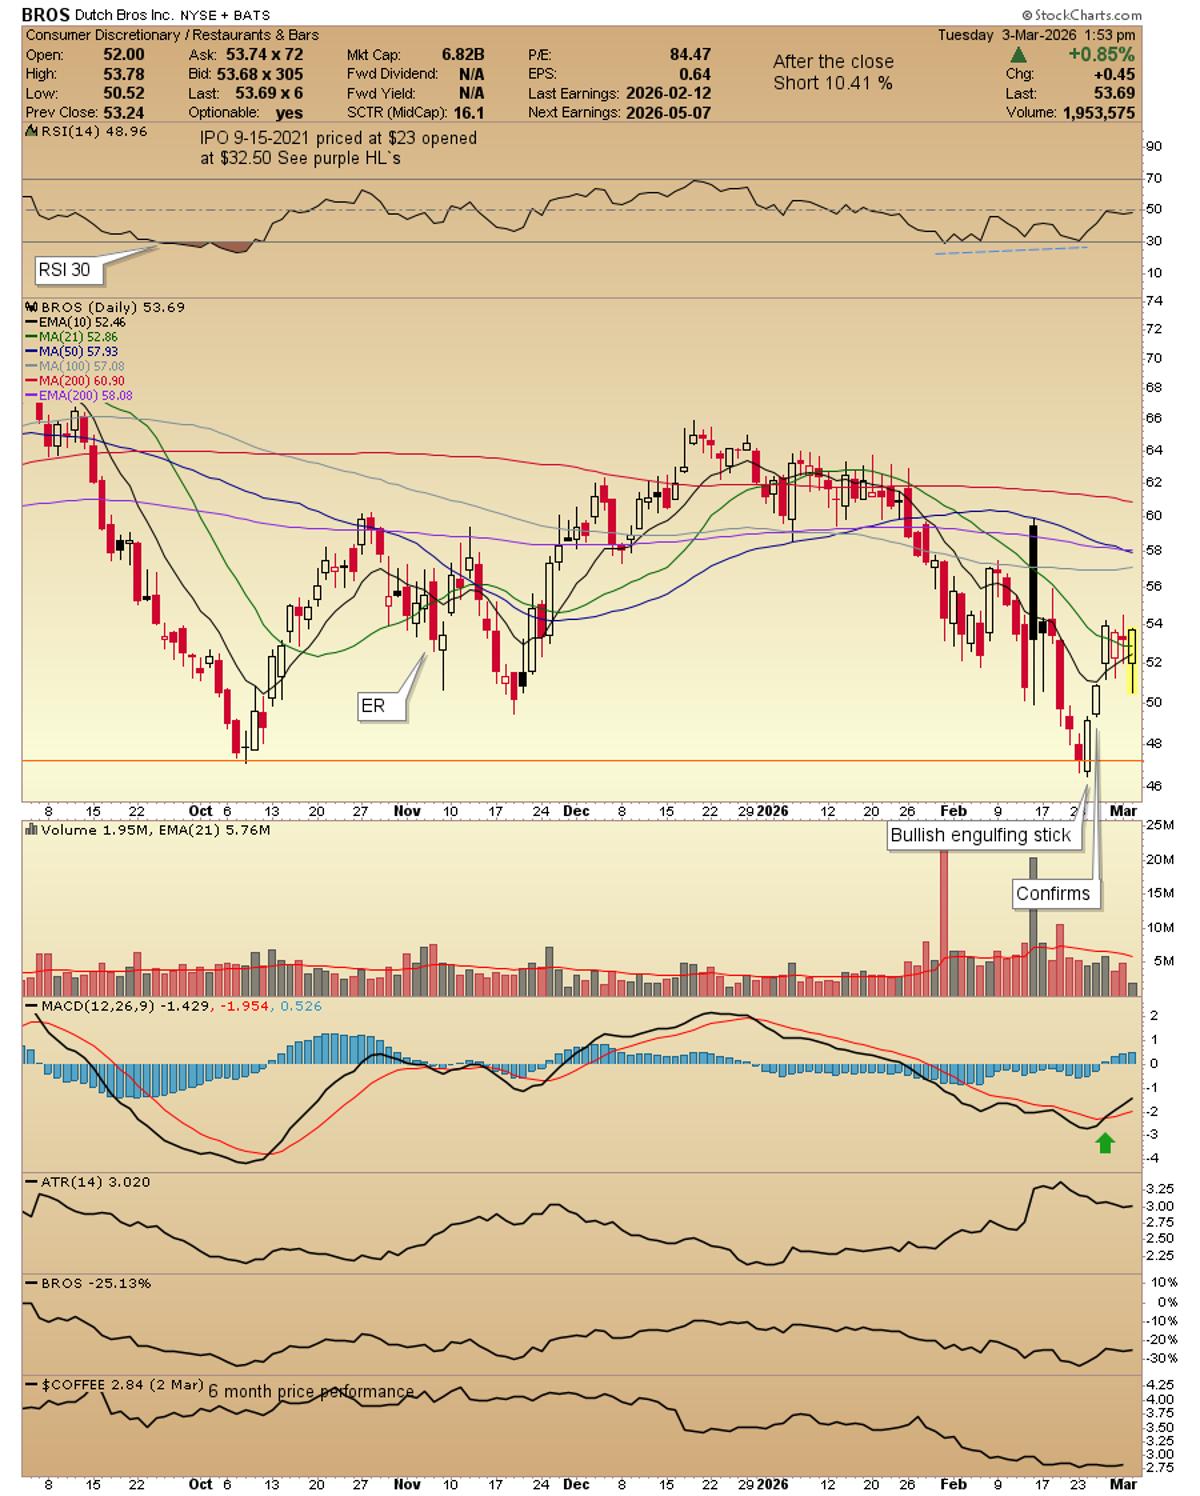
BROS Forms Tight High Base, Chart Analysis Shows
$BROS sitting in a high tight base. 2 charts one with all the indicators/ma's and one naked to zero in on the base. https://t.co/rBBh9Z9UnS
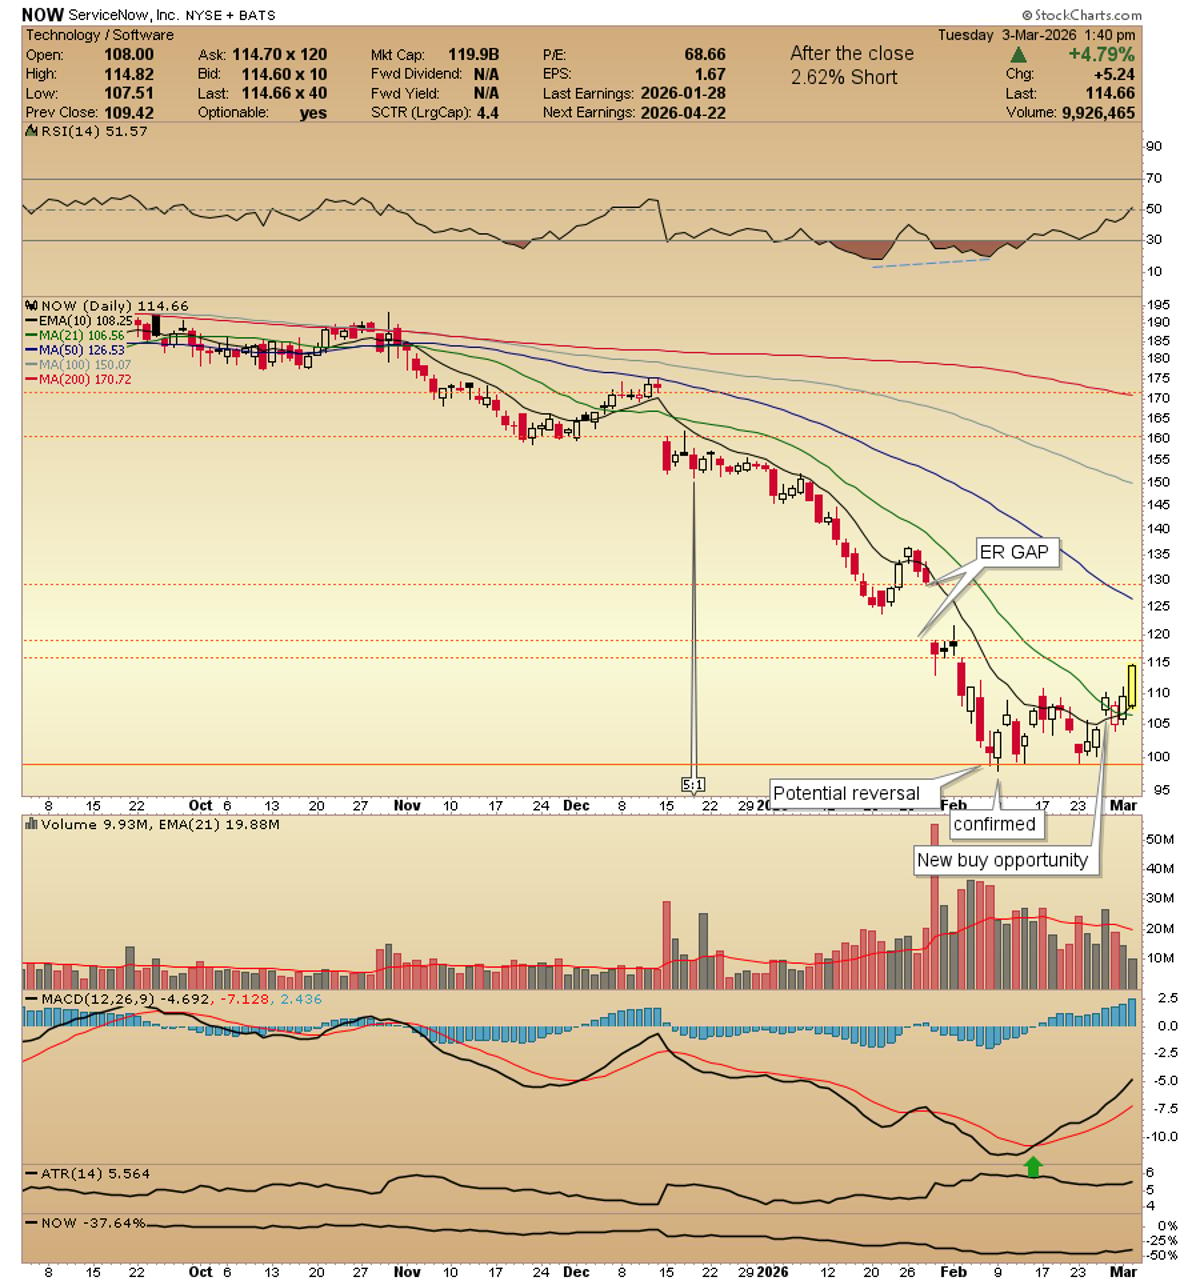
NOW Surges Amid Small Overhead Gaps, Large ER Gap
$NOW nice mover today watching the small gaps overhead and the big ER gap. What I see in the chart. https://t.co/Gola7E6MXM
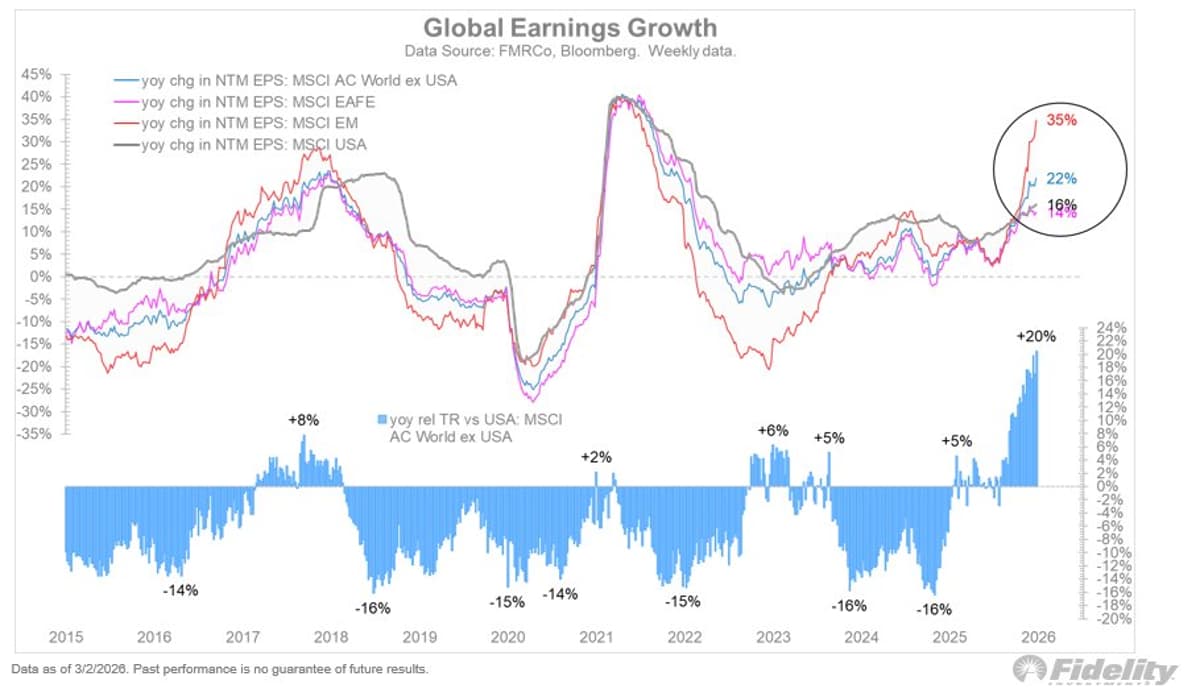
US Valuation Premium Shrinks as Global Earnings Surge
Global markets are at or near all-time highs, supported by strong earnings growth around the world. The rest of the world is outperforming the US on a combination of better earnings growth, competitive payout ratios, and lower valuations. As such,...

Corn Poised for $18 Breakout Amid Hot Wheat, Soy
$CORN Weekly. Wheat and Soybeans have been hot. But watch corn fund for long-term base bottom breakout above $18. Big-time input for broad economy https://t.co/yPBIFa6GwG
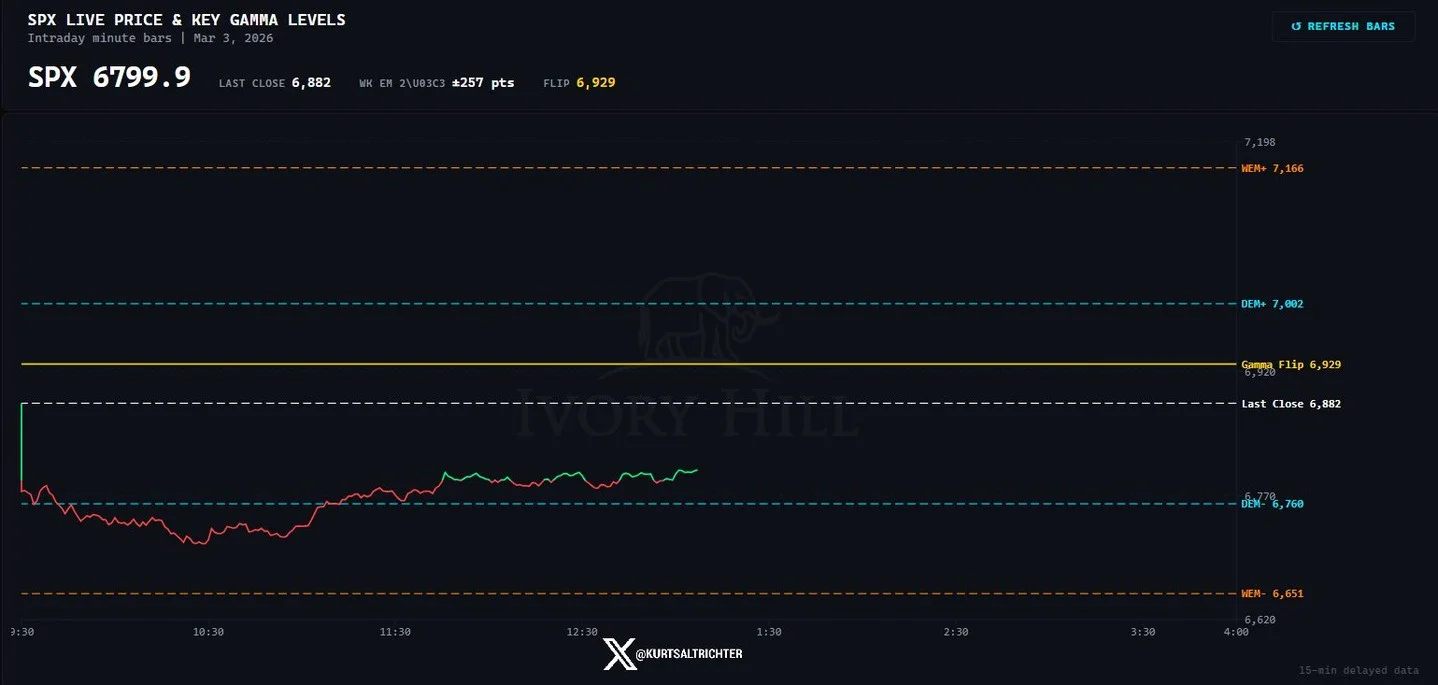
SPX Below Gamma Flip Signals Expanding Volatility
The $SPX is still below the gamma flip. That keeps us in negative gamma, meaning volatility can expand, and rallies can fade fast.

Gift Nifty Rebounds 250 Points to 24,400+
Good recovery in Gift Nifty 24145 to 24400+ 250 point up from day low. #usiran #GIFTNIFTY
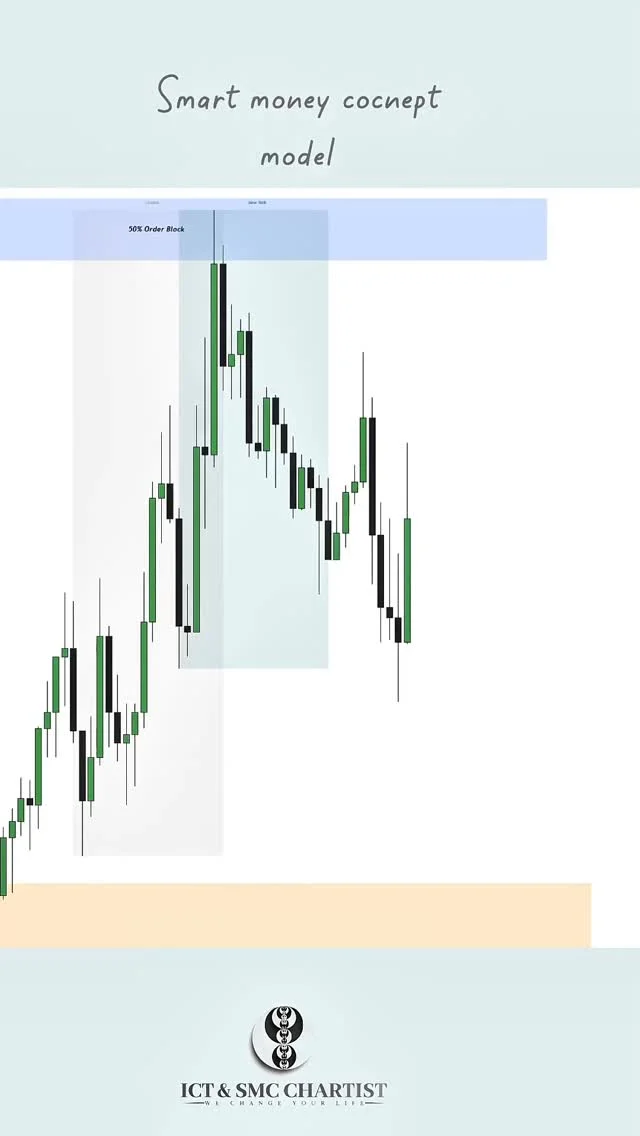
Read Smart Money: Turn Charts Into Predictable Maps
Smart Money Concept isn’t about guessing — it’s about understanding liquidity, structure, and institutional intent. Order Blocks. Break of Structure. Session timing. When you learn to read what smart money leaves behind, the chart stops being random. It becomes a map. Trade with logic. Execute...
Semiconductor Pullback Signals Broader Market Volatility
Joining @CNBCTheExchange in an hour to discuss market volatility, $SPX, and what the pullback in former leaders like $MU signals for semis #fairleadstrategies
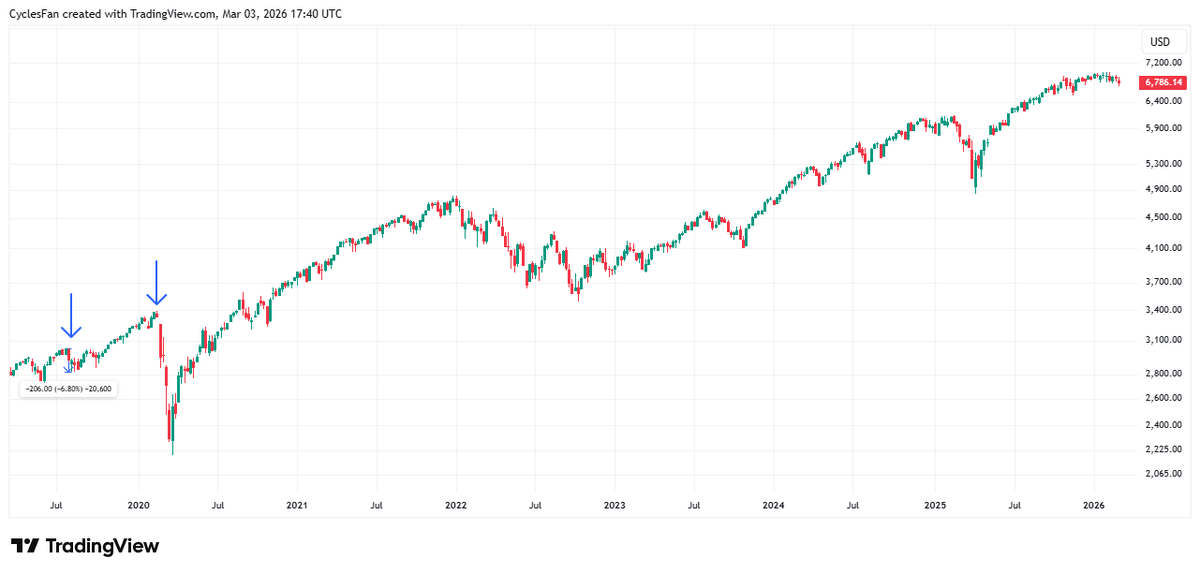
Series of Hindenburg Omens Echo 2020 Market Crash
Yesterday a 7th Omen was triggered. The last instances there was a cluster of 6 or 7 Omens were February 2020 and August 2019. Obviously this is not February 2020, but it's similar to the August 2019 downtrend in which...
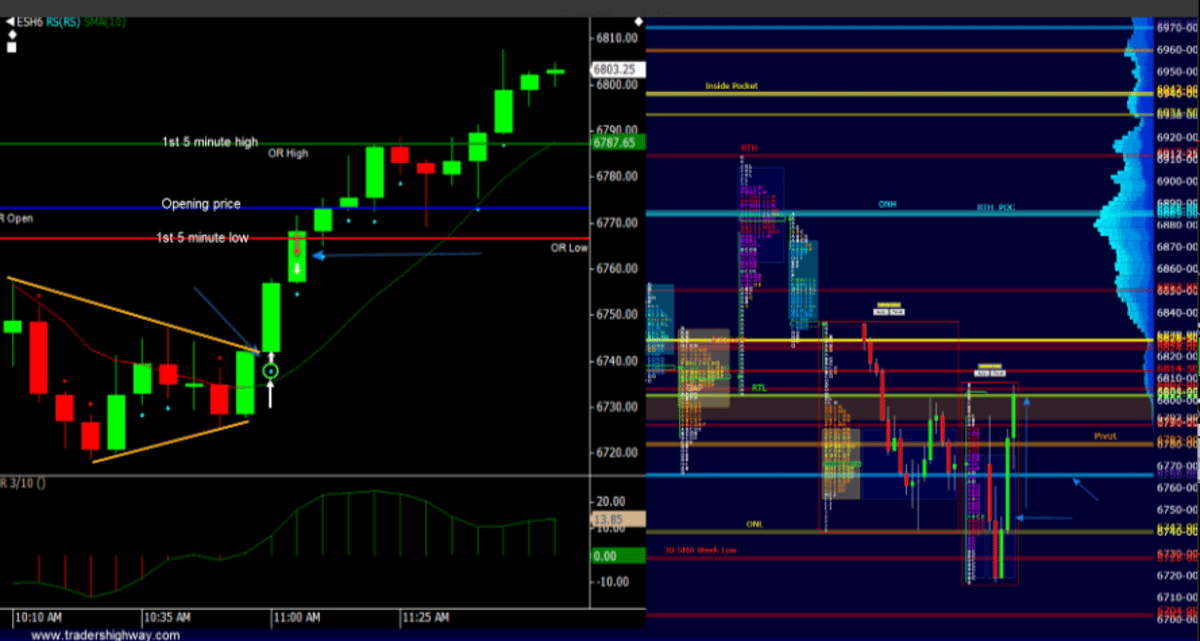
Damon’s Live Morning Trade Reveal and Market Profile
Damon's morning buy. (he shows his trades live online as well as his market profile work). #DamonPavlatos https://t.co/Hs8kF4Xy68
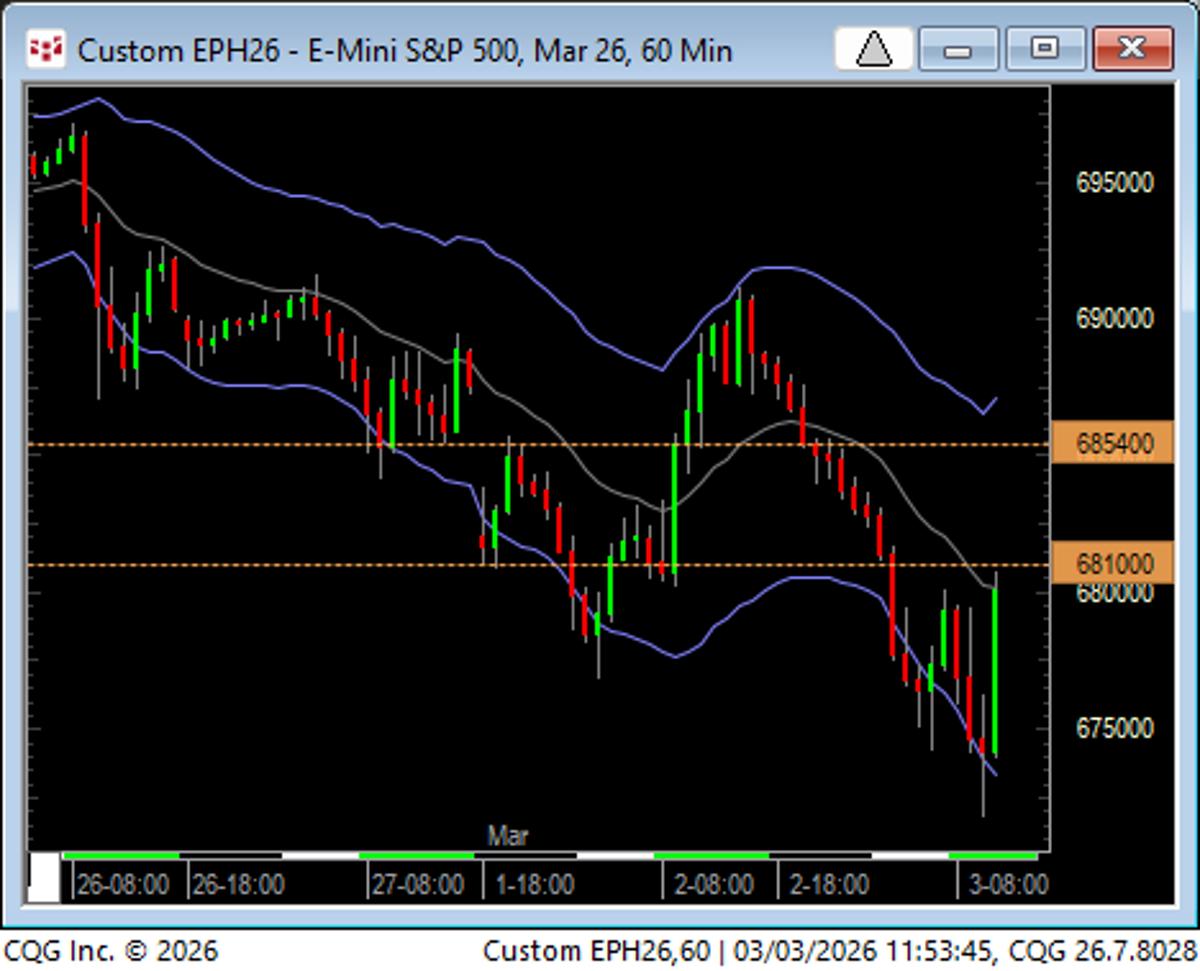
Market Likely to Reverse; Watch 6800 Threshold
Morning reaction up was best play of the day...now what? No leadership shares making new highs on the day (T and VZ do not count.) Close under or over 6800? Market rarely pulls same move two days in...
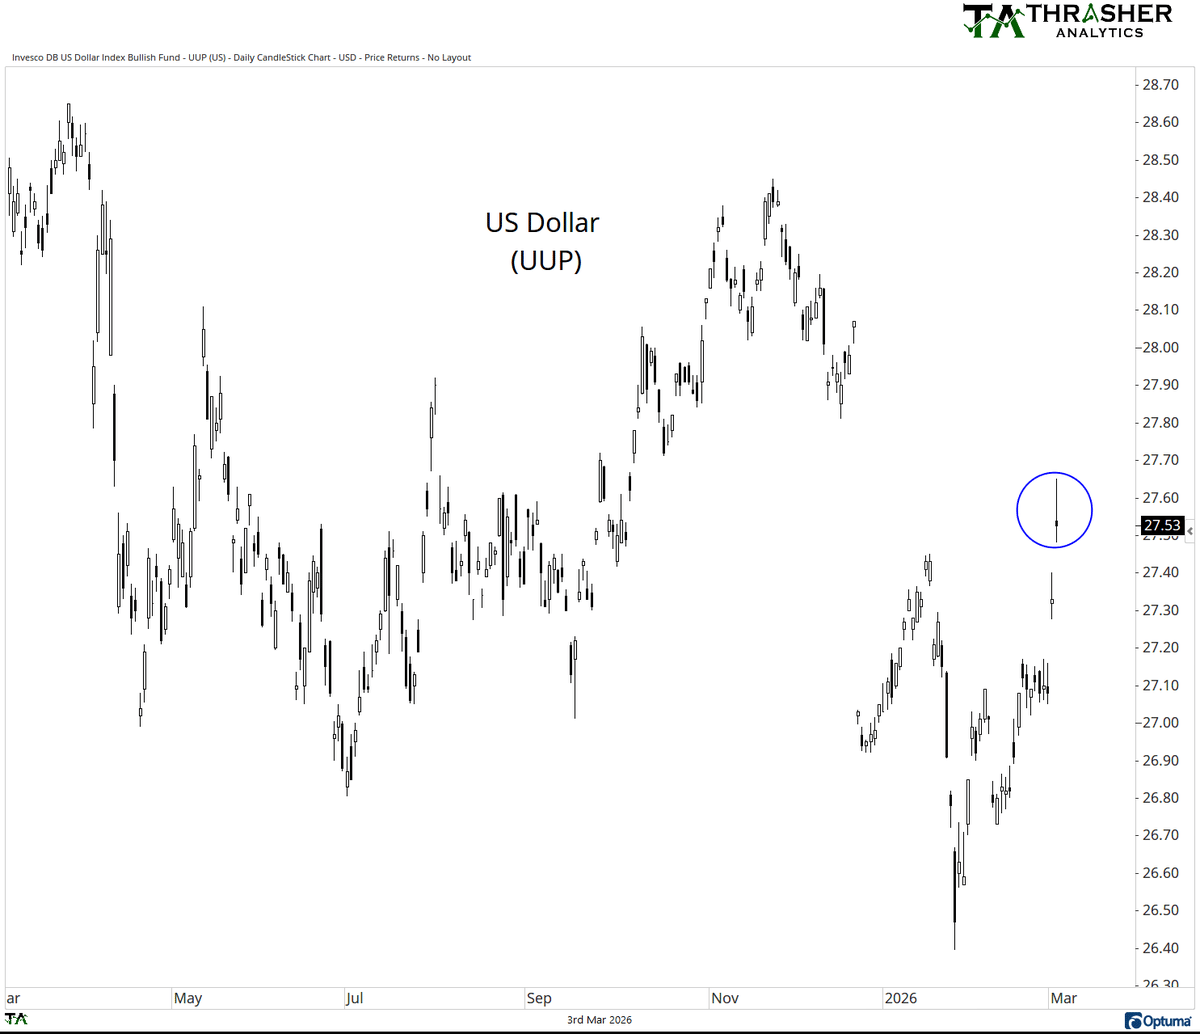
Dollar Surges to Highest Since Dec 2025, COT Data Shows
U.S. Dollar gapping up to the highest level since early Dec. '25. Written recently at Thrasher Analytics about the pot'l for dollar strength based on COT positioning data. $UUP $USD https://t.co/Q0aZULVSnr
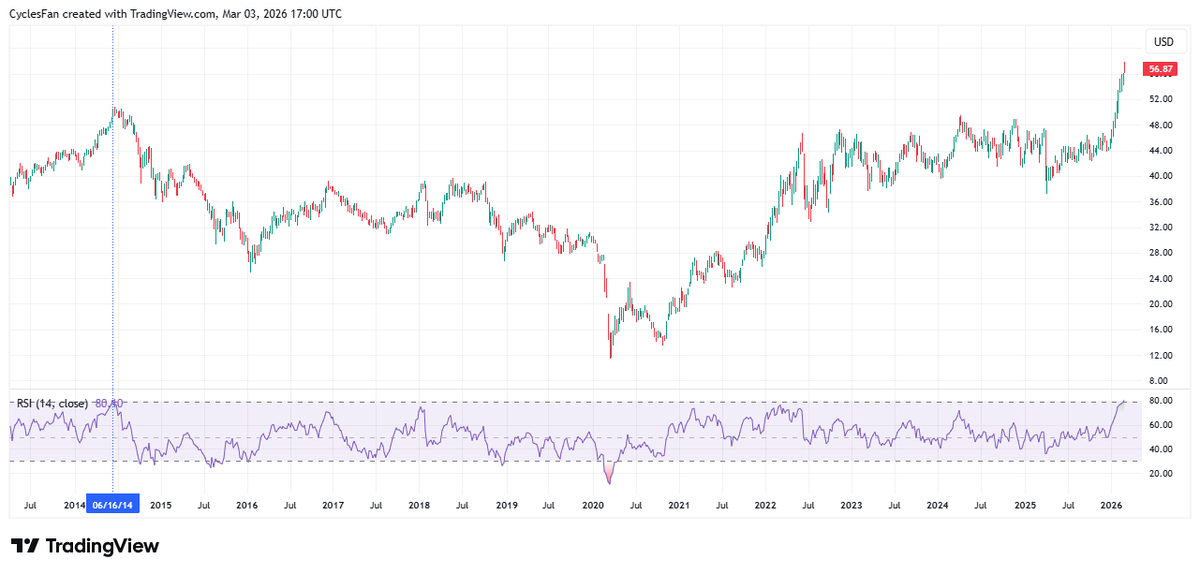
XLE RSI Hits 80, Echoing
$XLE - The 14 week RSI is currently around 80. The last time it reached 80 was in June 2014. The June 2014 top was a major top that was followed by an almost 6 year bear market. https://t.co/VHRCjpkX18
European Levels Drive Market Direction Despite US Chart Variance
Not as meaningful cavefill levels to upside (prefer to see on 120/240) but still, shows the importance of Europe levels. US session charts shows in a different way (8 AM EST) https://t.co/wQnjwcg9P9
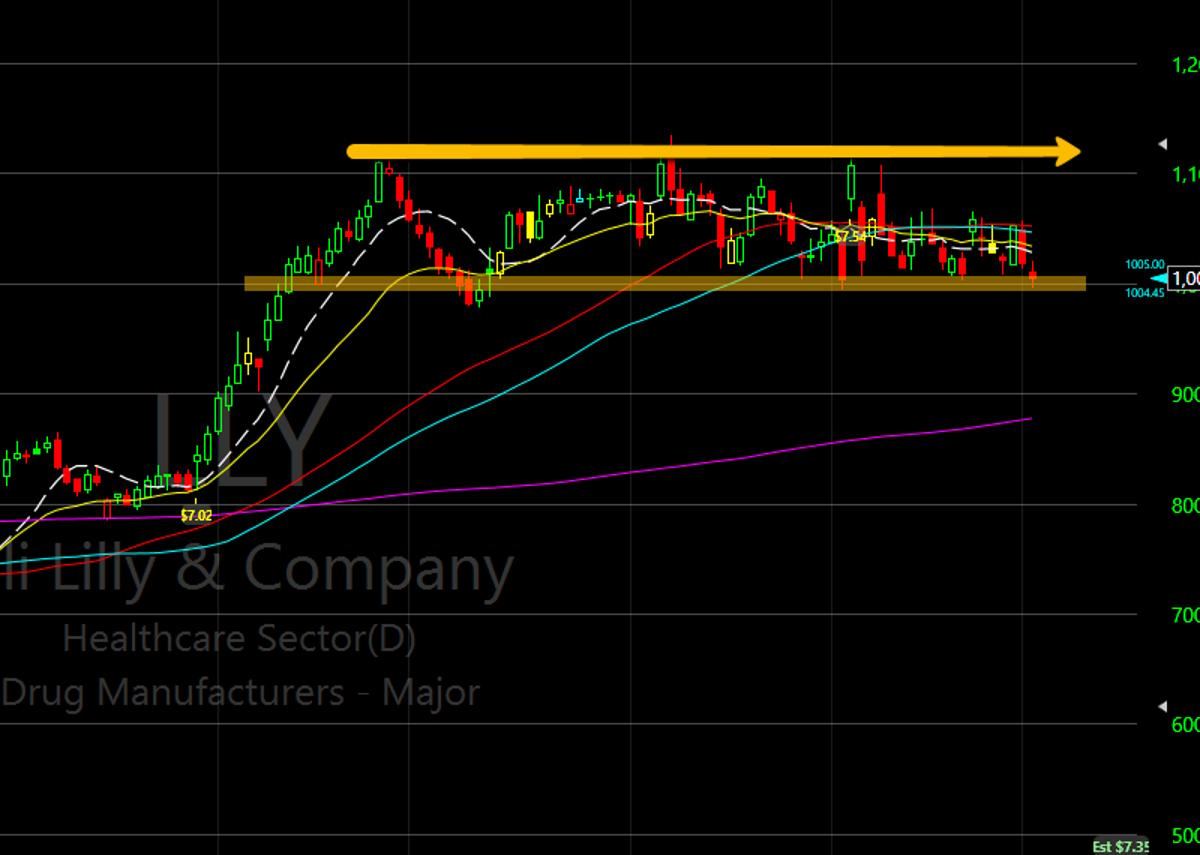
LLY Stagnant Under MA Umbrella; RETA Emerges Game‑Changer
$LLY sideways for 3 months, underneath the 10-day, 21-day, 50-day, and 63-day moving averages. A little umbrella top. But RETA. Goddamn RETA, powerful, game changer. https://t.co/89KoJgjmV2
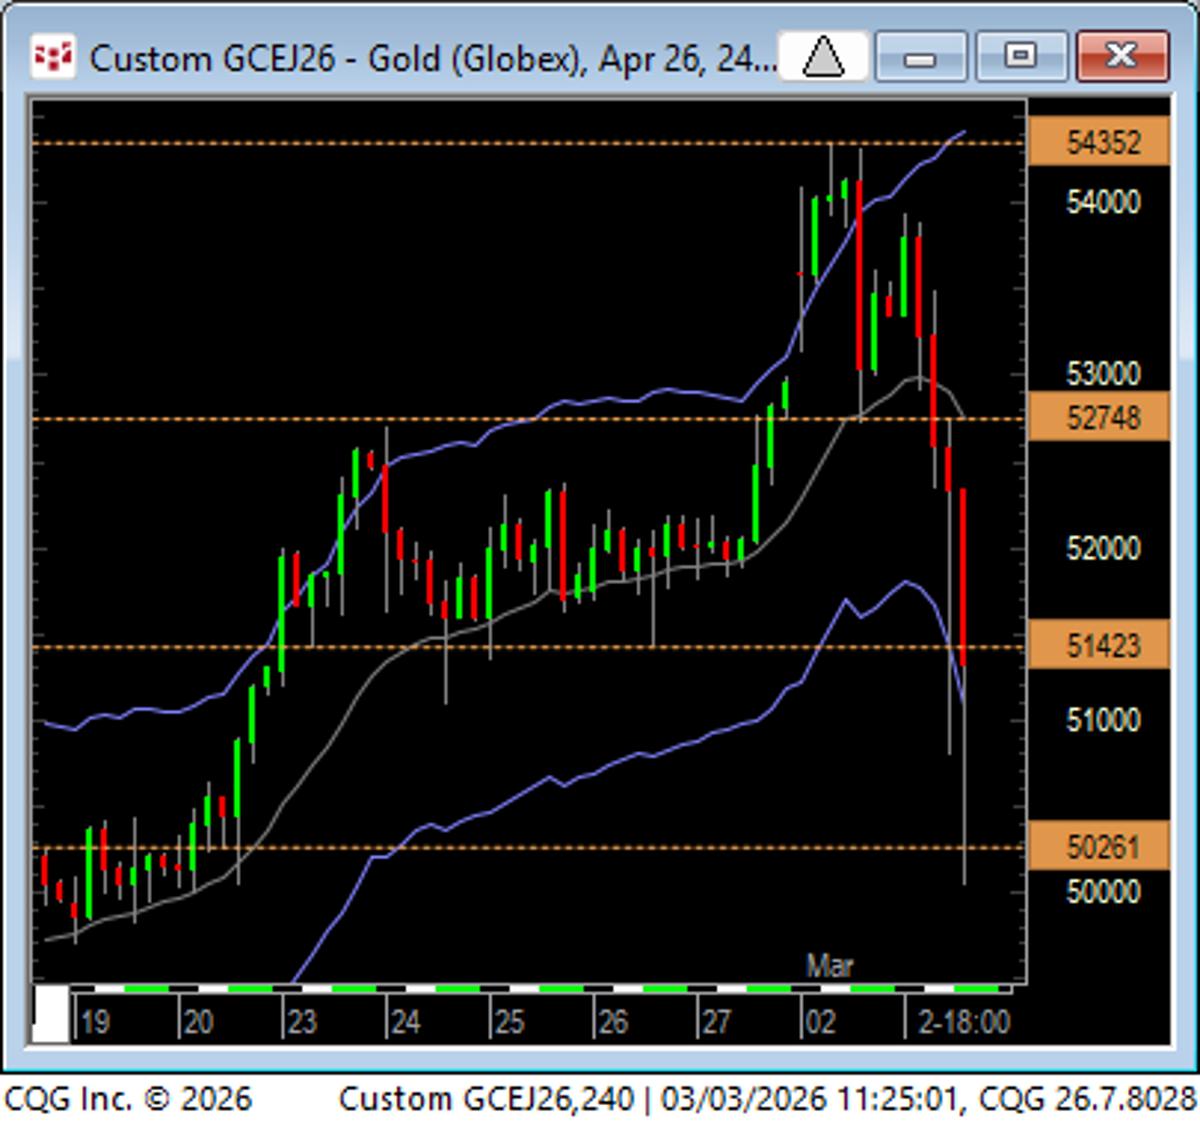
Technical Analysis Maps Levels; Market Decides the Outcome
Technical analysis isn't meant to be a prediction tool, but better used to show levels and momentum. Then it is up to Mr. Market to see how it trades. GC met the projected downside, but it did not have...
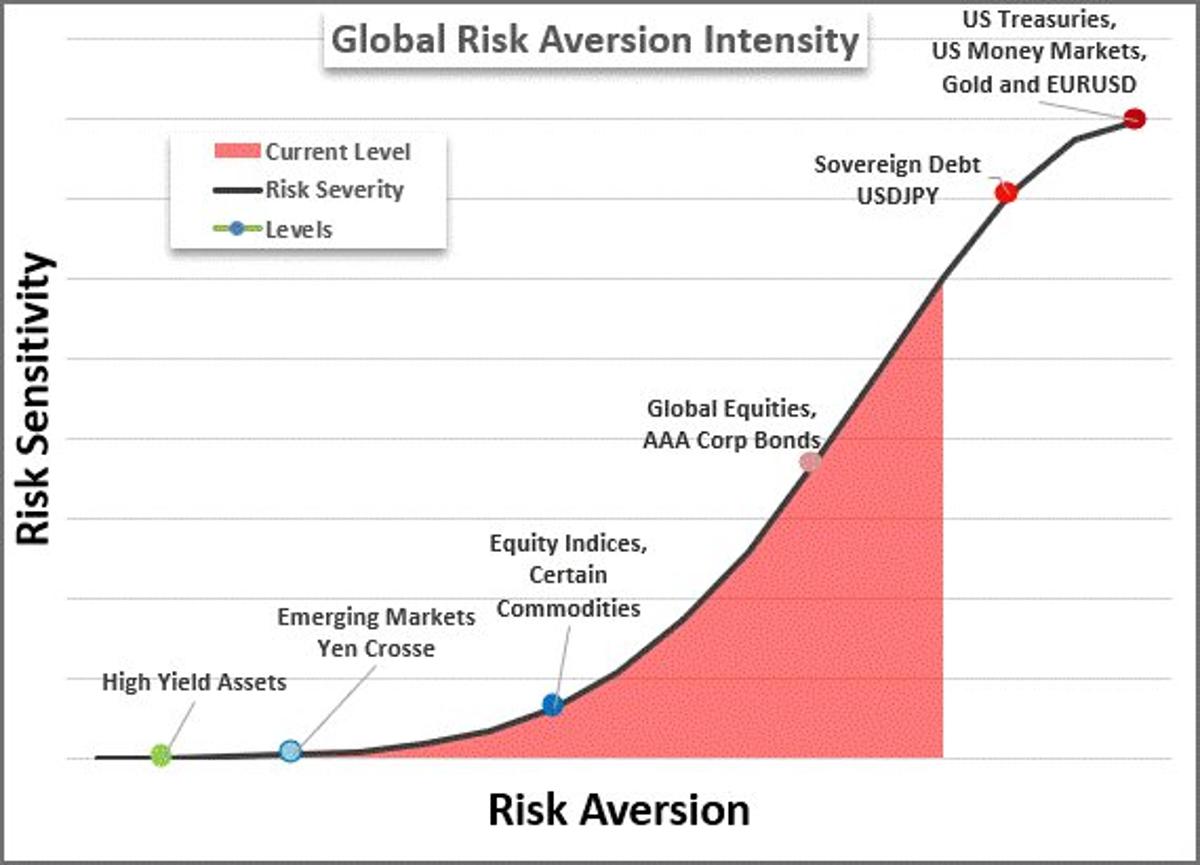
Markets Enter Risk‑Off: Liquidity Favored, Correlations Surge
I did a video on the overview of the 'risk off' position last night after the US close. We are shifting into the more intense, sentiment-driven scenario: higher correlations, preference for liquidity above most other features, more intense moves. https://t.co/wSiCdtzp9e https://t.co/sRCRYfdQxz
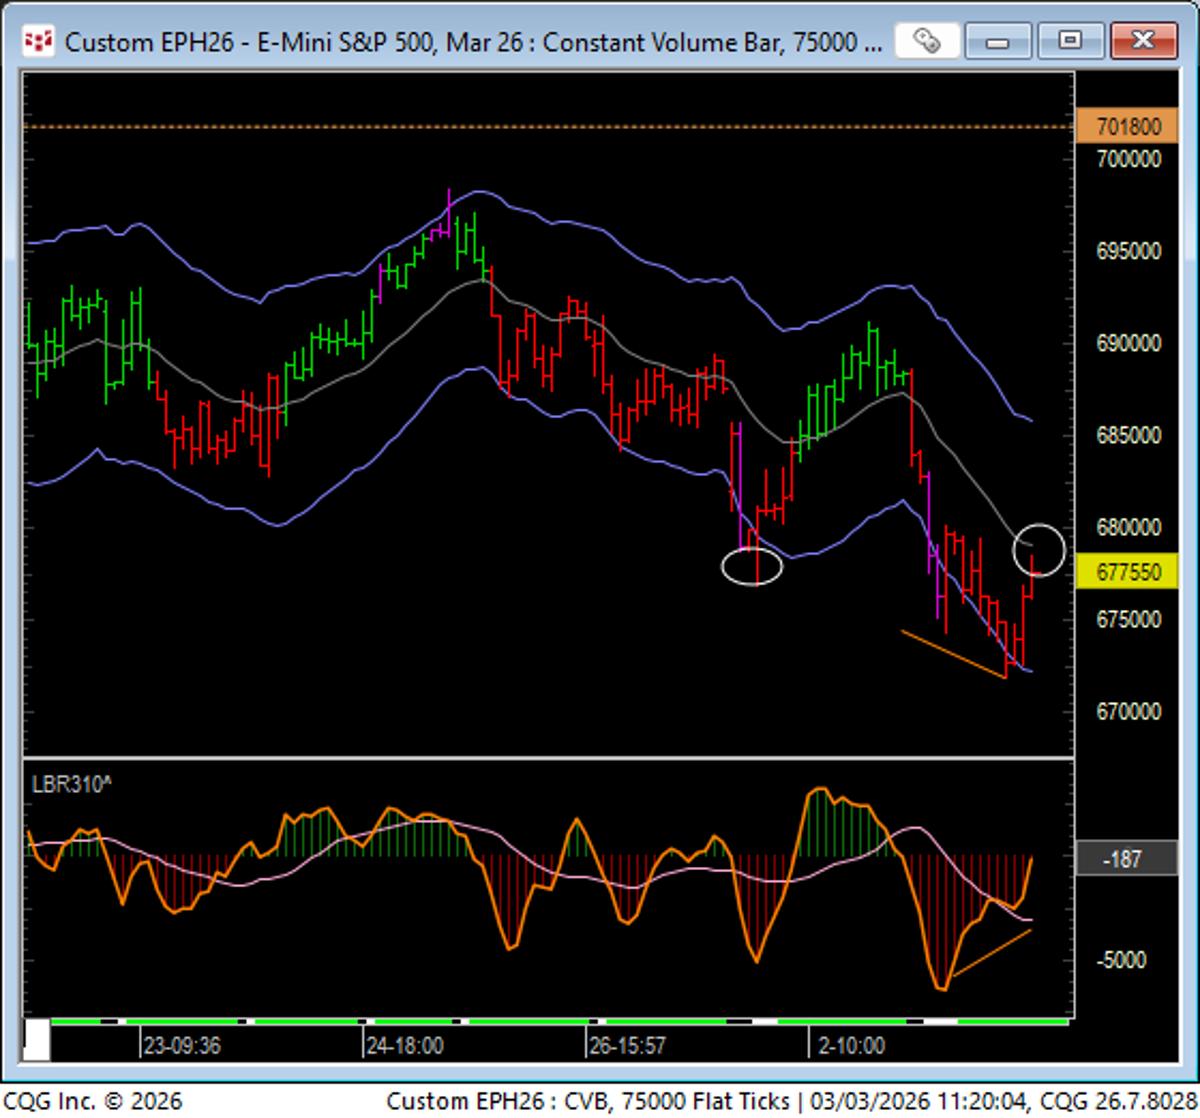
Markets Revert to Mean After First‑hour Surge
SP: technical reversion to the mean after time of day (end of first hour) climax on financials currencies, metals etc... https://t.co/Dgn0sGiXMm
The 2:1 Rule: Trading Math for Profitability
Here is a podcast I did with @Stansberry Research and explained how Trading is Math: ⬇️ The 2:1 Rule That Makes You Profitable https://t.co/bgnpbRBOw9