
Defensive Sectors Lag as Risk‑on Stocks Surge
Last week saw the defensive stuff lag (utilities, staples, and healthcare). While financials, industrials, and tech lead. Not exactly what you'd expect to see if this was a pure risk off environment. https://t.co/Fj8UAuTQM0

SPY Breaks 200‑day MA, Signaling Regime Shift
$SPY broke the 200-day moving average. First time since May 2025. That's not a dip. That's a regime change. JPMorgan just cut their year-end target. Next support: 6,000–6,200. The market is telling you exactly what it's pricing. https://t.co/rl7QY5Hj3L

Gold Set for Sharp Rebound After Emergency Fed Cut
Gold will bounce hard when fed Does emergency rate cut next week or two and all margin accounts stopped out. https://t.co/l3tZYexfCr

Weekly Outlook
S&P 500, Nasdaq, Dow Forecast for the Week Ahead https://t.co/OcHNiybaDE #SPX500 #Nasdaq #Dow Weekly Charts https://t.co/CFWjG0EJik

NVDA Eyes 161 Pivot, 146 Support if Broken
$NVDA - Headed to the yearly pivot at $161. If it breaks below 161 the next downside target would be the 100 week MA that is currently at 146. https://t.co/8WpdonkIVL

Slow Staircase Breakouts Win; Fast Spikes Signal Exhaustion
The best and worst patterns for Breakouts Best: - A slow, grinding staircase pattern approaching resistance. - Higher lows are stacking up. - Controlled, deliberate movement. Worst: - A fast vertical spike into resistance. - Price shoots up in one or two large candles. - This is exhaustion,...

Meta's Weekly Decline Signals Major Bottom Near 494
$META - Closed the week below the 100 week MA. The August top was confirmed as being a major top. The next support is the November low at 581 but it will likely get broken in the near future. The...

Free Guide to Master 6 Precise Fibonacci Patterns
Here’s a link below to a FREE Fibonacci Trading Strategy Guide (ebook): 📈📉 Learn the 6 Fibonacci Pattern Types that Create the Most Precise Price Levels, Targets, and Reversal Zones for traders. Click here: ⬇️ https://t.co/62UAf4L9jv Discover the 5 types that aren't...

Let Winners Run: One Good Month Offsets Two Bad Months
Once you become profitable as a trader or investor by cutting losses short and letting winners run…. One month of great profits will cover two bad months of losses. That’s just how trading works.

BTC Range Trading: Await Breakout, Target Volatility
Stuck in a range. Nothing special so far for $BTC. This means that we'll wait until it hits either side of the range. Or the lower bounds and we're seeking for longs. Or the higher bounds to take profits until a breakout happens...

Navigating Investor Strategies Amid Iran War Pullback
What are you doing as an investor during this market pullback from the Iran war?

Right‑size Your Trades: Bigger Isn’t Always Better
Bigger isn’t always better - how to calculate size in your trades #howtotrade #daytrading #momentum #tradingeducation #stockmarket

High‑beta Stocks Outshine Low‑volatility Amid Market Rally
As @JC_ParetsX recently mentioned, it is peculiar to see high beta outperforming low volatility during this recent surge lower. Not what you'd expect to see if things were as bad as they keep telling us. https://t.co/rGvxOprdO0

March 2022 Rally Shattered Downtrend, Defied Rate‑Hike Fears
The most recent genuinely vicious counter trend rally I recall was March 2022, SPX broke the YTD downtrend that had formed, reclaimed the 200 day moving average and then kept going for another week. Genuinely seemed like we had torn...

Market Faces Critical Crash Support, Selling Pressure Rises
Selling Into Critical Crash Level Support Poor breadth, rising yields, fragile support levels. Selling pressure builds as crash support zones come into focus. A technical review & why $SPX $6508 & $QQQ $578 matter. https://t.co/clgEWxEHum

NYSE A‑D Top Signals Mild 2026 S&P Dip
The NYSE and $SPX advance-decline lines topped in late February. There was no divergence at the top(an A-D line top before the S&P 500 top). Prior to every 4 year or 7 year cycle high in the past except one,...

MSFT Approaches 200‑Week MA, Eyes $367 Support
$MSFT is close to hitting its 200 week MA at $378. The target for the next major low is probably a bit lower: the 1st yearly support pivot at $367. https://t.co/AqEanatkFt

Oil’s $175 Hype Ignored by Topping Chart Signals
I know you all are excited in a perverse way for oil to hit $175 per barrel, but oil stock charts are overwhelmingly giving off topping and rolling over signals.

QQQ Trades 7 Points Above AVWAP Target
$QQQ A/H 7 points right off the potential main target Friday, that AVWAP from 2025 lows been highlighting (pink line) https://t.co/8ll74fb0fg

Portfolio Success Comes From Process, Not One Anchor
Gold was a loser this week. I own it. But our SELL calls on $QQQ, $SPY, #Bag7 $XLF $IWM? Those were winners. The whole portfolio is the process — not the one position your brain decided to anchor on

New Data Backs 5% Canary Theory Despite Market Anomalies
More data that supports the idea behind my 5% Canary paper. Markets don’t always follow historical precedence, but still important to know.
Massive Drops Expose Trapped Long Positions at Market Highs
$GLD down 19%, $GDX down 31%, $SLV down 44%, $SIL down 33%, $BTC down 44% off highs. Lots of trapped longs up there. Just remember those who were telling you to buy up there.

BTC Liquidation Hotspot Near $67k May Trigger Sweep
The largest concentration of liquidations for #BTC is currently around the ~$67k level. We could potentially revisit that level again to sweep that liquidity pool. https://t.co/RIZPgxfpcu
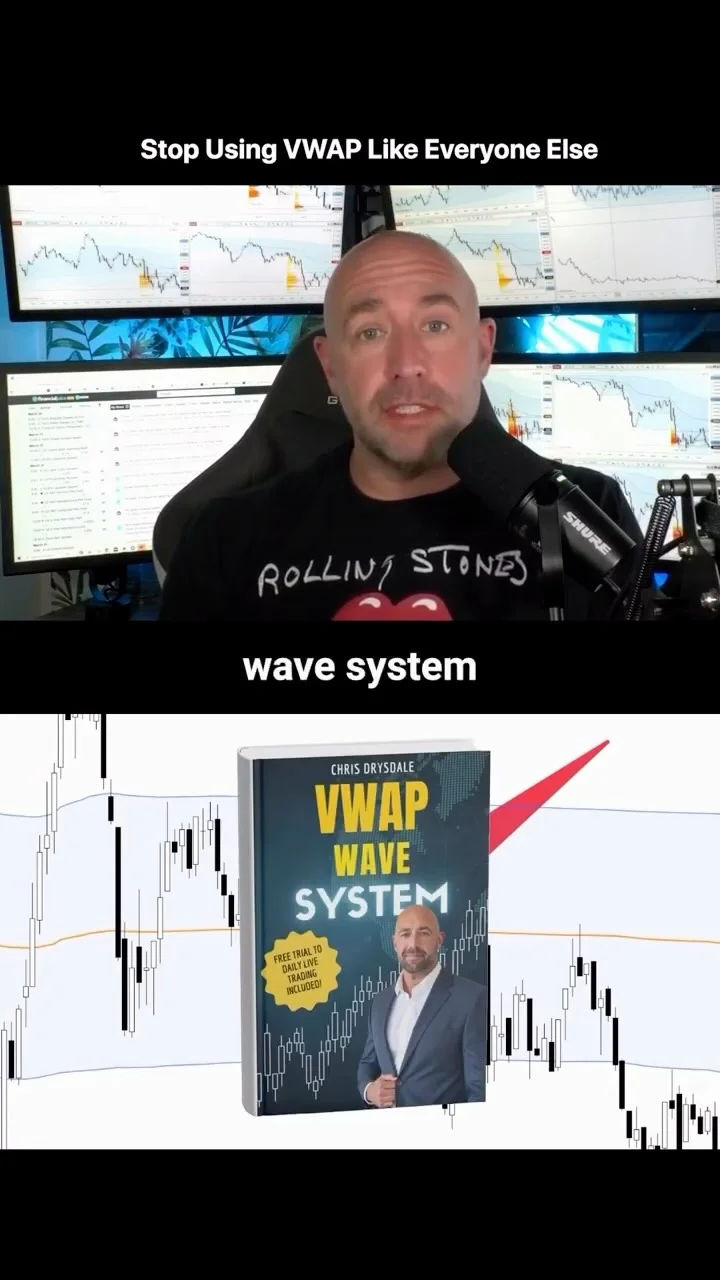
Most Traders Misuse VWAP—Switch to Anchored VWAP
You’re using VWAP wrong… and it’s costing you 💸 ⚡ The mistake 90% of traders make�⚡ Why VWAP bounces fail�⚡ Anchored VWAP = pro setup Same chart. Different context. Different outcome. 📚 Get the book (link in bio)�💬 Comment “VWAP” to join the...

Bear Pressure Builds, Yet Market Still Holds Firm
Technical damage and bear sentiment is piling up. But we still haven't seen the kind of washout or capitulation that usually marks a cleaner turning point. We discuss what we're looking for in this week's video. 📺Watch: https://t.co/ieSqgIPzbx $SPY...

Try Red Dog Reversal for Calculated Risk Reversals
If you're looking to play reversals with calculated risk, check out the Red Dog Reversal: https://t.co/KlcskeDF4s

Chart Not Yet Bearish, Trend Still Unclear
This is hardly the chart one could look at and say: "Wow, we are really in a bear trend" It may become a bear trend -- but it is NOT there yet $NQ_F

TLT Hits New Yearly Low, Eyes Low‑80s Support
$TLT - Made a new low for the year and is headed back to the low 80s. The next major support is the May 2025 low at 83.30. https://t.co/b3Nva3eIMx

Oversold NDX/QQQ Bounce Signals Potential Reversal
$NDX $QQQ remains in a DOWNTREND Our portfolio hedge triggered in early February (when price closed < red line). Yesterday, $NDX $QQQ bounced off November low. The market is very oversold and any good news will likely...

Silver Below 20‑Week MA Signals Potential Drop to $50
$Silver - Closed the week below the 20 week MA. That may lead to further downside to the yearly pivot at 61.33. If it breaks below 61 we will likely see a crash to 50, the level of the major...

Gold Below 20‑week MA; 4400 Break Could Trigger Crash
$Gold - Closed the week below the 20 week MA for the 1st time since 2023. Since it didn't break the February low(4402), I'm not sure it's significant. It depends on whether it holds above 4400 or not. If it...

Traders Lose Money on Exits, Not Entries
Most traders lose money on exits, not entries. @tradesviz's Multi-Timeframe Analysis data that proves it. Look at this chart. One trade, 7 different exit simulations: 🥲Actual exit: $320 profit 🤯Best possible exit (same risk): $13,221 🔴 That's a 2.4% exit efficiency. The trader captured almost...

Sell When Stock Falters Despite Positive News
“If all the news is great and the stock is not acting well, GET OUT -- which is a pretty simple thing most analysts don't know.” — Stanley Druckenmiller https://t.co/u0DM4EvSZp

Reduced Longs, Market Rose; Dips Now Look Promising
I kind of knew the market would go lower when we posted that we reduced our longs by 30% when SPX was like 6800 and the next session when it went to 6830 we already had like ten people on...

Frequent Monitoring of Rising Assets Signals Need to Trim
And if you find yourself looking often while it is going up then prolly time to trim some.

Gold Drops Despite Strong Technicals; Contrarian Wins
Unreal amount of why is gold down posts gold had more than doubled an was 100% above its 200 wma (highest since the 70's). Selling the news is not some big mystery. Keep in mind the largest returns came from...
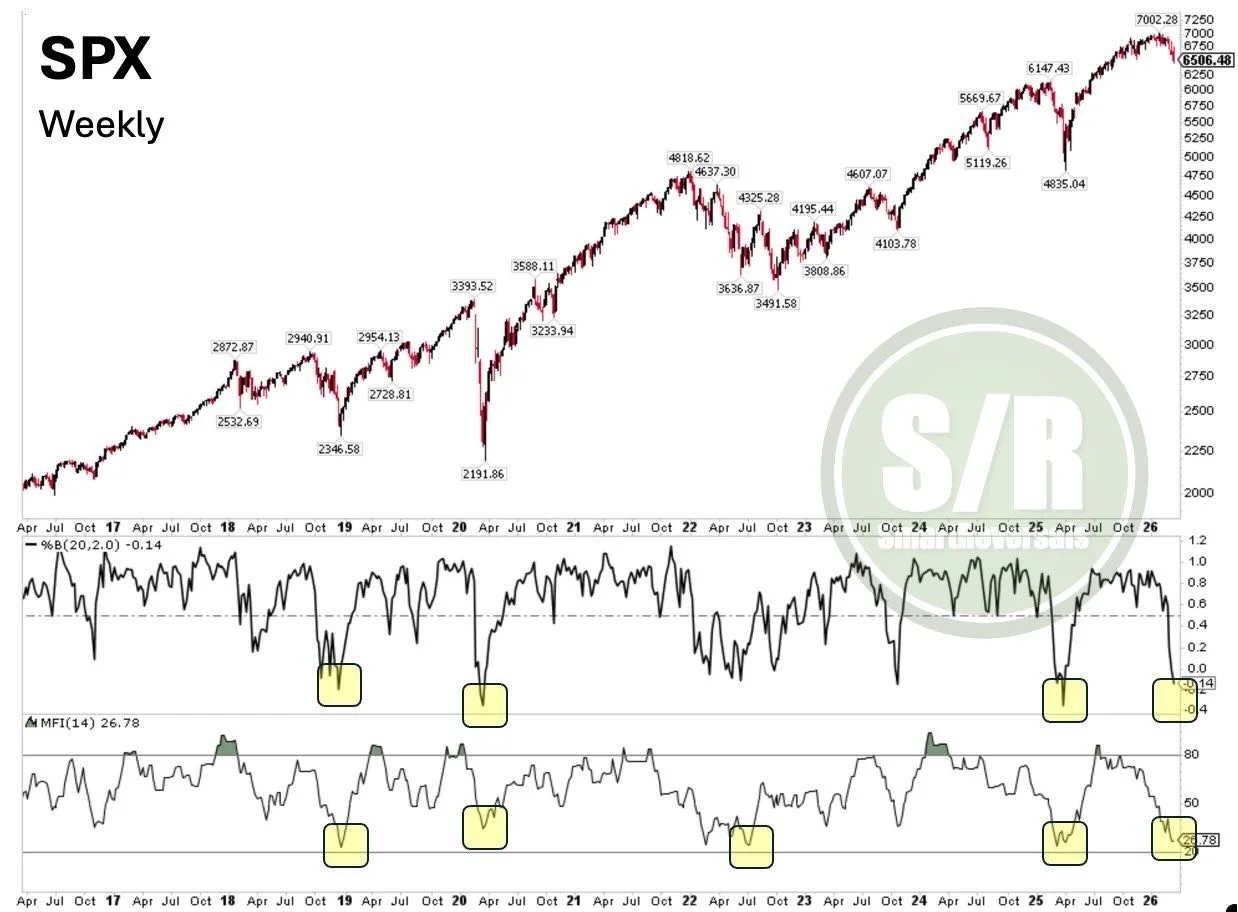
Time‑Based S&P Bottom Near; Money Flow Signals Reversal
#SPX: A bottom is near in terms of Time, not necessarily in terms of Price. Money Flow is nearing the 2018, 2022, and 2025 lows and has already dropped below the 2020 levels. While the %B is also oversold. After...
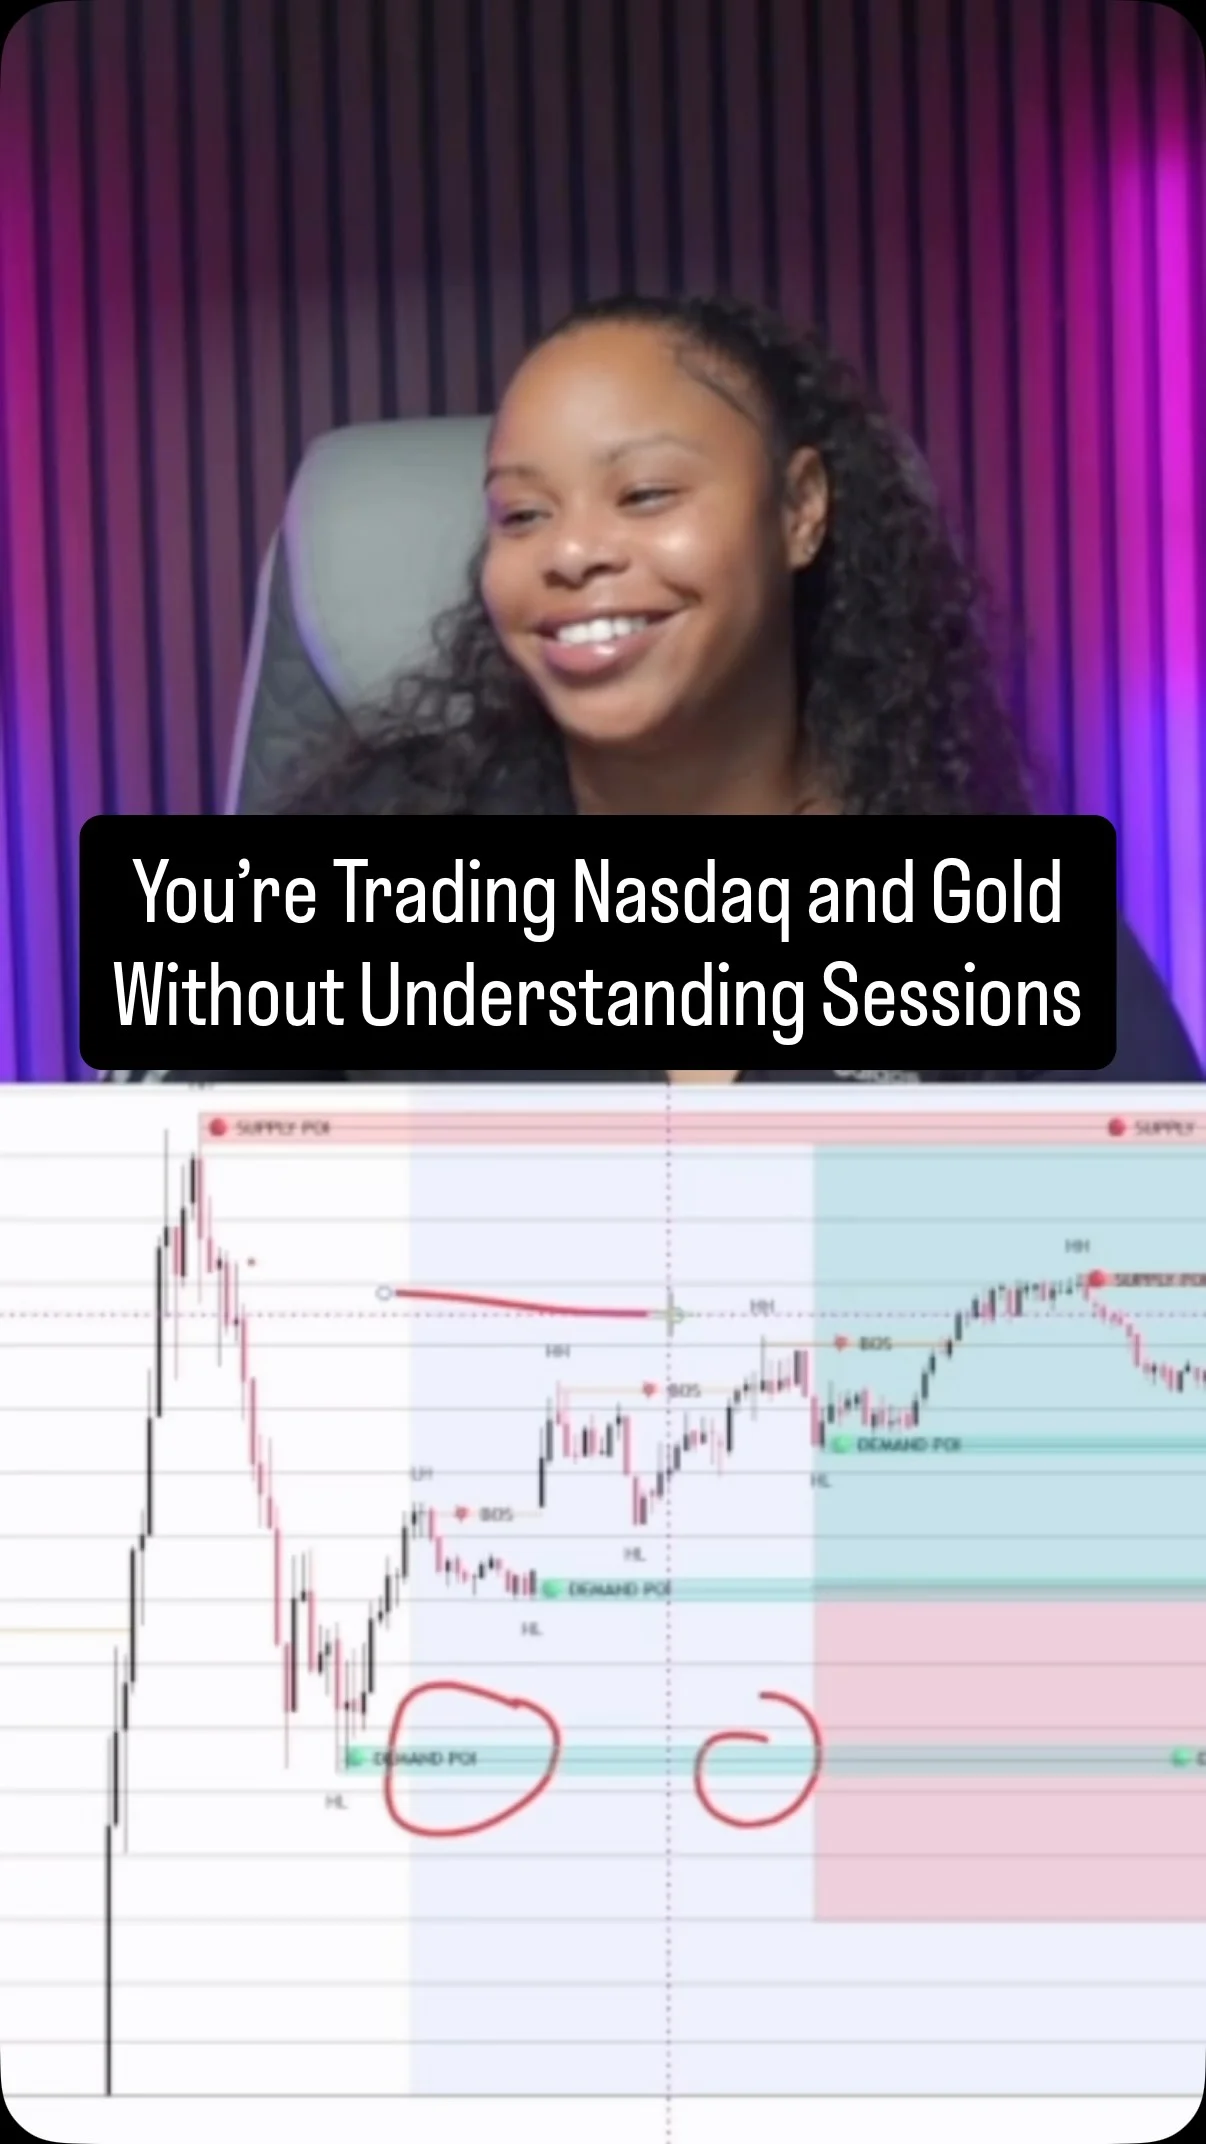
Use Asian Session Zones to Time Nasdaq, Gold Entries
Nasdaq and gold do not move the same in every session. The Asia session is usually slower and range bound. This is where supply and demand zones form and liquidity builds. Those levels matter. When London and New York open, price often reacts...

SMH Nears Critical $374 Threshold Amid Tech Weakness
$SMH (VanEck Semi ETF) in focus as many parts of Tech have begun to wobble a bit while QQQ just undercut last Nov lows. @IBDinvestors @marketsurge While still in consolidation here, any weekly close under $374 would be problematic...

Long MA Streaks End, but Returns Stay Steady
Since 1950, there have been 30 other times the S&P 500 was above it's 200-day MA for more than 200 days. Is it a bad thing when these long streaks end? Not really, as future returns appear to be about normal....

Rising Yields and Hawkish Fed Trigger Market Capitulation Risk
Markets rolled over this week as yields surged, the Fed stayed hawkish, and macro pressure built across the board. We break down the technical damage, what’s driving the risk-off move, and why a capitulation event could be next. $SPY $QQQ...

Don’t Chase Soaring Stocks; Volatility Can Erase Gains
Chasing stocks that are soaring can be tempting — but those gains can vanish quickly amid market volatility. https://t.co/sMK6GH12Xx

S&P Below 200‑Day MA Signals Historically Negative Returns
After 214 trading days, the S&P 500 closed beneath it's 200-day MA this week. Since 1950, when the S&P 500 closes above this trendline the annualized return is 21.1%. When it closes beneath? -22.2%. Proving once again that bad things tend to...

Missed 0DTE Move, Eyes Strong Week Ahead
Nice $SPY $NVDA scoops @IUTraders Sucks ... $USO took until AHs was super ready faded into close but closed out at bell. Been clean trader all week would have been a nice finish into weeks end. Tad bit frustrating cuz I...

AAII Bullish Sentiment Hits 7‑week Low, Bears Surge
AAII bulls have been lower than the week before for a record tying 7 weeks in a row. Good chance this continues next week. Lowest bulls since September and highest bears since May. https://t.co/rUf45a3UYv
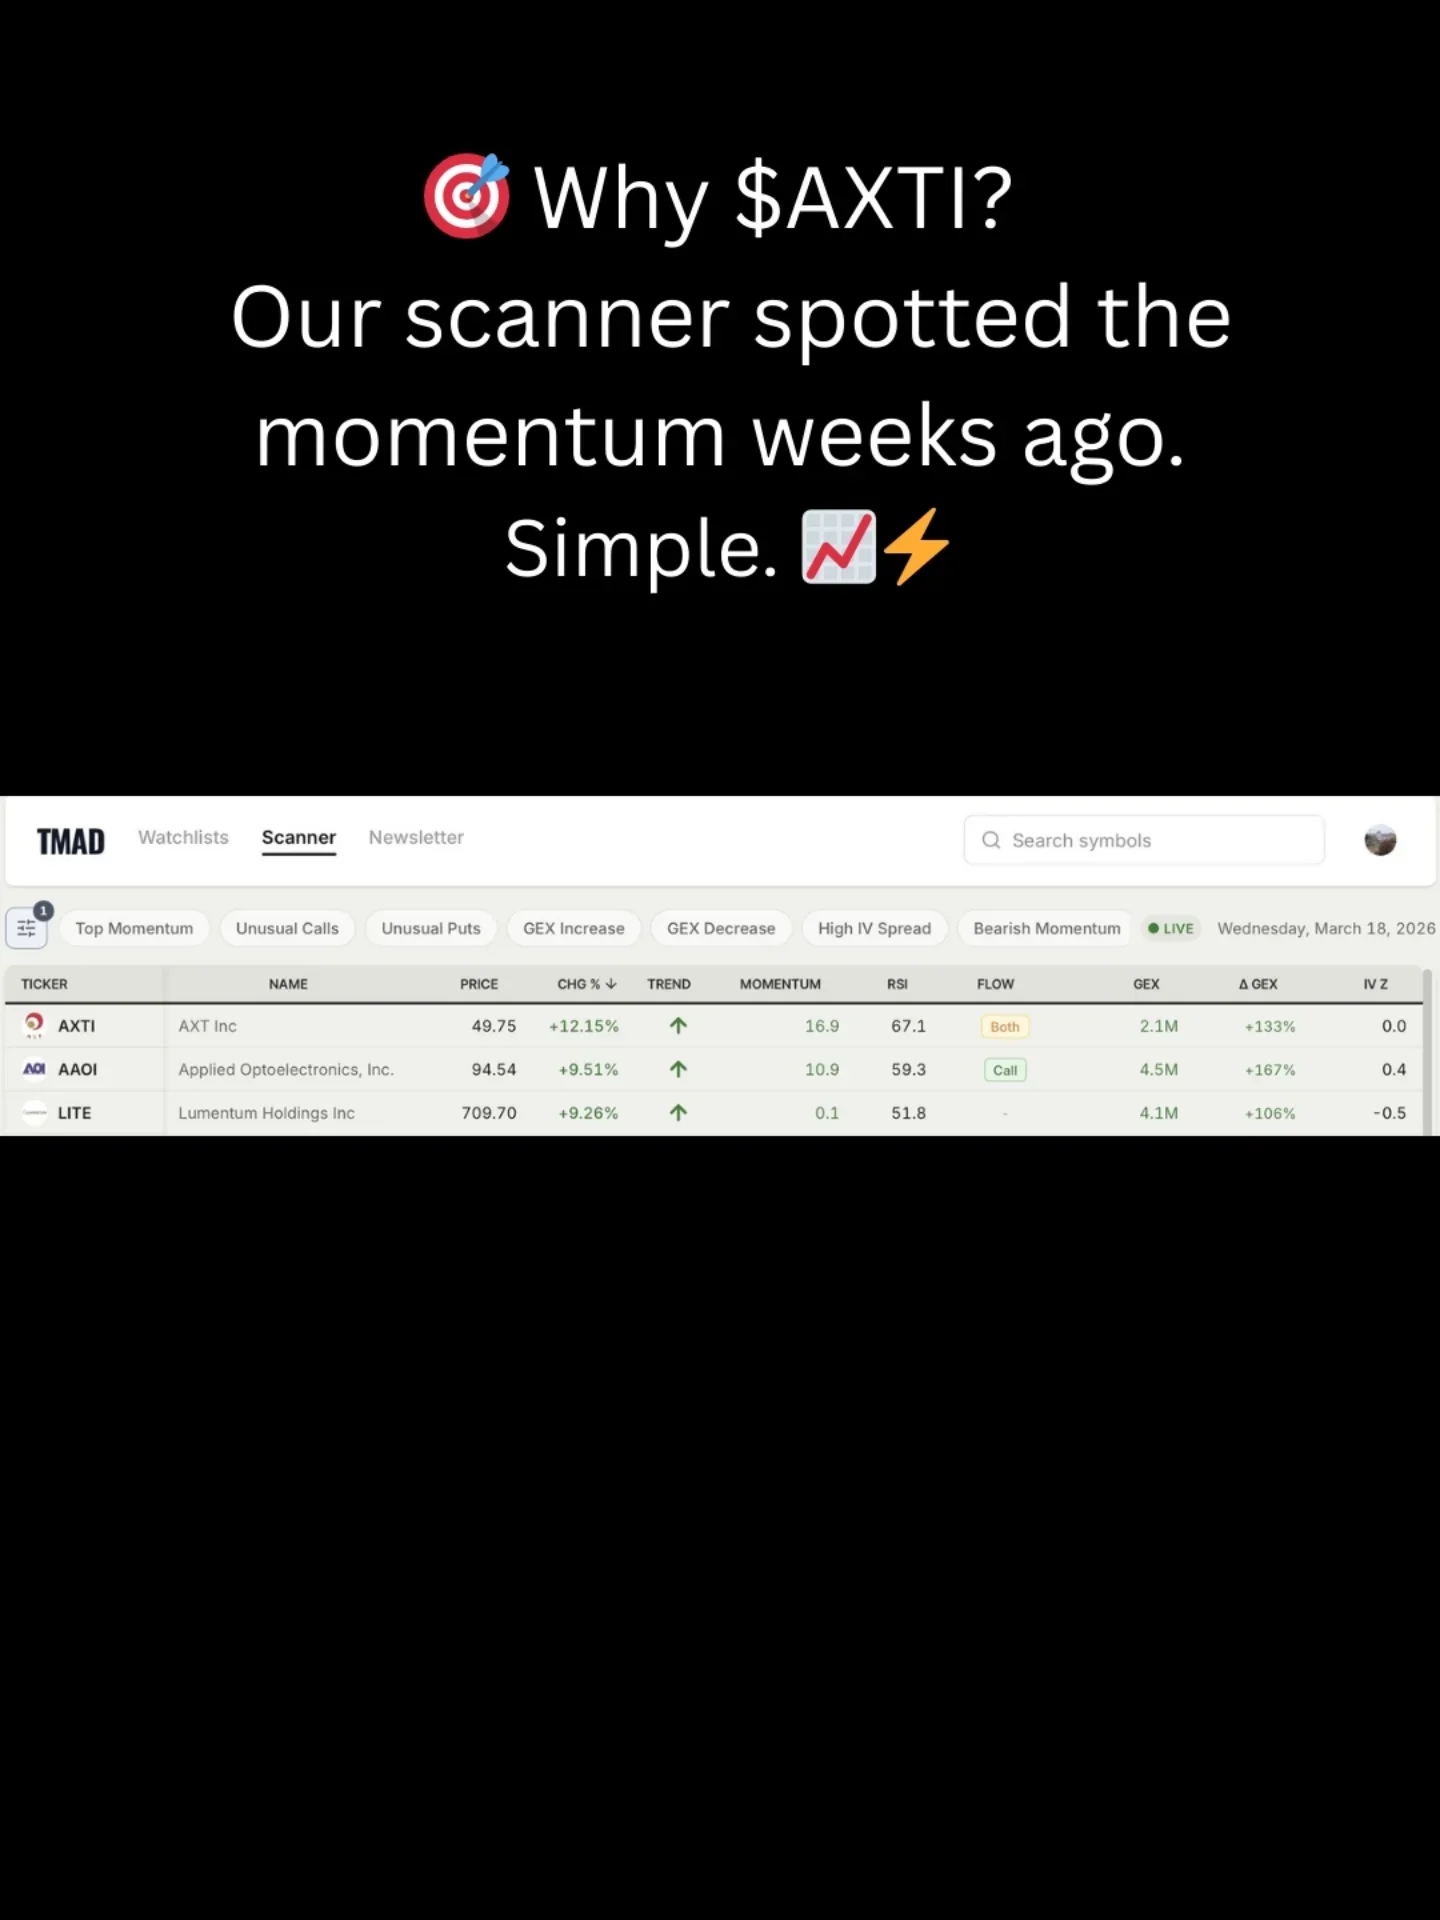
Scanner Caught AXTI Momentum Weeks Before Move
Why AXTI? Our scanner flagged momentum WEEKS before the move. 🔎📈 Volume spike + tightening range + multi-timeframe confirmation = setup we trust. We got in early, managed risk, and let the trend run. Want the scan rules? Drop a comment or...

Up 1000bps YTD vs SPX, Ready for Longs and Shorts
Welcome to those joined https://t.co/zHQ4Za0hoi today using the discount “hft”. We are in a good position up YTD 1000bps vs $SPX to maneuver with both longs and shorts

S&P 500 Hits Bottom 15 Days After Geopolitical Shock
Historically, the S&P 500 bottoms 15 trading days after a geopolitical event begins DB. @augurinfinity @soberlook https://t.co/j2yKbwkAig https://t.co/9G1EyxjbxR

USD/CHF Bulls Stalled at Critical Resistance Level
Swiss Franc Short-term Outlook: USD/CHF Bulls Rejected at Key Resistance https://t.co/rLrumlAN5T $USDCHF Daily & 240min Charts https://t.co/pcvuoorqWD

SPX Downtrend Likely Extends to August Low
$SPX - Time wise we're still in the timeframe for an 80 trading day low, but in my opinion the weekly close below the 200 day MA and breakdown of the November low has invalidated this cycle. The downtrend is...