
Trade Only Two Ways: Breakouts or Reversals
There are only 2 ways to trade. Breakouts (Momentum) - You’re betting on continuation. - Price approaches resistance, you buy, expecting it to push through and keep running. - The level becomes support once broken. Reversals (Mean reversion) - You’re betting on reversal - Price approaches resistance, you short, expecting it to bounce back down. - The level acts as a ceiling. ↓

Bears Dominate: NYSE Posts 17 Consecutive Low‑High Imbalance
New lows are taking over NYSE new lows > new highs for 17 straight sessions. The bears control participation. When does the new low list stop expanding? 👉 https://t.co/TDXk8SmB1d https://t.co/h2g2QbQ4x9

Expanding Switch Spread Turns Against Bullish Traders
The switch keeps expanding. That spread is moving the wrong way if you are bullish https://t.co/m2ctrSUvzX

Equal Weight Magnificent Seven Likely Topped, Below Support
The Equal Weight Magnificent Seven looks like it may have completed a top. Price just broke below support... How far does it fall from here? https://t.co/9JxB4KNbYv

Small and Micro Caps Test Breakout Support
Small caps and micro caps both broke out. Now they’re pulling back to test that breakout level. Do they hold? https://t.co/rH30Rz4cou

Can Staples and Low‑Volatility Outperform S&P 500?
Do Staples and Low Volatility vs the S&P 500 hold the breakout and keep moving higher here? https://t.co/xQS4BCRIq8

Ferragamo Upgraded as Margins Rise From SKU Cuts
Bernstein upgrades Ferragamo to outperform as SKU cuts, −10% inventories, store reshuffle and wholesale exits boost margins; China execution and partner exits pose risks. Trade: buy FERR. 📈 — Viktor Kopylov, PhD, CFA. More insights: t.me/si14Kopylov

SPX Futures Rebound, Patience Required for Today’s Trade
$spx futs +35 reversed off the overnight lows. Makes today’s set up different. It means more patience and we’ll see if early strength holds/fades or builds. We will map out some levels And trade the market in front of us....
Free 12‑Hour ICT/SMC Trading Guide: Liquidity, Structure, Gaps
The Ultimate ICT_ SMC Trading Guide📊 12 Hour Free Course📊 Liquidity📊 Market structure📊 Fair Value Gaps📊

Buy the Dip Dispassionately, Unlike Cramer’s Approach
Respectfully, we are "playing" the precipitous drop much differently than @jimcramer. We are buying and dispassionately. We view dips as opportunities given, among other things, the valuation and consensus (EPS) resets. @dougkass
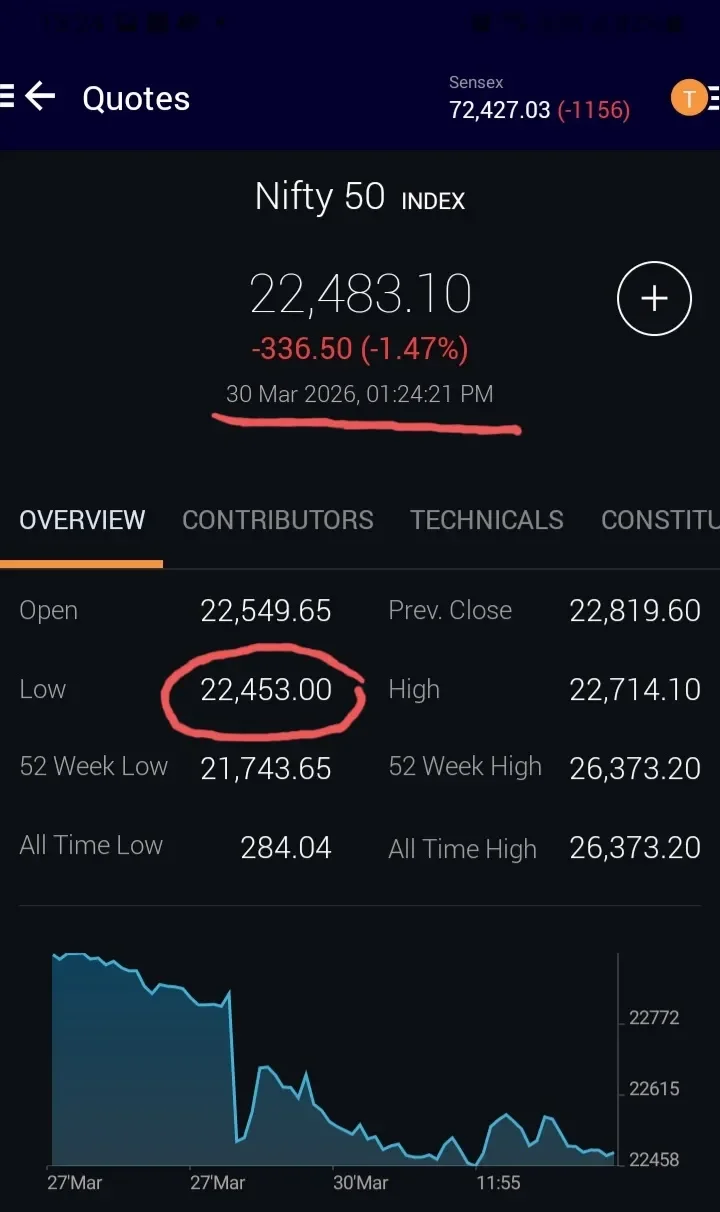
22,359.9 Emerges as Key Nifty 50 Support Level
Looks like 22,359.9 is acting as a nearby support zone for Nifty 50. Today’s low came in at 22,453 and buyers stepped in around that area. Feels like this zone will be important if the market dips again. #Nifty50

US‑China Tech Tensions Spark Risk‑off, but Long Bias Holds
🌍 US-China tech tensions escalate, risk-off mood grips ─────── 📈 Price > VWAP — Bias: Long · Buy rips through 23,299 · Buy dips at 23,251 ─────── 🌏 Asia ORB Set | MNQ High: 23,299 ⬆️ | Low: 23,251 ⬆️ | Range: 48 pts ─────── 🎬 Live...
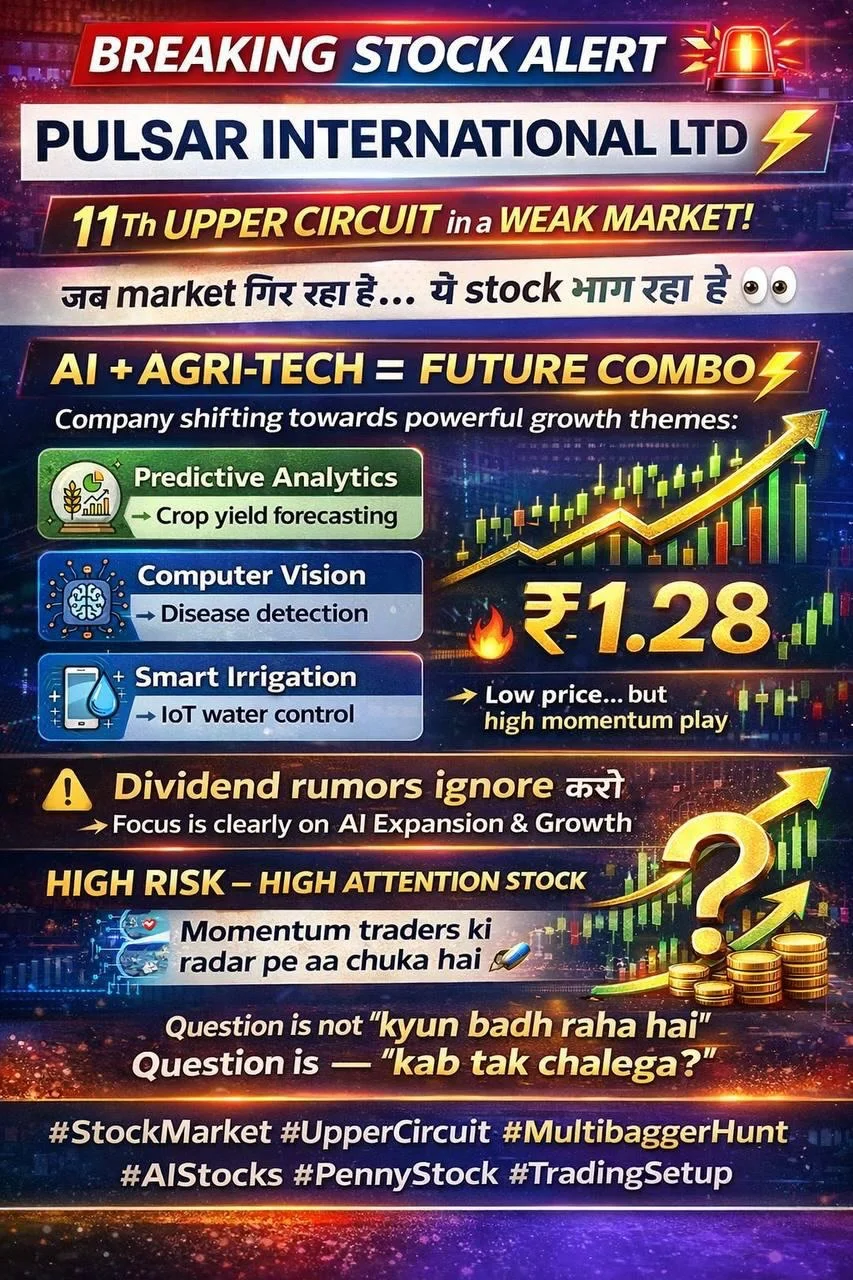
Crashes Reveal Opportunities: Spot Reversal Stocks Now
PULSAR INTERNATIONAL | BSE: PULSAR 📊 GOOD MORNING | BUY THE DIP OR WAIT? 🌅 Market is bleeding. But every crash in history hid the next big opportunity. Smart money doesn't panic — it watches reversal stocks with volume spikes and upper...
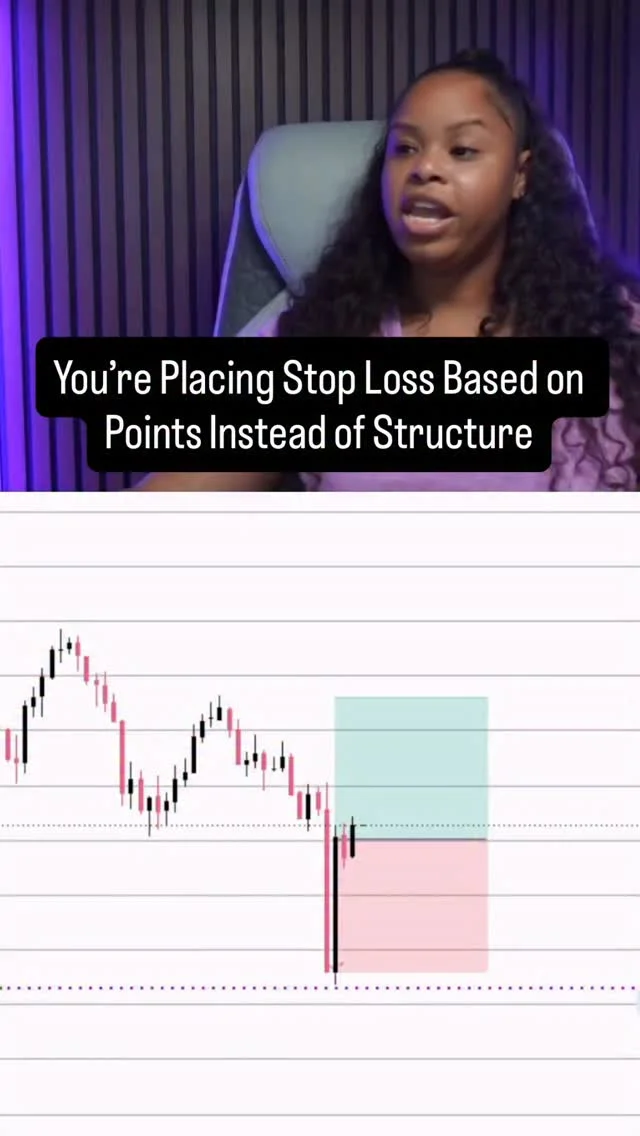
Place Stops at Swing Highs/Lows, Not Fixed Ticks
Most traders place their stop loss based on ticks or points. That’s why they keep getting stopped out. A stop loss should be based on market structure, not a fixed number. Below a swing low. Above a swing high. That’s where the trade idea is...

Market Bears in Control: S&P Down, VIX Spikes
•The S&P has dropped for 5 straight weeks. •VIX above 30. •Breadth collapsing. •This isn’t a dip. The rules have changed. More here: https://t.co/uh4QHy6u6s https://t.co/AWURzXrR6l

Thursday's S&P
This is no early April Fools' joke, but Thursday is down an annualized 147.6% this year for the S&P 500. Monday is up 108.2% at least, but that isn't making up for Tuesday, Thursday, and Friday. https://t.co/mtIAIGB4Q8
Asian Markets Lag US, Ideal for Equity Short
Been banging the drum about how much worse this is in Asian economies than US…. Much better place to express an equity short right now

S&P 500 Faces Five-Week Slide, Near Record Streak
The 🍌 peel period of February and March is living up to the name, as the S&P 500 is down five weeks in a row. The longest weekly losing streak ever? Eight in 1970 and 2001. https://t.co/77A6x56e3D
Missing Full Entry, Then Price Rockets—Bittersweet
When you don't take a full entry in something so you can "add in the dip" and then it goes straight up from your entry. Bitter sweet.

Anticipating QQQ Break Below 560 for Bigger Exposure
i've been waiting for the 560 flush for awhile... the bigger the drop below 560 tmrw the more exposure i want to have. $QQQ https://t.co/rfJPBXHkqc

Buying Oversold Indices Tonight: SPY and QQQ Surge
Buying the oversold. Trading long rentals in Indices tonite: Dougie Kass (timestamped) 20m ago Sunday night trading. Added to Indices ("buying at the sound of cannons"): * $SPY $629.64 * $QQQ $557.57 805PM @tomkeene @business @cnbc @guyadami

Long Bias: Buy Rips 23,400, Dip At
🇺🇸 NY ORB Set | MNQ High: 23,400 | Low: 23,350 | Range: 50 📈 Price > VWAP — Bias: Long · Buy rips through 23,400 · Buy dips at 23,350 🎬 Live trade 9am: https://t.co/66dSROeuCi

Weekly Market Cycle: Optimism Monday, Panic Wednesday, Crash Friday
Interestingly, last week multiple senior fund managers pointed out to me that this pattern has held for each of the last 3 weeks: “TACO/positive news” Monday, “uh-oh” by Wednesday, “dumpster fire” by Friday

Oil Prices Surge to Target, Maintaining Brent Long Position
Oil going straight up to levels we were looking for - staying Long in Brent $BNO terms https://t.co/MJlPz9oFW6
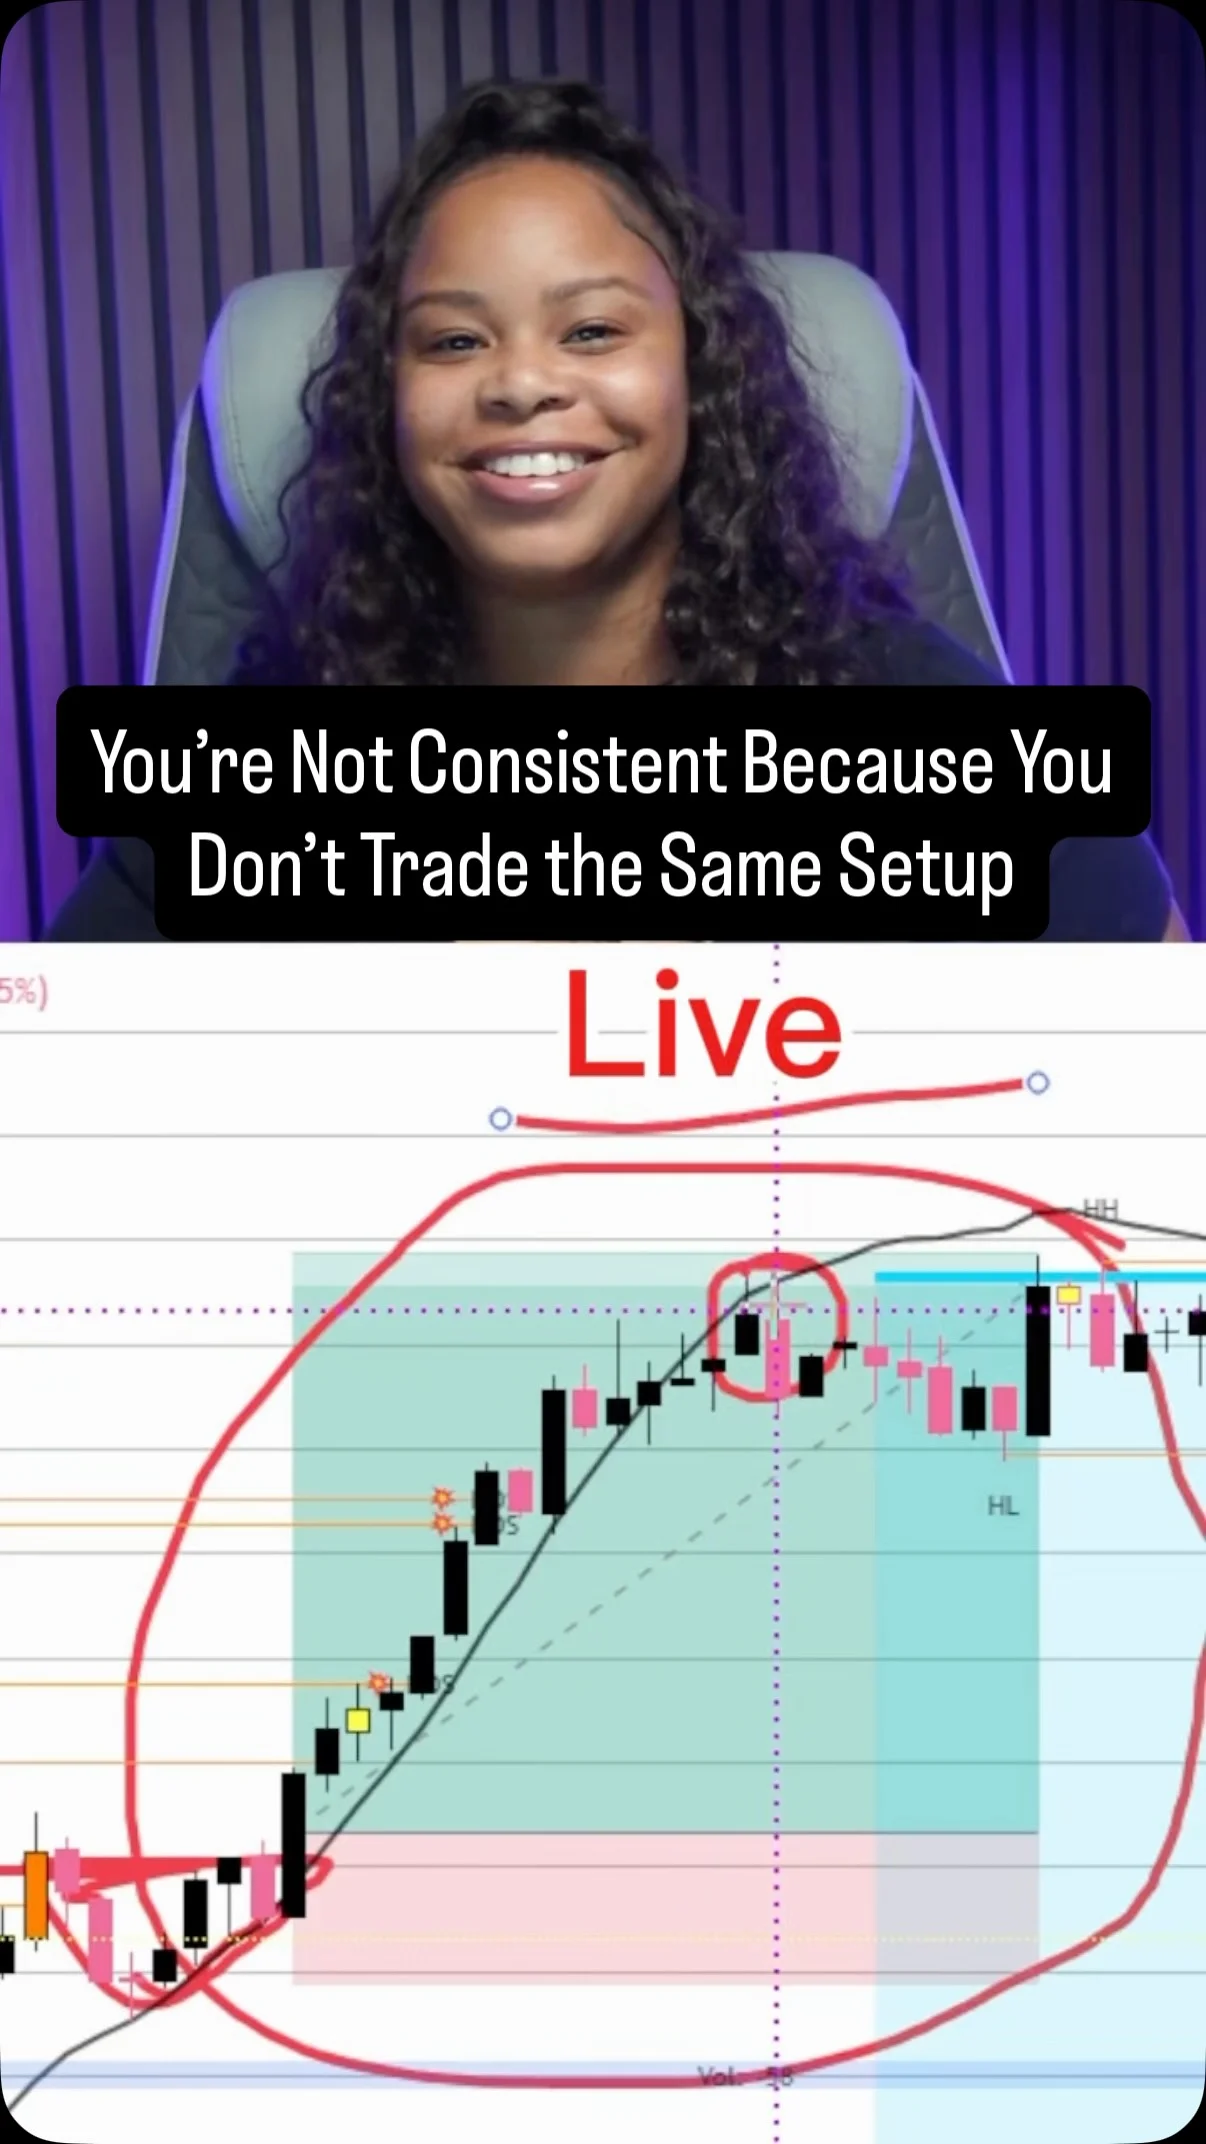
Stick to One Setup for Consistent Trading Success
Most traders struggle with consistency because they keep changing their approach. A real edge comes from trading the same setup under the same conditions. For me, that’s the opening range, combined with key supply and demand levels. When price reaches those areas at...

Middle East Tensions Push Gold to 4537.70 ORB
🌏 Asia ORB Set | GC High: 4537.70 | Low: 4511.80 🎬 Live trade 9am: https://t.co/UFRUqEw6Kf ─────── 🌍 Middle East tensions spike, driving safe-haven bids. ─────── 📊 Gold futures grinding higher, testing 4535.00 resistance. ─────── 🎯 Watch 4537.70 ORB high—break ignites bullish surge.
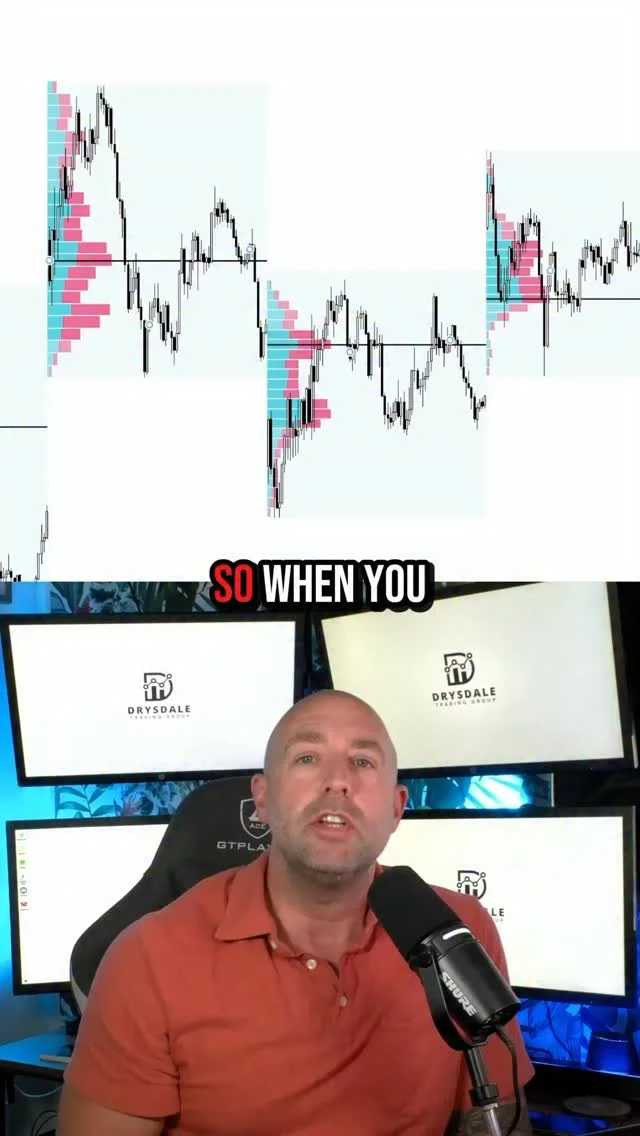
Raise Tick‑Per‑Row for a Cleaner Volume Profile
Most traders use Volume Profile… but never set it up right 🤦♂️📊 If your profile looks chunky and sloppy, fix this one setting: Tick per row → raise it. Cleaner profile. Better detail. Smarter reads. ✅ Small tweak. Big difference. #VolumeProfile #FuturesTrading #TradingTips
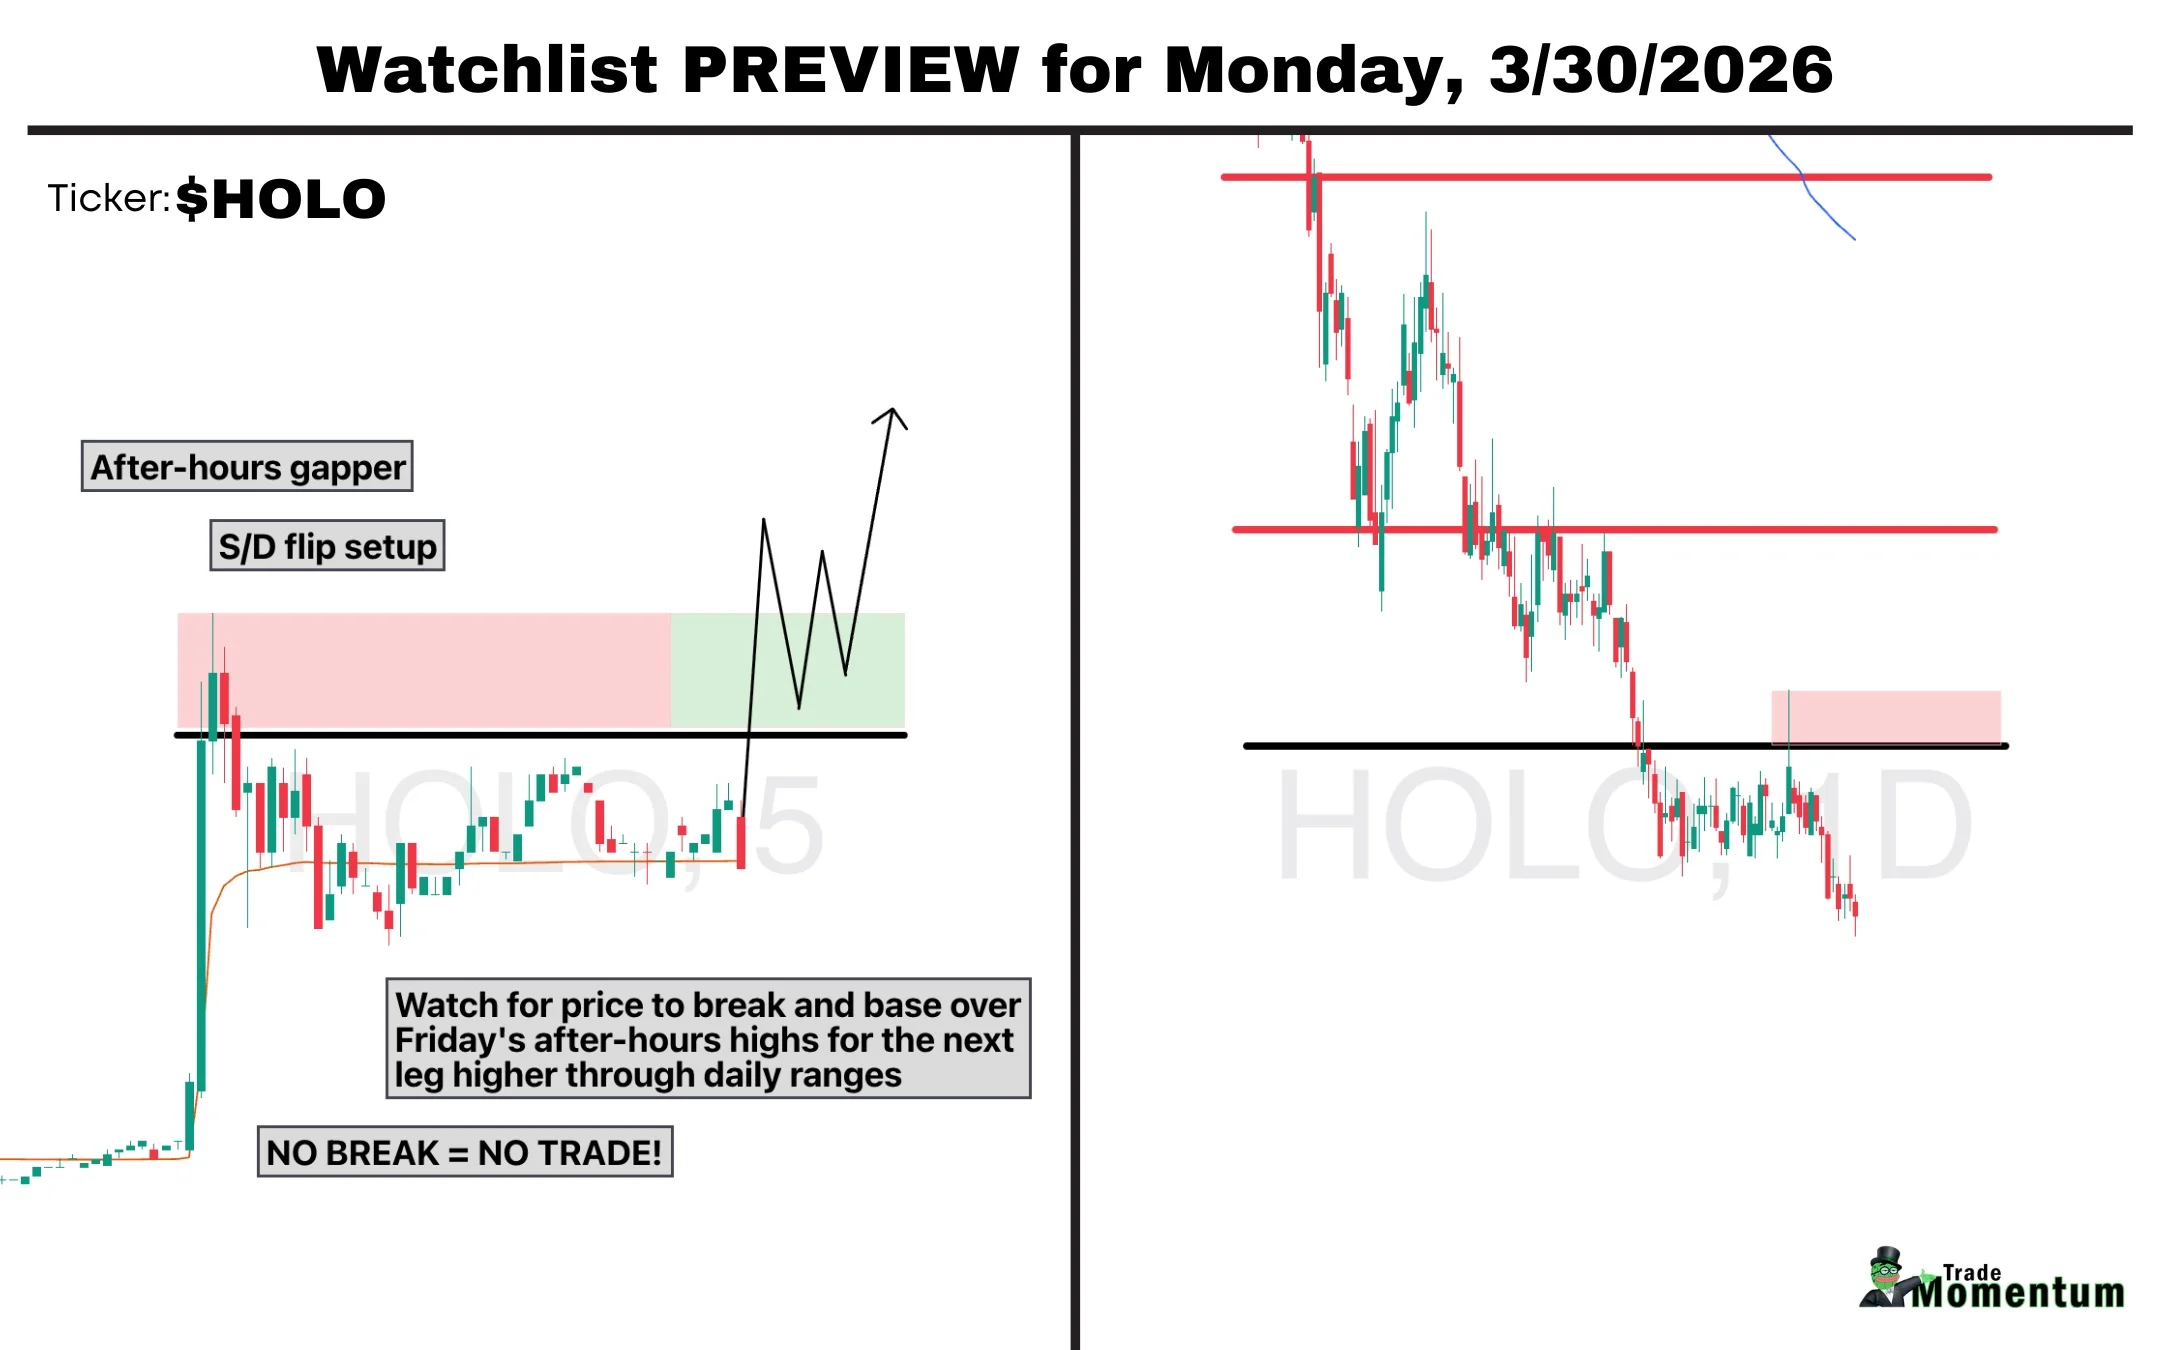
HOLO FY25 Revenue Jumps 39%, Eyes Breakout
$HOLO - "MicroCloud Hologram Reports FY25 Revenue $56.5M, Up 39.1% YoY" Classic after-hours continuation setup here (S/D flip), so NO BREAK NO TRADE is more important than ever... if this does breakout, we've got range to $3/4+

NVDA Slump Could Erase $4 Trillion Market‑cap Club
If $NVDA has a bad week, the $4 trillion market cap club could be a party of 0 https://t.co/L42ydj32gK
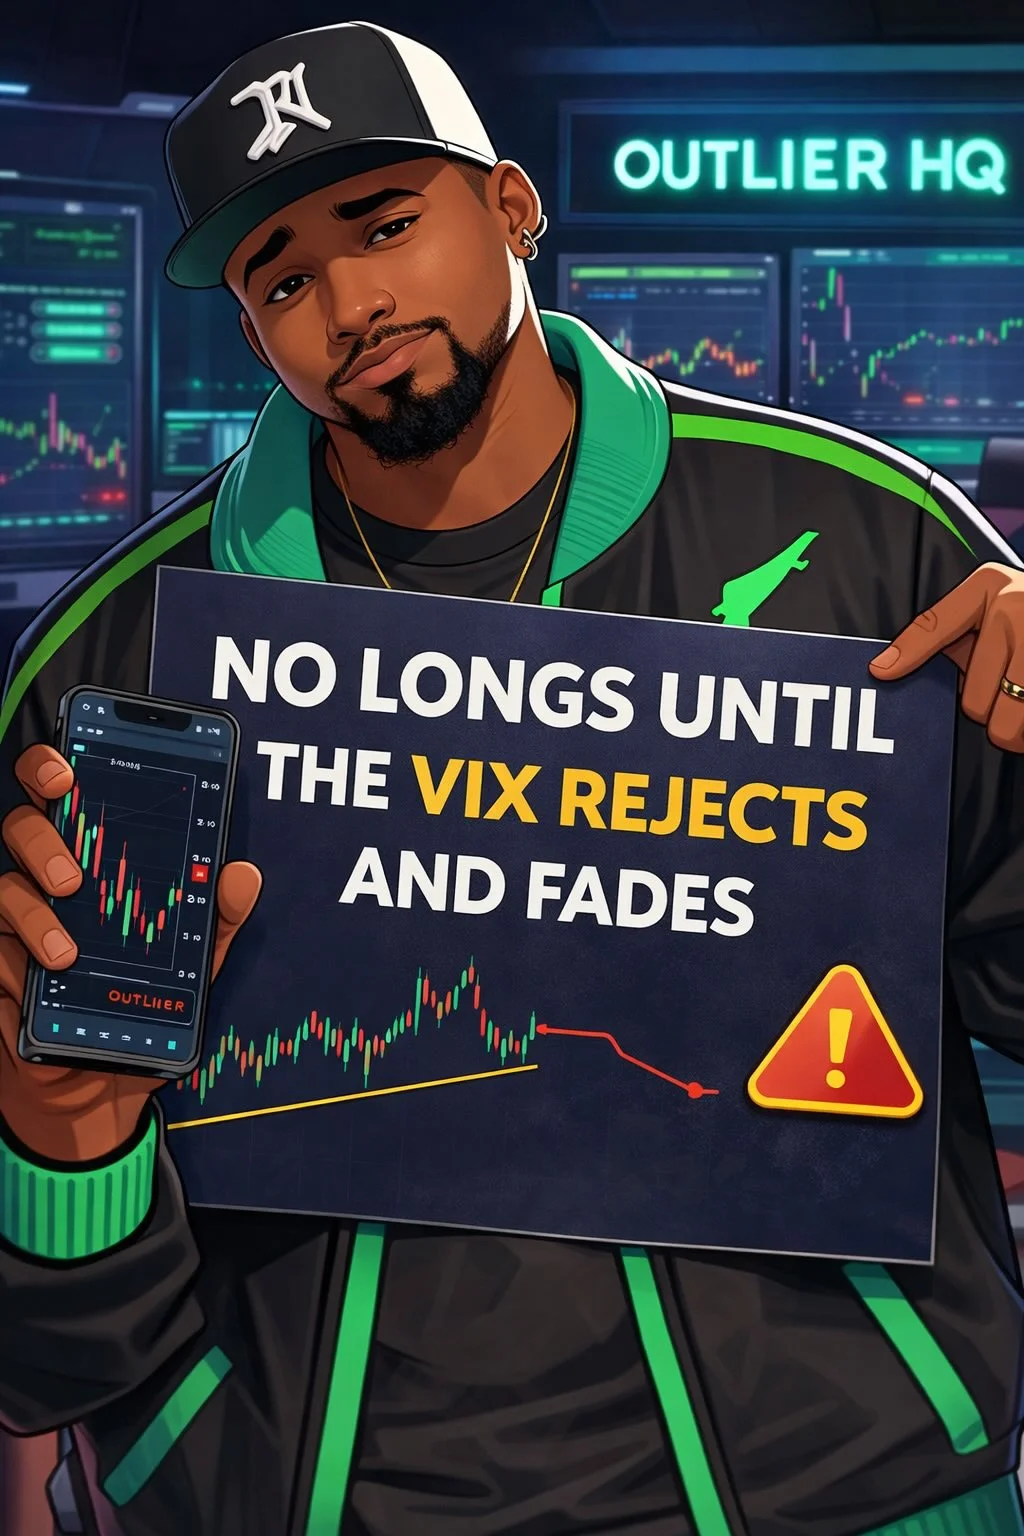
Wait for VIX Rejection Before
Pinning this so people stop confusing my patience with being bullish No longs until the VIX rejects & fades When it does…give it 48 hours

Bet on Patterns You See, Not Overanalyze
i learned to just start betting on the patterns i spot instead of trying to figure that out

Catalyst Watch: Brace for a Volatile Stock Week
GET READY FOR ANOTHER CRAZY WEEK IN THE STOCK MARKET Here's a full catalyst watch to help you get prepared More below ⬇️🧵

S&P Faces Historic Wave of 1%+ Daily Drops
The S&P 500 fell 1.7% on Friday, its 10th daily decline so far this year with a loss above 1%. Expect to see many more of these days in the coming weeks & months - the average year since...

S&P 500 Slides Below Key Supports, Still Not Oversold
#SP500 Down Candle. Support 6360, 6212, 6201, 6059. Resistance 6453, 6573. RSI 31 low but not Oversold. Down Candle on Weekly. Top Bollinger Band 6770. Midpoint Line 6570. Bottom Band 6374.

Dragonfly Capital's Top 5 Monday Stock Picks
Dragonfly Capital - 5 Trade Ideas for Monday: Amex, BP, CF, Sinclair and Goldman $AXP $BP $CF $DINO $GS https://t.co/Bcqkv1numr https://t.co/qWtU6zeK7Z
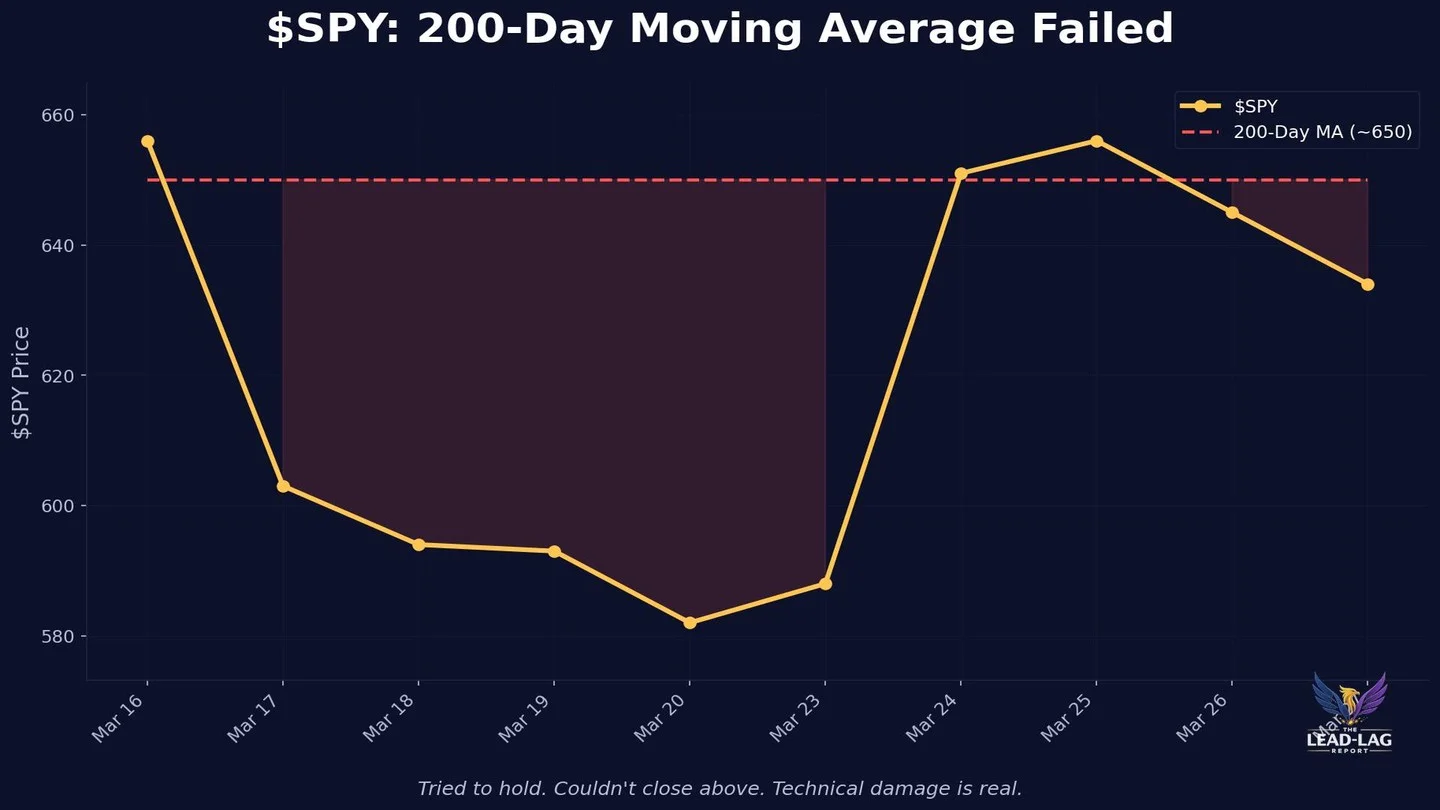
200-Day MA Collapse Turns Support Into Resistance
The 200-day moving average failed. Market tested it. Retested it. Couldn't close above it. Every fund manager who bought the dip at that level is now underwater. Stop-losses triggered. Margin calls widened. The buyers became sellers. When a level breaks repeatedly, it stops...

Premium Users Get This Week's Top Trade Ideas
Premium Users - Top Trade Ideas for the Week of March 30, 2026: The Best, on the blog and here https://t.co/ZHdwBmlB7n

Gold Jumps 10% Post‑Crash: Bottom or Bull Trap?
Gold Price Forecast: Gold Price Forecast: XAU/USD Surges 10% After Crash—Bottom In or Bull Trap? https://t.co/CwnEhFzNtn $XAUUSD Weekly Chart https://t.co/NoYtoXTuYs
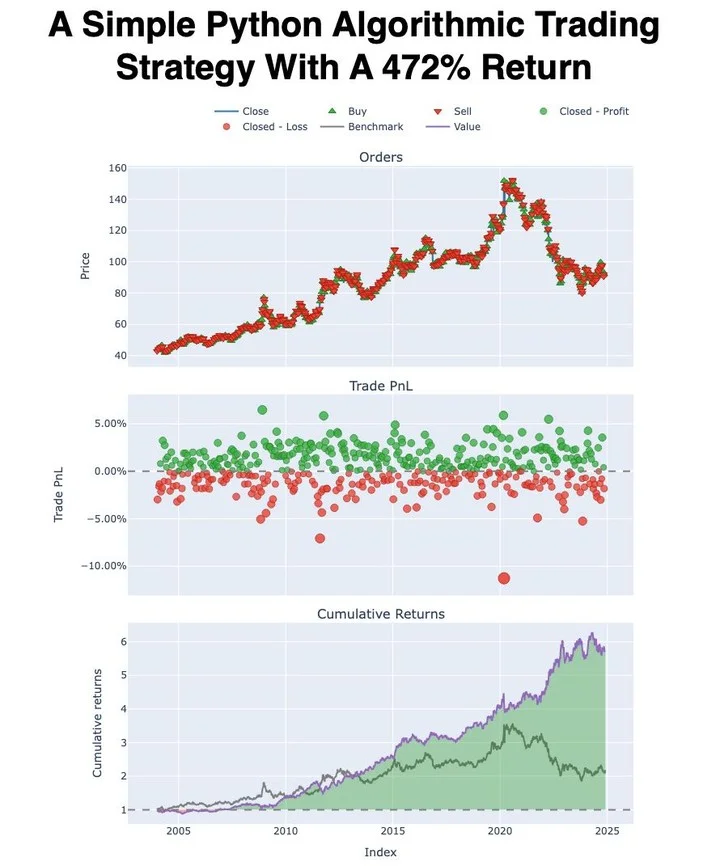
Build a Python Algo Yielding 472% Returns
How to make a simple algorithmic trading strategy with a 472% return using Python. A thread. 🧵
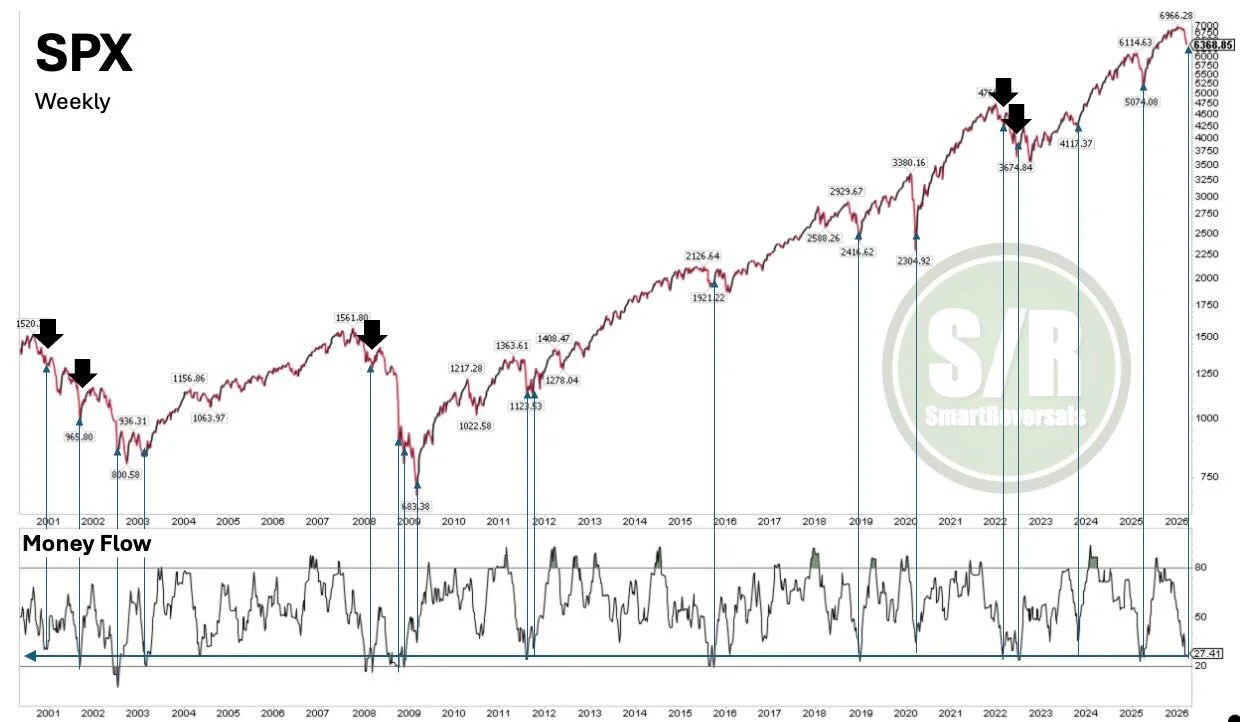
Low Money Flow Index Signals Imminent SPX Bounce
#SPX: The Money Flow Index is at significant lows, suggesting a tactical bounce is nearby as analyzed since 2000. Black arrows highlight relief bounces even in bear markets. While major bottoms have also followed (2023), the price must recover key...

Major Tech Giants Lose Over
Big Tech continuing its decline... Amazon -21% Tesla -26% Meta - 23% Palantir -31% Netflix -30% Microsoft -34% Oracle -57% Bitcoin -47%

NVDA Faces Yearly Pivot at $161, Potential Drop to $147
$NVDA - As I posted last week it's headed to the yearly pivot at $161. If it closes below 161 at the end of next week the next downside target would be the 100 week MA that is currently at...

XLI Industrials Near Support After 11% Drop
$XLI Industrials - worst S&P 500 sector ETF m/m... but coming into a support zone $153-$157? -11% from its February record high @stockcharts https://t.co/LSIQtTlpMK

Toyota Shifts to Solid‑State EVs Amid Execution Risks
EV acceleration forces Toyota to pivot to solid‑state batteries, modular platforms and scaled production; execution risk and Chinese cost pressure persist. Trade: buy TYO on pullbacks. Outlook: margins should narrow. ⚡ — Viktor Kopylov, PhD, CFA More insights: t.me/si14Kopylov
Multiple Plans Enable Flexible Trading in Volatile Markets
I like this playbook. Just have multiple plans in moment as levels will be zones and u must know what u can handle. I’d love $spx $spy 2%-4% lower into Tuesday to play the bounce. Oscillator went out...
VWAP Simplified: One Price, One Rule, One Trigger
VWAP isn’t complicated 😤 You made it that way. Start here👇 1 price 📈 1 rule 🧠 1 trigger 🎯 30 days. That’s it ⏳ Drop BEGINNER 📩 #vwap #tradingstrategy #daytrader

Small‑Cap Energy Poised for Massive Breakout—Will It Hold?
Meanwhile, Small-cap Energy is working on a massive breakout. Do you think they can stick it? https://t.co/jRGbNvDP1j

Trade 1‑Minute Charts to Accelerate Learning and Psychology
Trade the 1 minute chart. You will learn faster. More trades, more chart exposure and more oppurtunities to practice psychology. I this triggers people so here's a full explanation ↓ https://t.co/uzYZuBNSl5
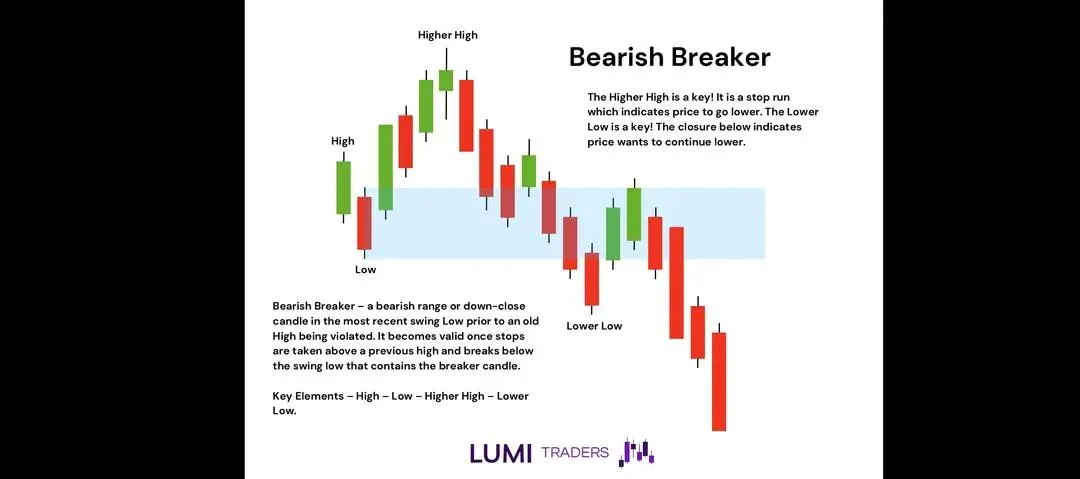
Mastering Breakers, Order Blocks, and Mitigation Patterns
Bearish Breaker 📊 Bullish Breaker📊 Bullish Order Block📊 Bullish Order Block📊 Bearish Order Block📊 Bearish Order Block📊 Reclaimed Order Block📊 Bullish Mitigation Block📊 Bearish Mitigation Block📊 Rejection Block📊 Propulsion Block📊

Safely Spot a Short Squeeze Without Losing Capital
How to ACTUALLY catch a short squeeze - without blowing up your trading account. #daytrading #stockmarket #momentum #tradingeducation #stockstowatch