
Let Price Find Its Level, Adjust Stops Accordingly
$MU let it rides moved all of the stop orders. Good example of letting price seek its own level and me take care of the stops.

Skeptical on AMD, Short with Tight Stop, High Reward
I am skeptical of this move in $AMD. I think it gives back a lot of last week's gains. Back to $270. I got short a bit, $5 stop, $65 profit if I'm right. Not bad risk:reward.
NVDA Surge Raises Questions for SOXX, SMH
$NVDA +8% last two days... record high. But is that bearish for $SOXX $SMH? My thoughts... https://t.co/dRPc37eWjs https://t.co/Kt4G5qdi98
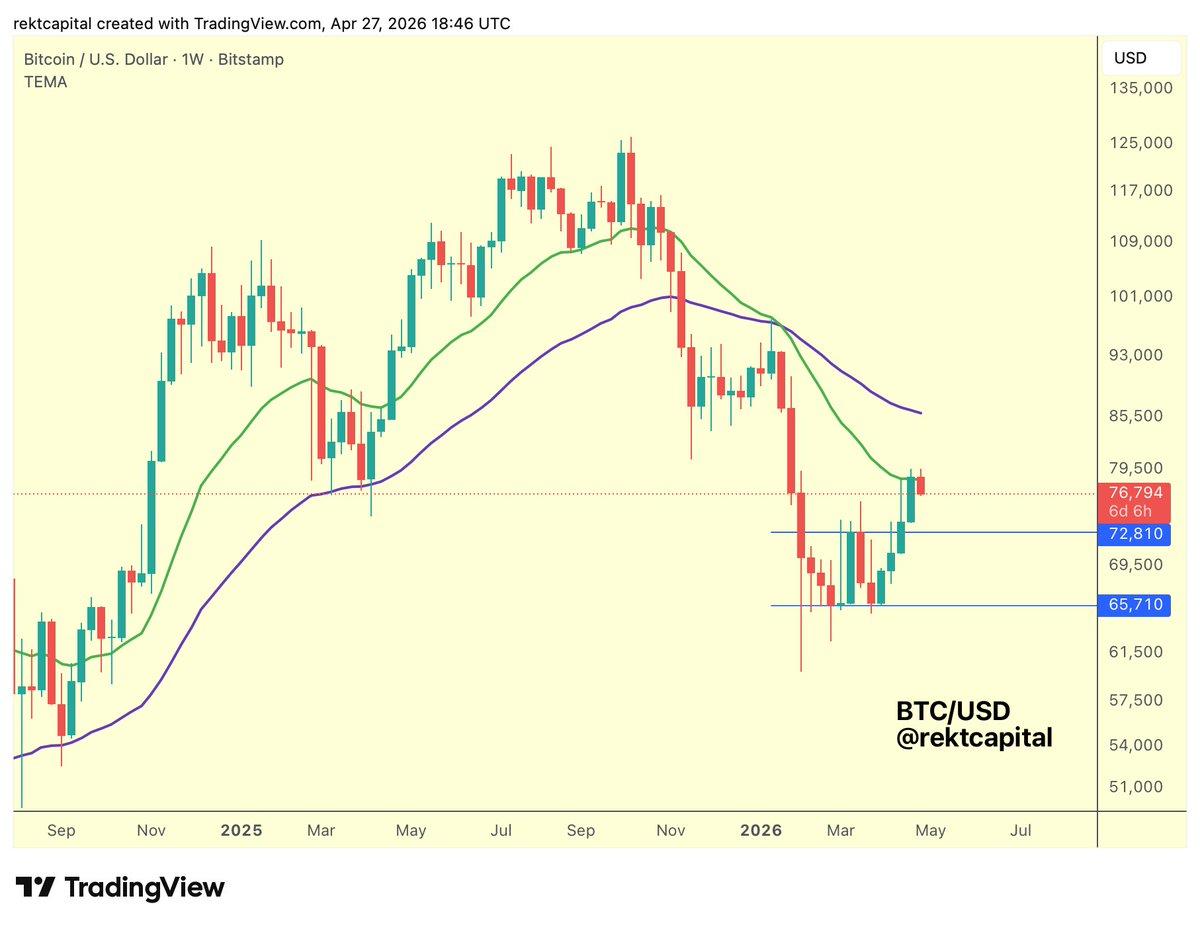
BTC Teeters Above 21‑week EMA, Retest Risk Looming
#BTC Bitcoin has Weekly Closed just above the 21-week EMA (green) Which means price is technically positioned for a retest of the EMA The problem is that there is very little space for the retest to breathe, making it very easy for...

Ride Market Sentiment: Switch Greed and Fear Strategically
Be greedy when others are greedy. but also be fearful. when they get a bit fearful get more greedy. but only till they get greedy again. then get fearful. but right before getting fearful get extra greedy for about 6-12...
Chip Stocks Pause After Historic Surge, Future Uncertain
Chip Stocks Take A Breather After Historic Run. What's Next For Semiconductor Group? https://t.co/cNHeCAUhdp $SOXX $QCOM $NVDA $INTC $SNDK
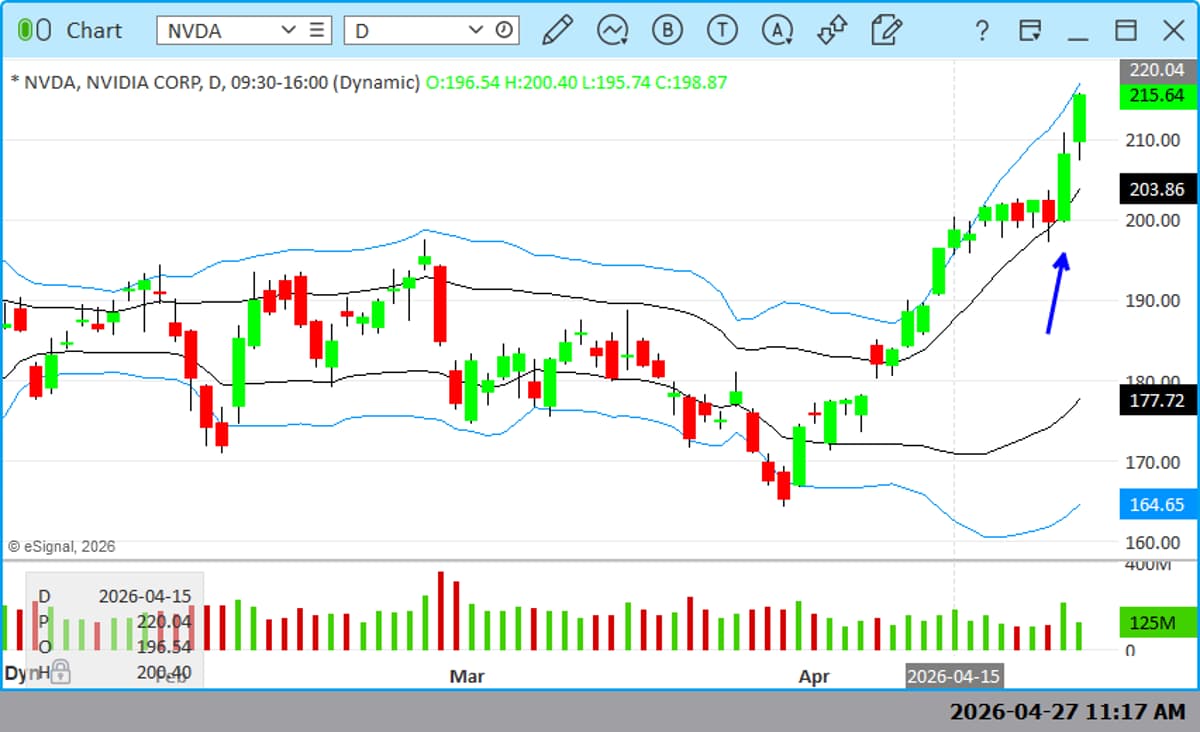
NVDA Forms Base on Bollinger Bands, Poised for Breakout
$NVDA follow through on this Indy on the Bollinger Bands-- base, base, base until lower part of sweet spot catches up, and then breakout. Gorgeous. https://t.co/0Yq9P2lv9B
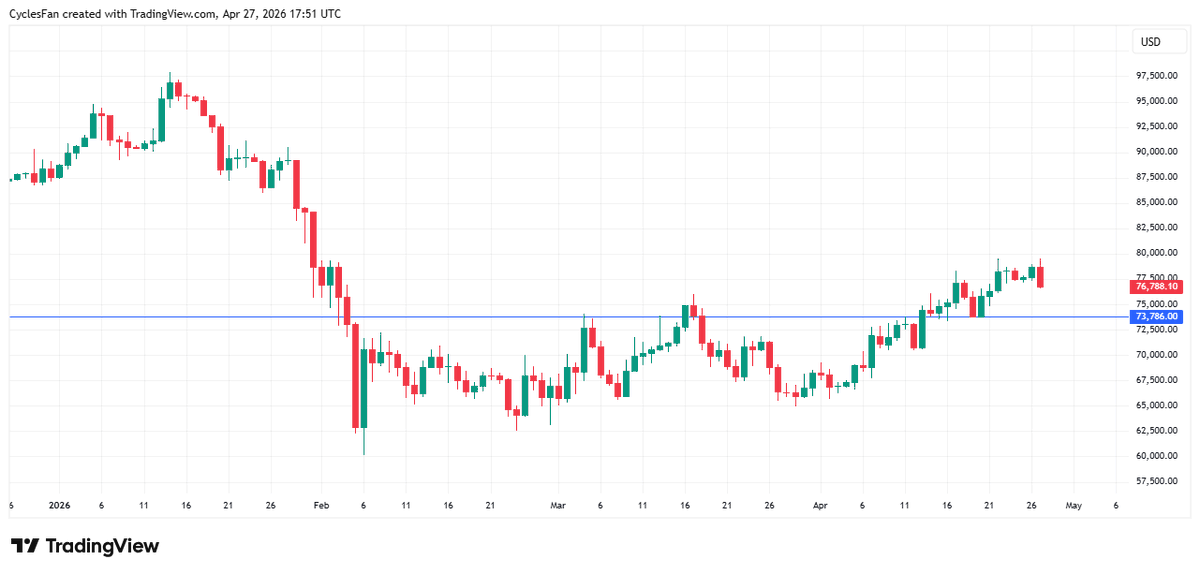
BTC Break Below 73,786 Signals New Bear Downtrend
$BTC - Since the March 29 low it has made higher highs and higher lows. If it falls below the recent short term low at 73786 we would have the 1st indication that the next down leg of the...
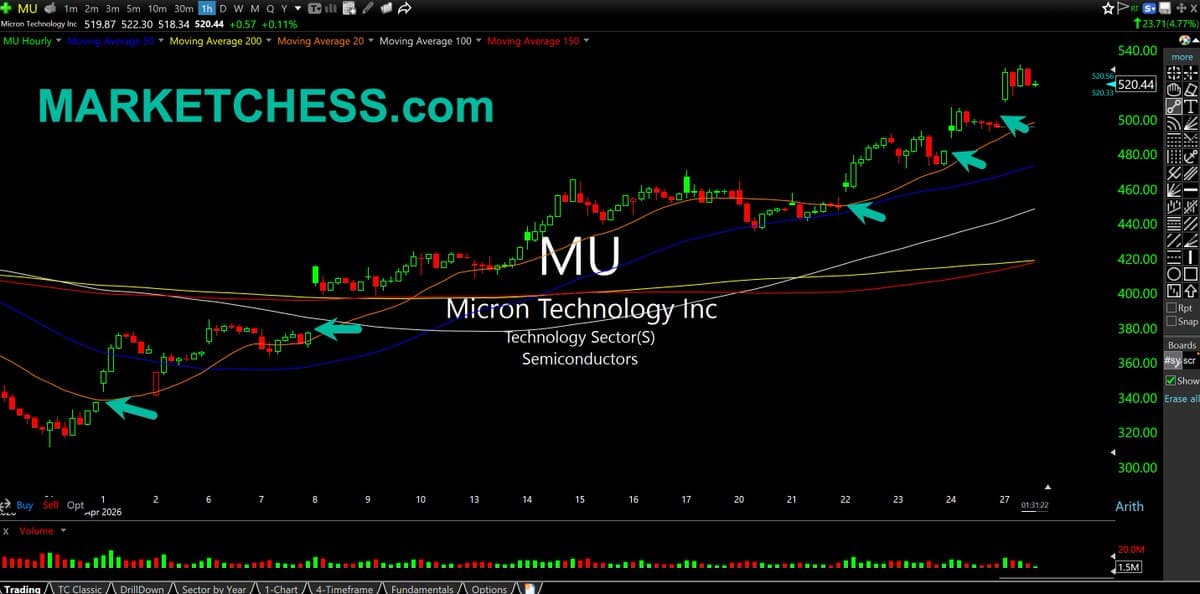
Micron, Sandisk Defy Sector Dip, Show Strong Melt‑Up
$MU Hourly. Micron and Sandisk leading semis again despite the sector lower today. $SNDK has earnings Thursday. You can see Micron's numerous open gaps higher during the latest melt-up https://t.co/V99DtPqRZ4
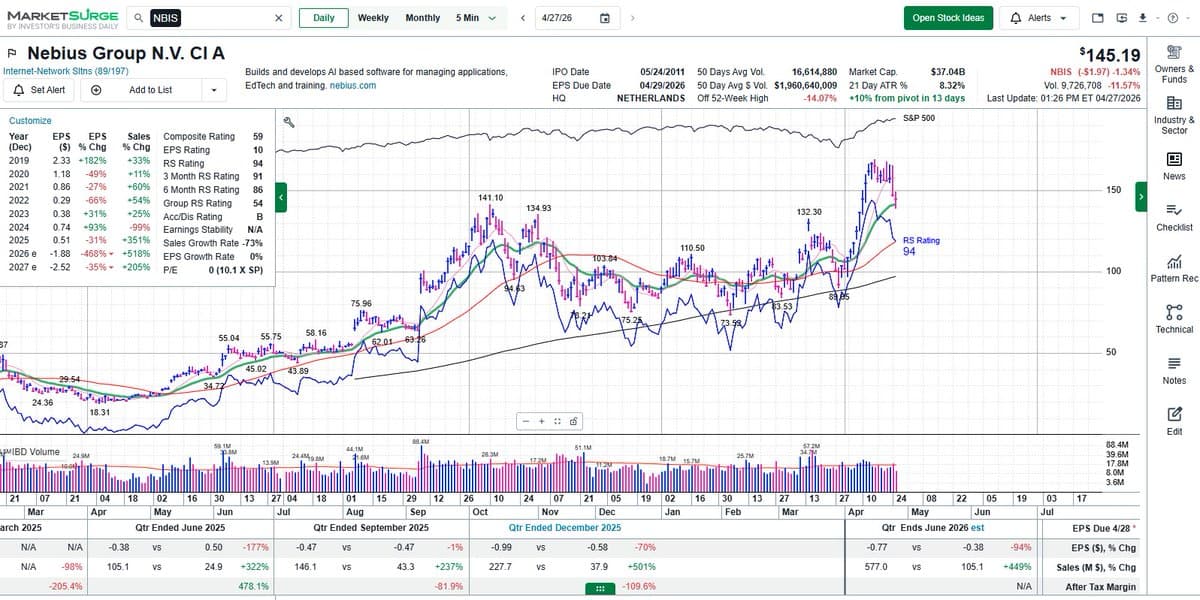
NBIS Eyes Support at 21‑Day EMA Amid Bullish Options
$NBIS trying to find support near its 21-day EMA (green line on chart). Recent bullish options flow in this one. @marketsurge @IBDinvestors #IBDPartner https://t.co/rUV2PA73qx
Ignore 52‑Week Highs: Best Buys Often Appear Strong
"The hardest stocks to buy are often the ones the market is telling you are working." My latest memo: Don’t Fear the 52-Week High https://t.co/maO0NjM84P https://t.co/uSecDvzaVW
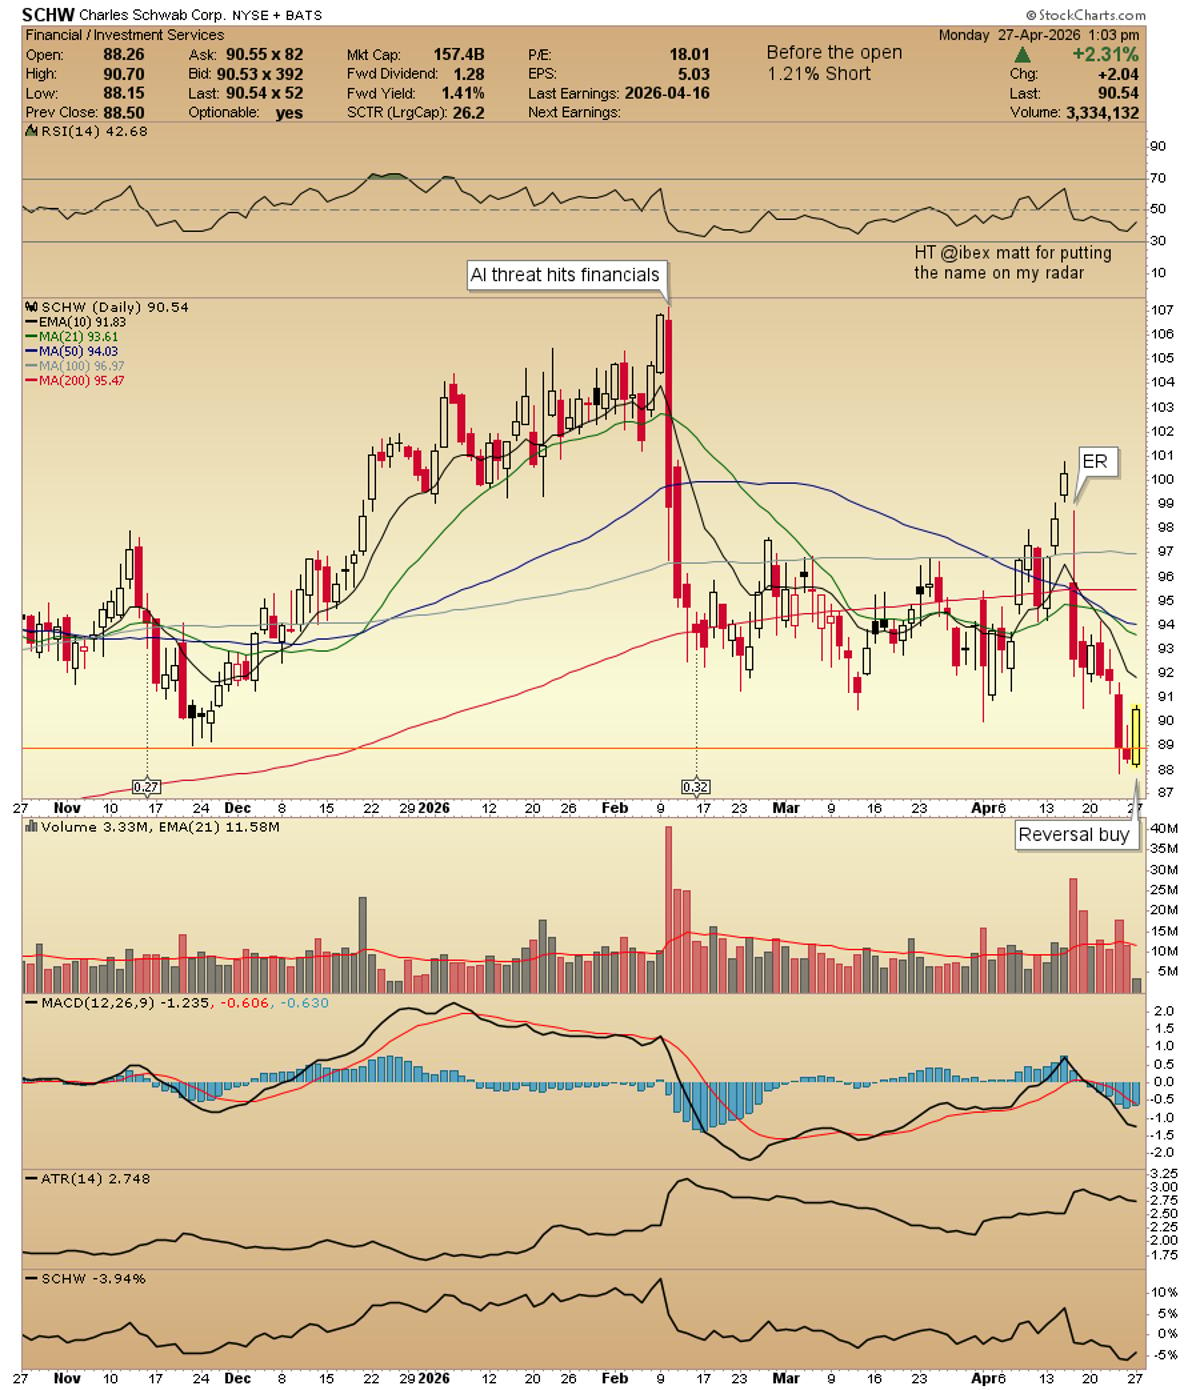
SCHW Reverses From
$SCHW new here today. HT @ibex_matt for sharing the idea. Reversing today off lows clear risk for my style of trading. https://t.co/oY8RkWv6up

Weekly Technical Outlook: Central Banks, USD, Gold, Bitcoin,
Central Banks, USD Majors, Gold, Bitcoin, Equities Weekly Technical Outlook (Webinar Archive) https://t.co/Tob4yVQy9i Asset chaptered on YouTube: https://t.co/Jg3EvZ7raT
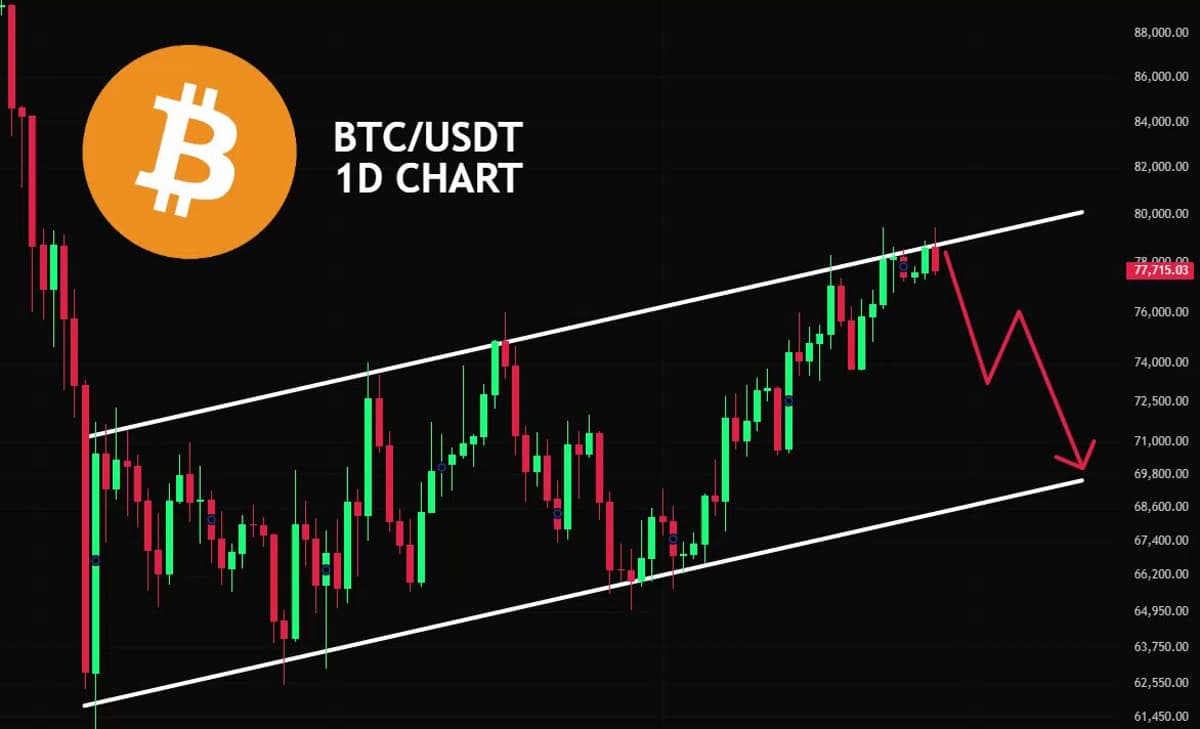
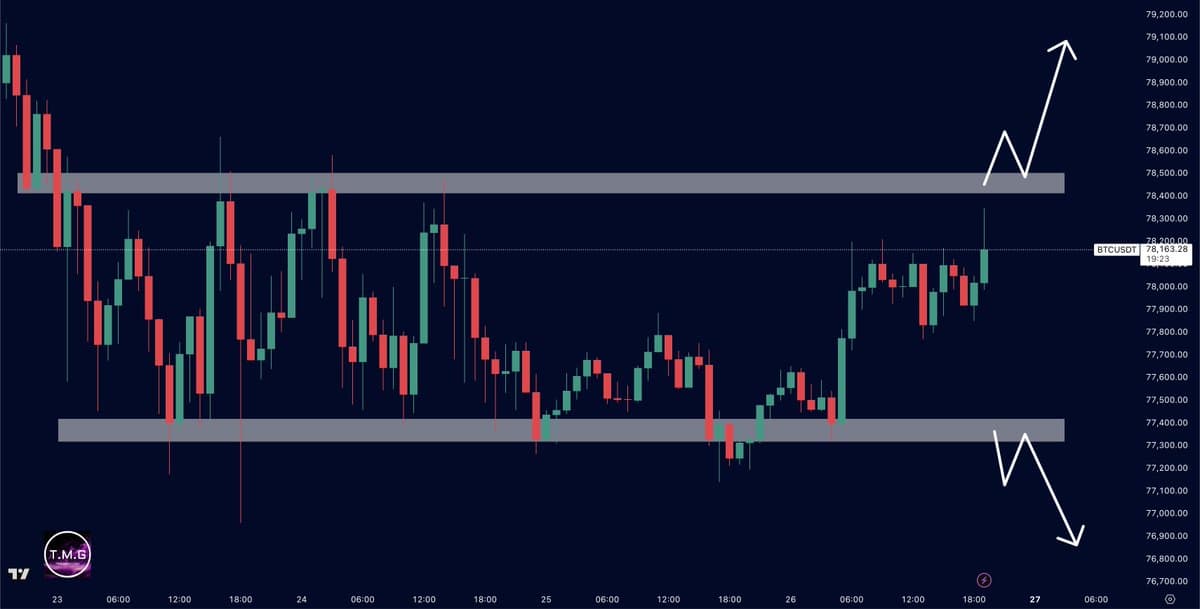
BTC at Decision Point: Breakout or Drop?
🚨 BTC AT A DECISION POINT 🚨 If $BTC fails to break above the upper trendline of the ascending channel, a move toward the lower boundary could follow If it breaks out and holds above, the bullish trend continues Stay alert...
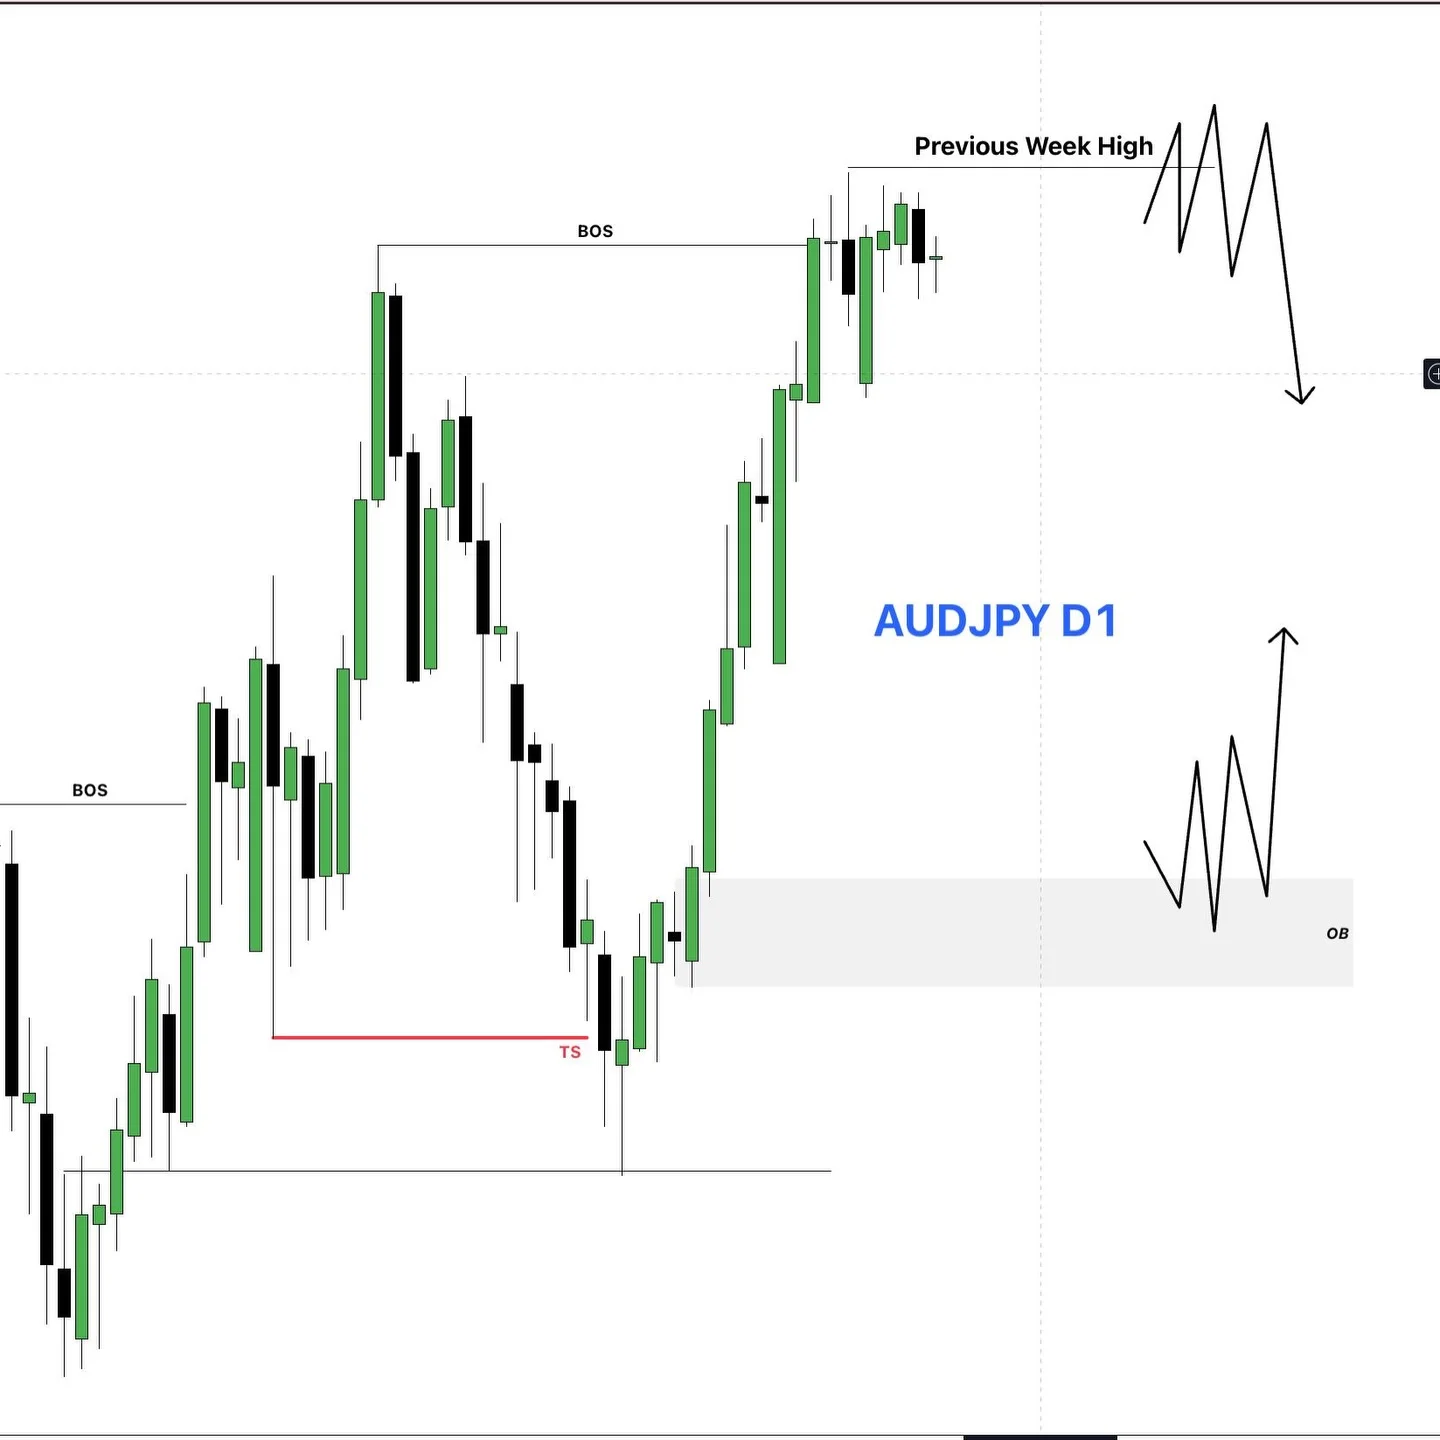
Liquidity Sweep Triggers Pullback, Watch AUDJPY Order Block
📊 AUDJPY – Daily Forecast 🚀 Weekly candle closed inside 🧠 👉 This signals liquidity on both sides 🎯 Plan: • Expect Previous Week High sweep 💧 • Then market will enter pullback phase 🔄 📉 Scenario 1: ➡️ After liquidity sweep → look for sell (pullback) 🎯...
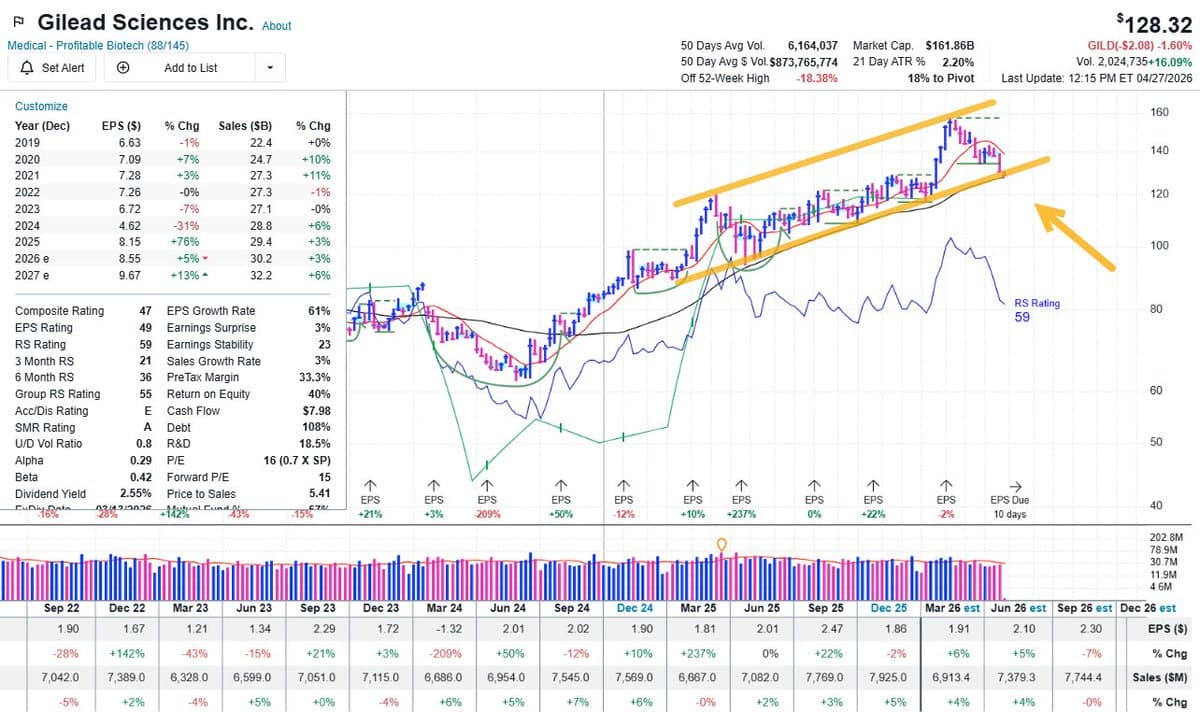
Gilead Nears 20% Pullback, Long-Term Uptrend Intact
Gilead Sciences $GILD is getting interesting here. Stock is approaching a ~20% drawdown, tapping on this multi-month channel. Longer-term uptrend is still very much intact. Weekly chart here from @IBDinvestors MarketSurge #IBDPartner https://t.co/tsTDRTYiXA
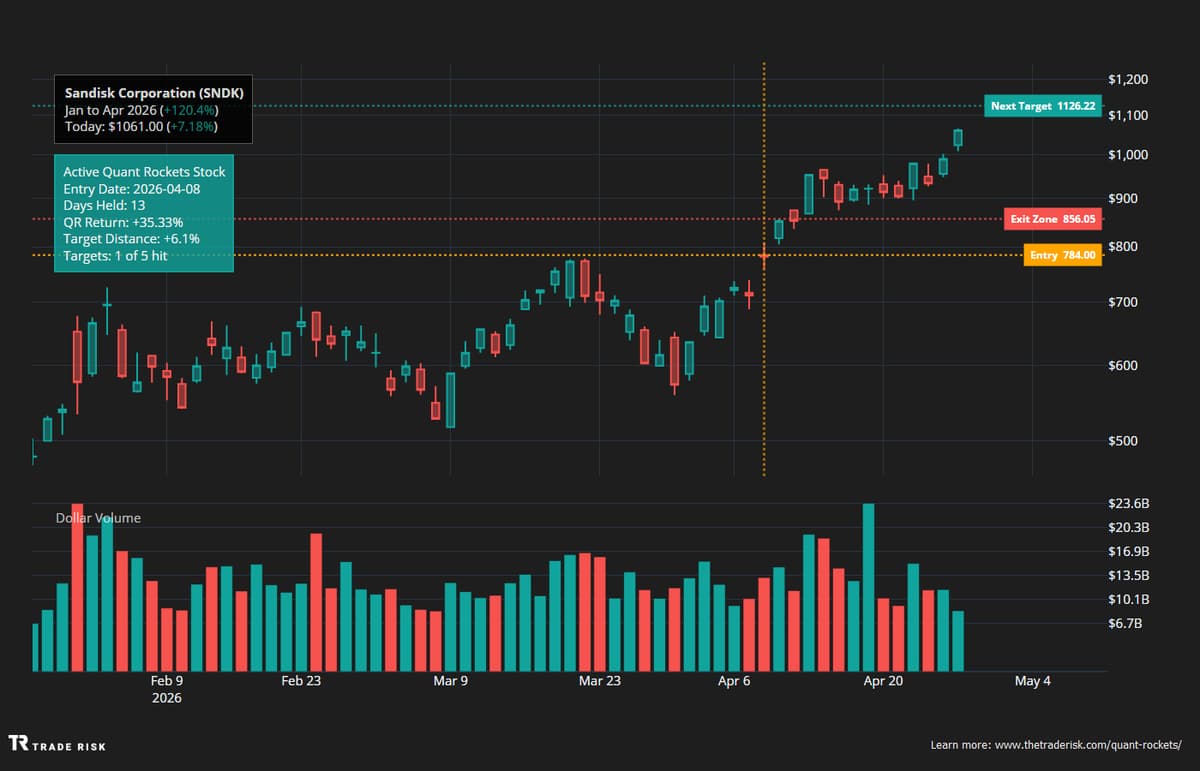
Sandisk Soars While AAOI Plummets in Mixed Portfolio
Biggest winner in the momentum portfolio today is Sandisk $SNDK grinding to new highs. Biggest loser for us is Applied Optoelectronics $AAOI down 10%. Mixed with a negative tilt to kick off the week. https://t.co/IRLLGkDUlE
ORB: Simple, Consistent Trading Strategy Often Overlooked
People always make little jokey jokes about the ORB but it’s honestly one of the most simple & consistent trading strategies.
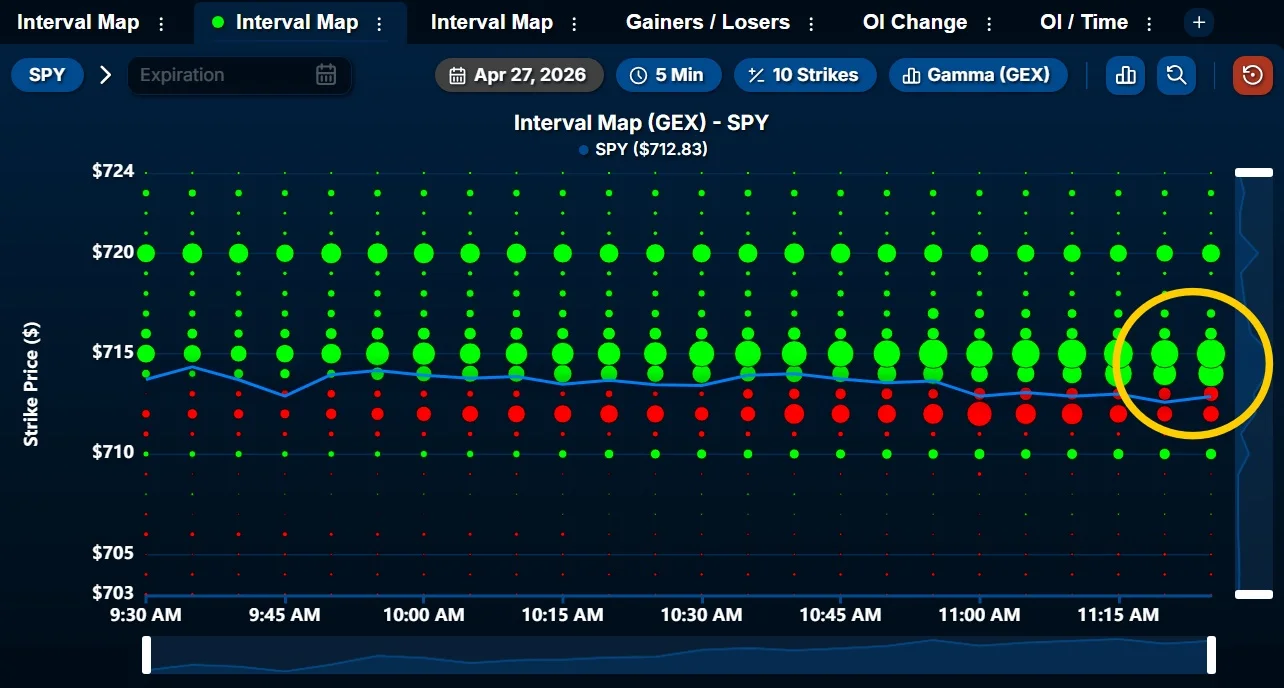
SPY Targets Bounce at $714‑$715, Below $712 Invalidates
At the bottom of the range again on $SPY. $714 is now the MVC, positive exposure at $714-$715 has only increased since the open. Another opportunity for a bounce to $714 here, invalidated under $712.
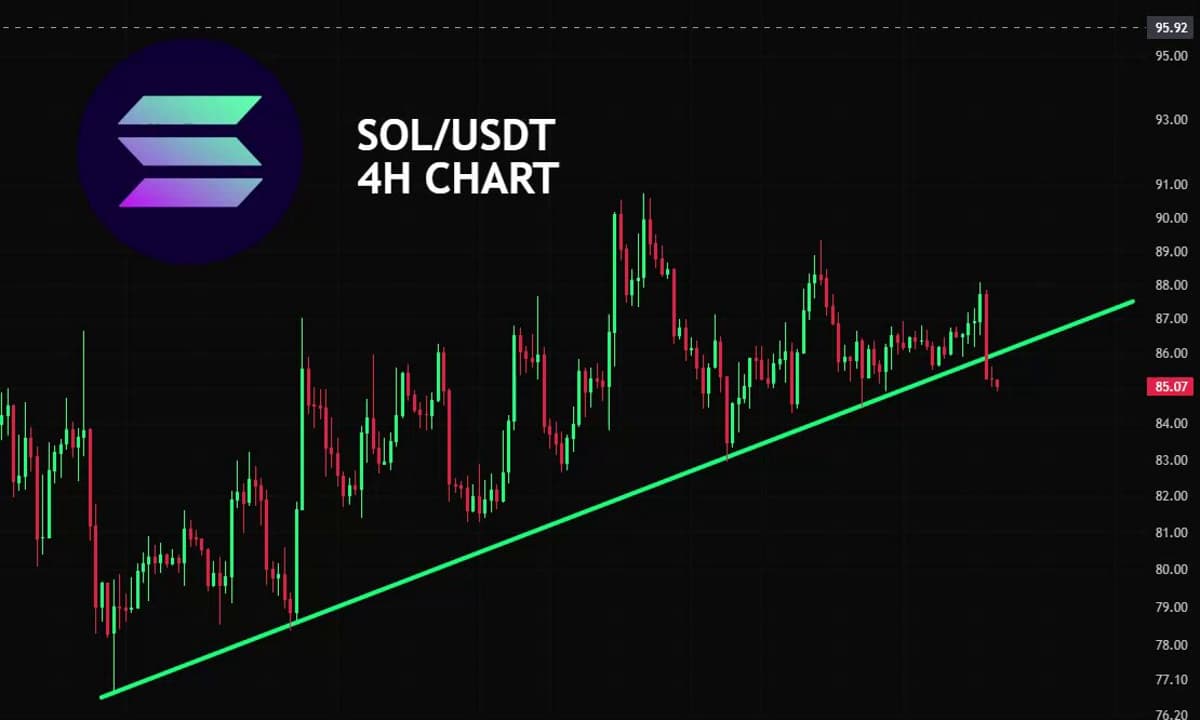
Solana Breaks Key Support, Signaling Potential Correction
🚨 $SOL JUST LOST KEY SUPPORT 🚨 $SOL has broken below its ascending trendline Is this the start of a correction for Solana and its ecosystem? 👀 Stay alert. https://t.co/2VGVEZt3iW

PLTR Poised to Break Above 144.64 on MA Confluence
$PLTR red to green on the day. Price is sitting at a confluence of ma's on the daily. A move and hold over 144.64 next on my radar

All Signals Turn Risk-On, Rally Likely Ahead
All four signals just flipped Risk-On. Utilities lagging. Lumber outpacing gold. S&P 500 nearly 7% above its 200-day. The last time the model was this aggressive, the rally extended. Are you positioned for it? https://t.co/AUo8JQGNdw
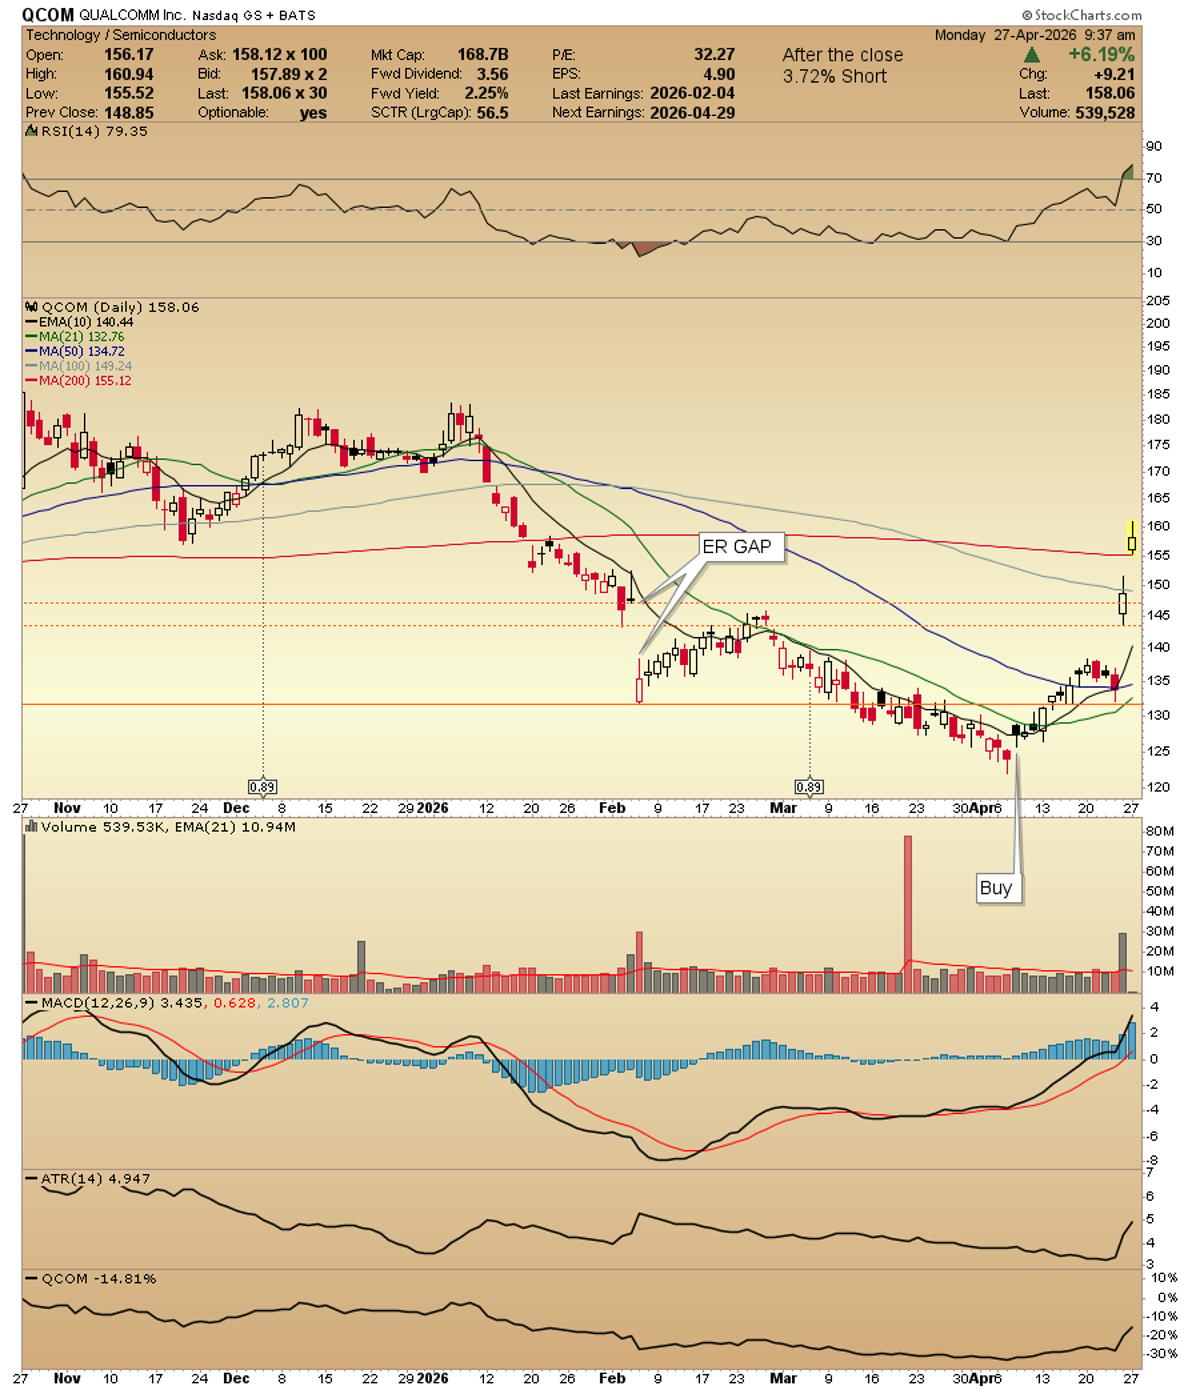
QCOM Gaps Higher, Staying Above 200‑day Moving Average
$QCOM with another gap up and over 200ma daily. Haven't updated chart yet but you can see why the comment. If not in might need the name to base first. Trade your plan not my noise. ...
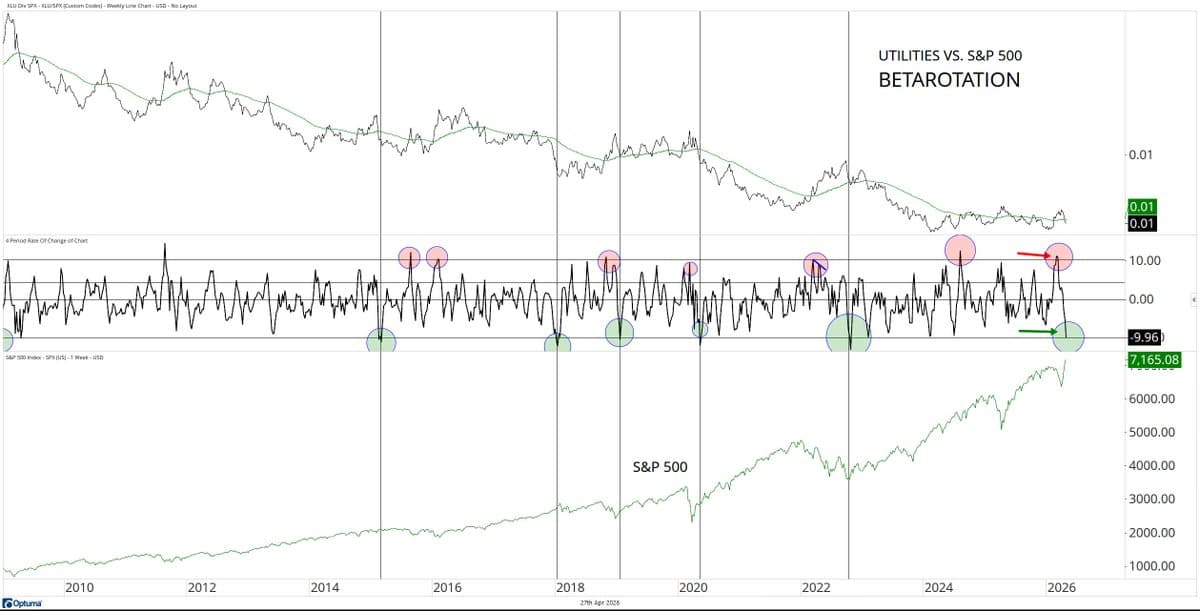
Beta Rotation Hits 3.5‑year Low, Signaling Risk‑on
the #betarotation model has fallen to its lowest level in 3.5 years, measuring the differential in the 4-week rate of change between utilities $XLU and the S&P 500 $SPX... (it's a risk-on signal)... https://t.co/F6oLjIXEhW
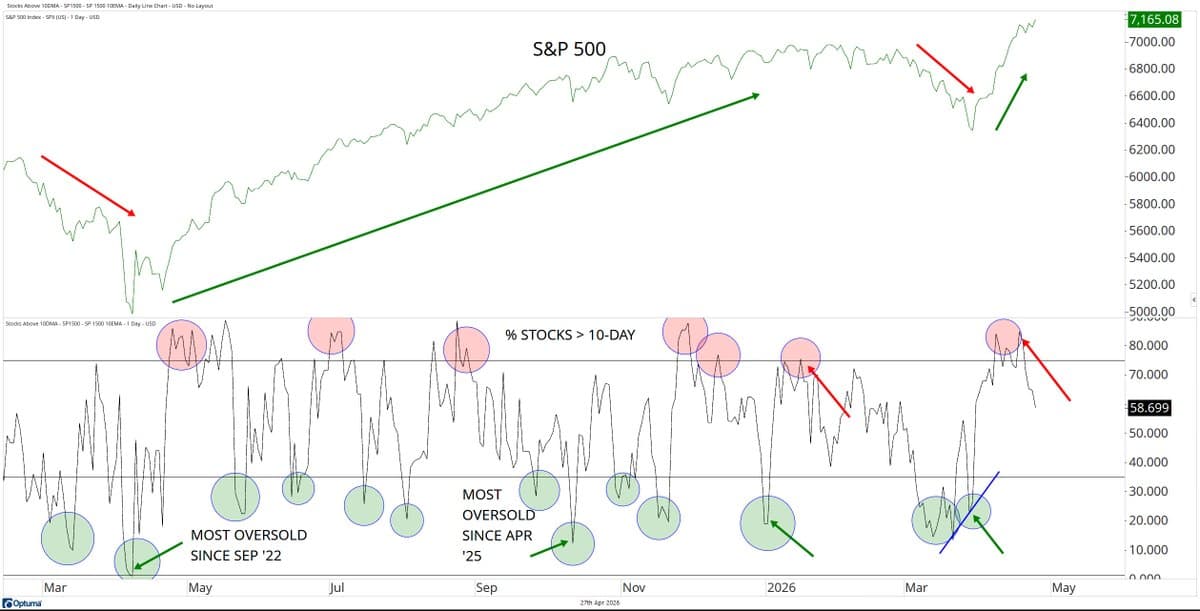
S&P 1500 Overbought: Majority Above 10‑Day EMA
although the market hasn't come in, we're working off the overbought condition, here with the % stocks in the S&P 1500 > 10-day EMA... #marketbreadth $SPX https://t.co/R2JvU6u1Fp
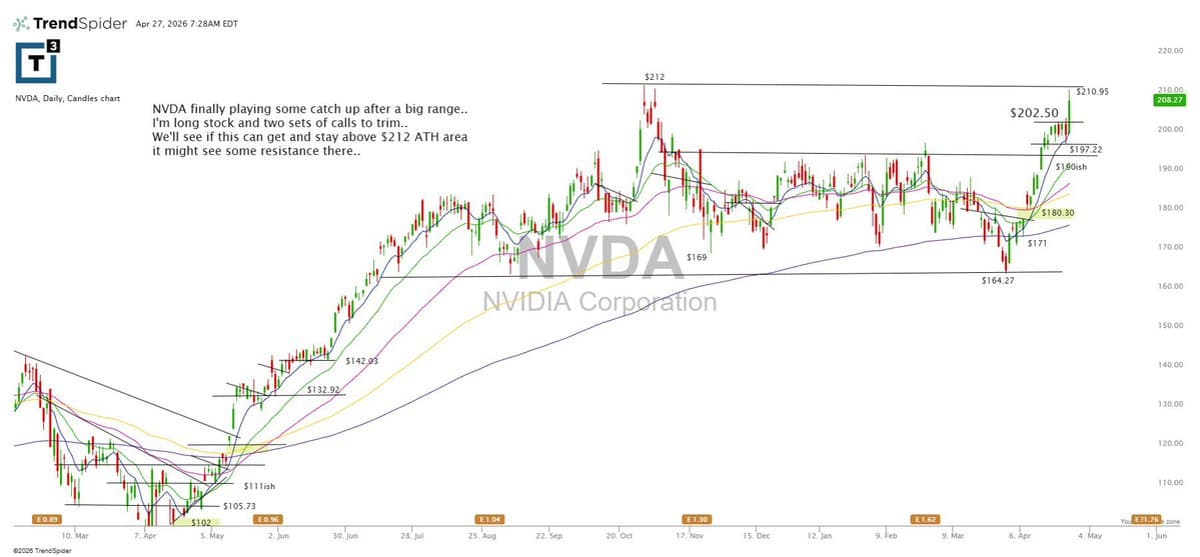
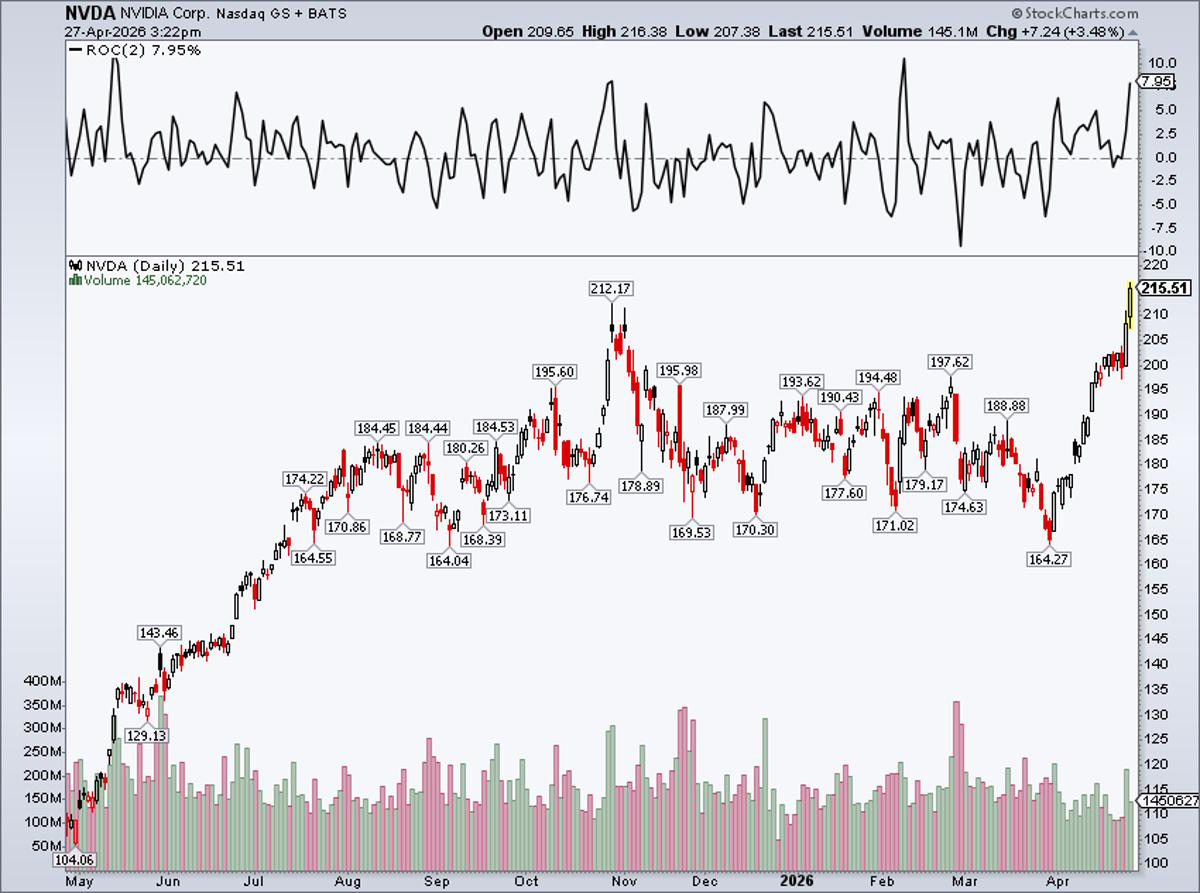
NVDA Hits Critical $212 Level, Swing
$NVDA $212 is a big spot. Great swing long from a few weeks ago to manage https://t.co/MUCRnPDZ3u
Focus on a Few Quality Setups Amid Market Volatility
Everybody always asking where the opportunities are in this market… This week is one of those weeks where the market is literally handing you setups & the money 🤑 if you know what you’re looking at. Earnings are stacked & major companies...

Market Floor Sets up Fragile Upside After Stagnation
Fragile Upside 💫“Going Nowhere Fast” Is About To Change 💫The Floor Meets Crash Protection 💫Fragile Upside 💫Sell In May… https://t.co/k9g9uy0uak

Semis Overbought; Expect 2‑3‑Month Dip, 9‑Month Rally
Semiconductor stocks have been red hot for several weeks but they are now over-extended. If history is any guide, near-term consolidation (spanning 2-3 months) is likely followed by strong gains over the next 9-10 months. $SOX
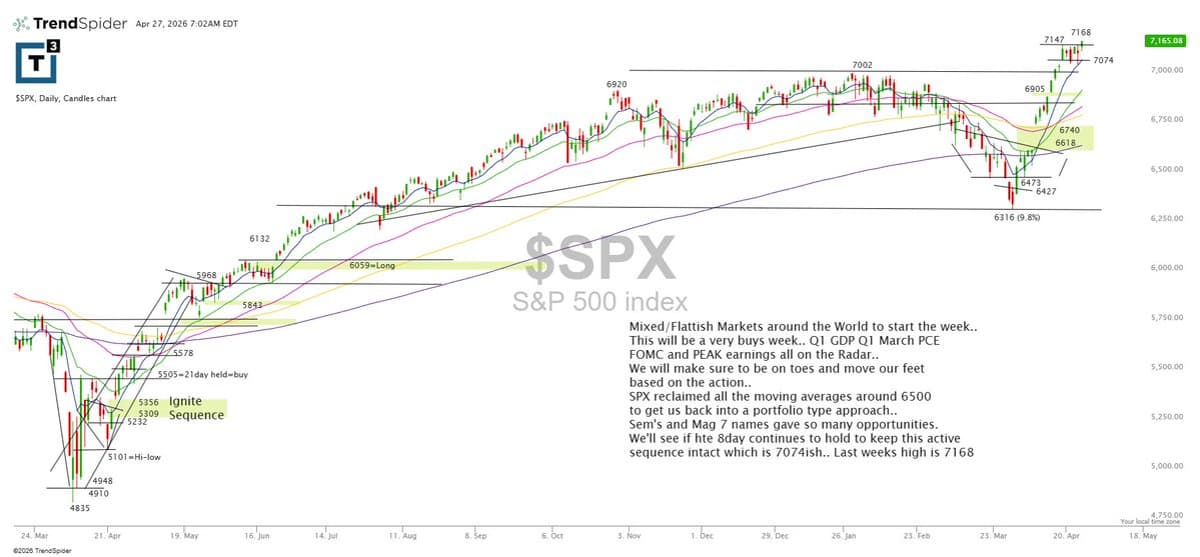
S&P 500 Reclaims 6500, Eyes 7074 Hold
$SPX reclaimed the moving averages around 6500, getting us back into more of a portfolio-type approach, and semis/Mag 7 have been full of opportunity. Now we’ll see if the 8-day holds (7074ish) to keep the active sequence intact, with last...

Vol‑control Funds Auto‑buy as Volatility Falls, Fueling Rally
Update on mechanical buying: Also reminder: Vol-control funds, as long as realized vol continues to drop, can continue to auto buy & fuel this rally. Even if Iran War escalates, or a MAG5 name reporting this week disappoints, etc. That’s why I track...

October's Investor Sentiment Hit an Extreme Low
Yet another indicator highlighting what an extreme point in investor sentiment last October really was...

Signal Shifts, Not Opinions, Drive Market Timing
In today's Early Look: "Why The Need To Balance All-Time #Quad2 Highs?" Bearish in March. Long in April. Not because I changed my mind. Because The Signal did. There's a difference — and it's the entire difference between a process and...

9 Years of Trading: My Complete Price Action Guide
I've traded for 9 years and this is everything I know about Price Action ↓ https://t.co/vL0UXaOa6Q

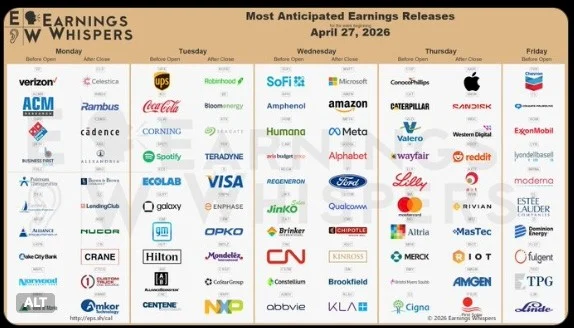
Plan Ahead for Earnings Week: Less Is More
Busy earnings & Fed week. Have a plan going in so you don’t have to be reactive. Less is way more.
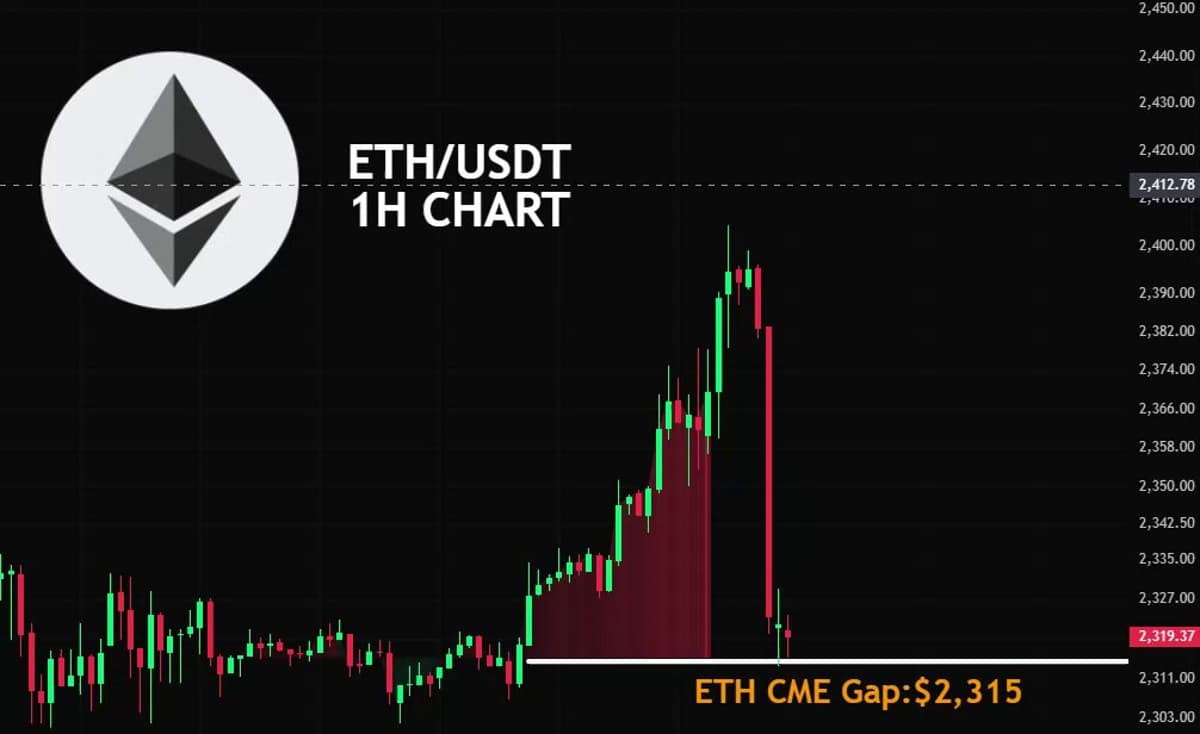
ETH CME Futures Finally Fill Predicted Gap
$ETH CME Futures have just filled the gap I warned you about this earlier… https://t.co/adHWAnbDQl

OHGR Beats Expectations Yet Remains Risky Play
#OHGR "ahead of market expectations". ShareScope showing fwd p/e 18.5 falling to 17.9 and fwd Divvy 2.6% rising to 2.7%, BEFORE today's news and allowing for cash. Illiquid but play on NHS failure. I don't hold.
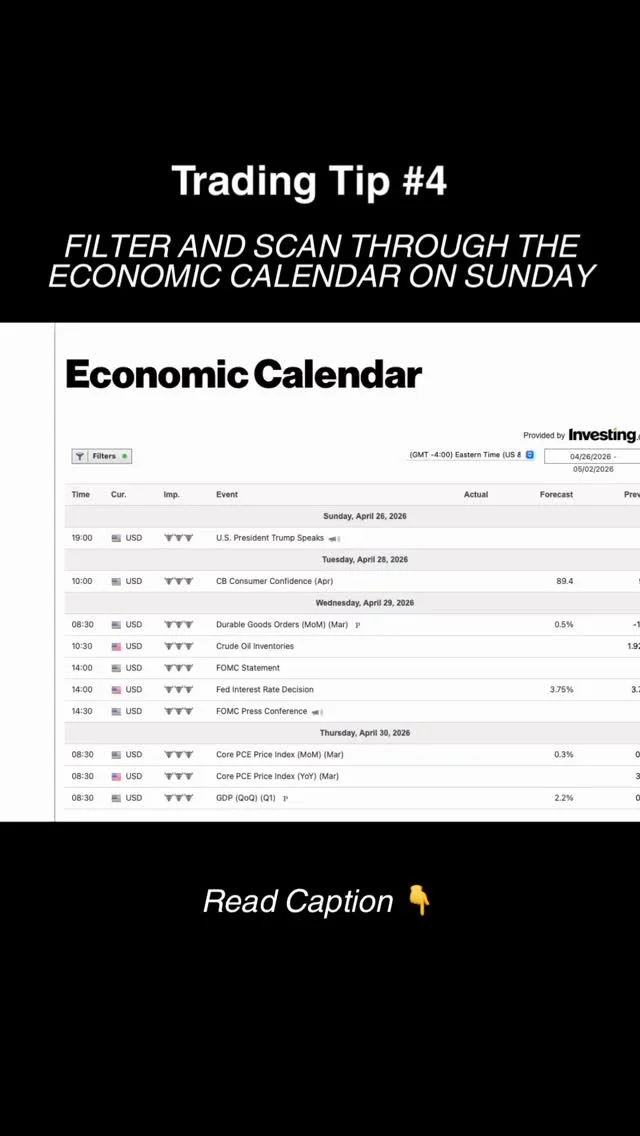
Check the Economic Calendar Weekly for Trading Edge
Beginner traders focus only on charts… profitable traders also study the calendar. 📅📈 One of the biggest edges you can build every Sunday is scanning the economic calendar before the new week starts. Why? Because news moves markets. Interest rates, inflation data, jobs...

Master Low‑Float Squeezes: Multiple Strategies Revealed
I learned from the best of the best how to catch low float squeezes in multiple different ways Earnings is going to be another way I show y'all

Breadth Flip Signals Rotation, New Buys & 1.5% Protection
New post 🔽 • First breadth flip since 3/31 • What it means for new buys • My 1.5% rule for protecting a great month • The names that are still working Why rotation is the best case scenario right now: https://t.co/ErPUOzUK85 https://t.co/85dUSF5yts

Fed Pivot Sparks S&P Rally; Staying Long
Fed pivot is real. The S&P 500 rally has legs, and I’m not sitting it out. Chasing this move feels risky, but missing it feels riskier. Staying long. SPX

Skip SPY, Target Tech and Financials via Bull Steepener
Chasing the S&P 500 rally? This analyst says skip SPY and go for XLK (Tech) & XLF (Financials) instead, betting on the "bull steepener" trend. Risky but structured. 🚀 SectorRotation

Best Trades Emerge From Consolidation, Not Chasing Tape
The Sunday Stalk List | Ep. 43 Market is Catching It's Breath The tape is in a good place but it's not a tape to chase. Build the list, define your risk, and let the setups come to you. The best entries are...
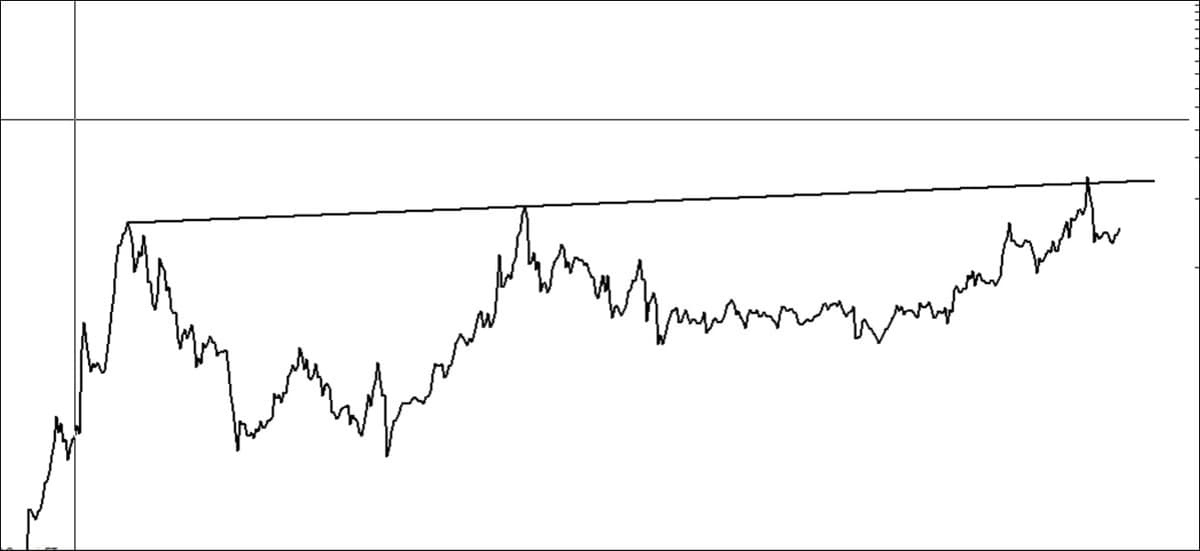
Identify Right Chart, Profit From Left Pattern
If you know what the chart on right is, then you will probably make oodles of money trading the chart on the left. https://t.co/Im5AqBCW0w

S&P Rally Fragile, Driven by Soft‑landing Narrative
Chasing the S&P 500 rally? 📈 Michael J. Kramer says it’s a fragile, momentum-driven move based on a “soft landing” narrative. Valuations are high, and leadership is narrow. 🚨 Be careful out there. Markets

AIM Eyes Support as Bullish EMAs Hold
#AIM All Share small Down Candle. Support 774, 750, 726. Resistance 812, 837. RSI 61 not high. 13/21 day EMAs Bullish. Small Down Candle on Weekly. Top Bollinger Band 817. Midpoint Line 800. Bottom Band 782.

Nasdaq Hits New ATH, Overbought Yet Still Rising
#Nasdaq Comp New ATH 24854. Support 24199, 23000, 22501. RSI 70 Overbought but can go higher. Small Up Candle on Weekly. Top Bollinger Band 25140. Midpoint Line 24200. Bottom Band 23260.

Brent Oil Nears Bullish Breakout Amid Tight EMA Cross
#BrentOil Comp Doji Candle & Sideways. Resistance $103.9, $112.1. Support $91.4, $86.1, $80. Lining up MACD Bull Cross. RSI 55.5 near Neutral. Just done 13/21 day EMA Bull Cross but Lines tight. Up Candle on Wkly. Top Bollinger Band $103.5....
Bitcoin Poised for Breakout From Tight Range
🚨BITCOIN'S NEXT MOVE Bitcoin is trapped inside a low time frame range, capping upside and downside momentum From here, a break of resistance or support will see Bitcoin exit the range, leaving the price free to move https://t.co/k1aflQa7cQ
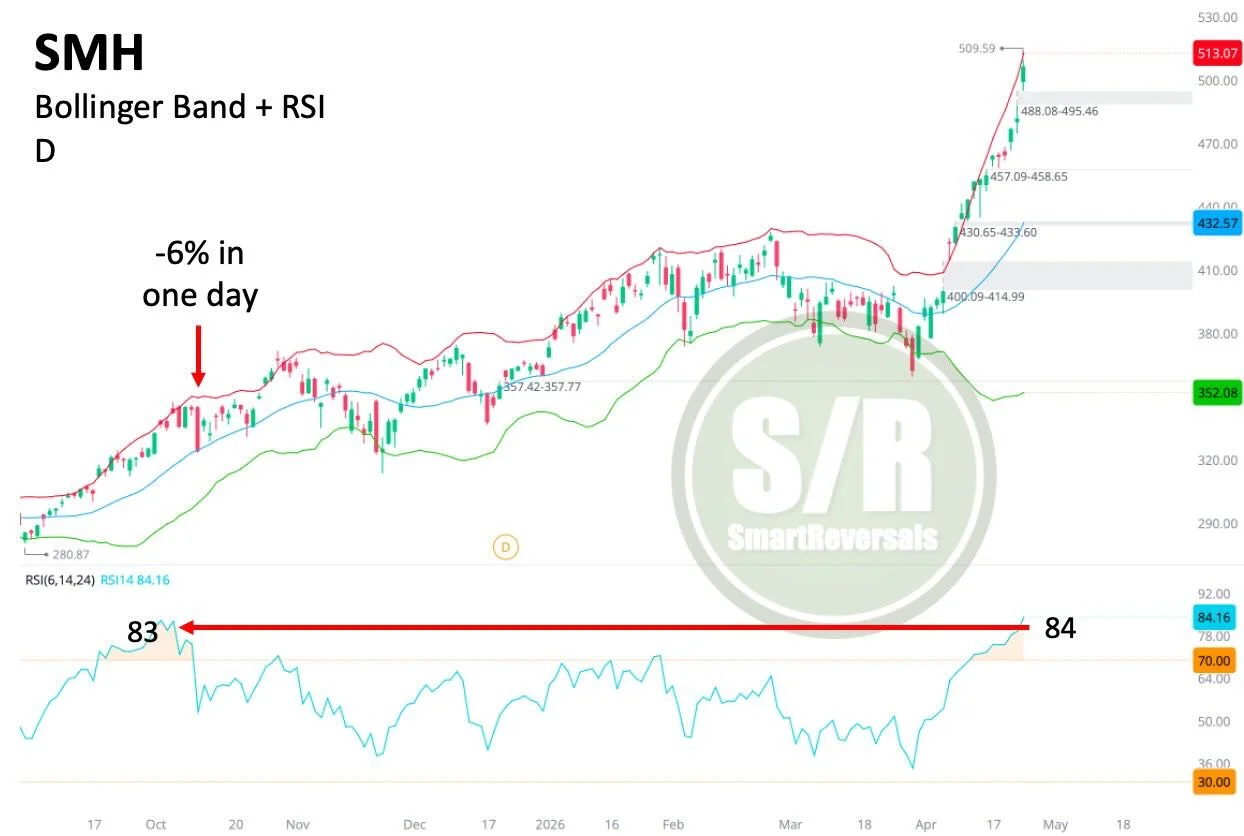
Breakouts Bullish, Yet High RSI Signals Potential Drop
SMH: Are breakouts bullish? They are. Just be aware that the last time the RSI for semiconductors was above 80, there was a -6% move in a single day as part of the consolidation. Back then, we didn't have three...