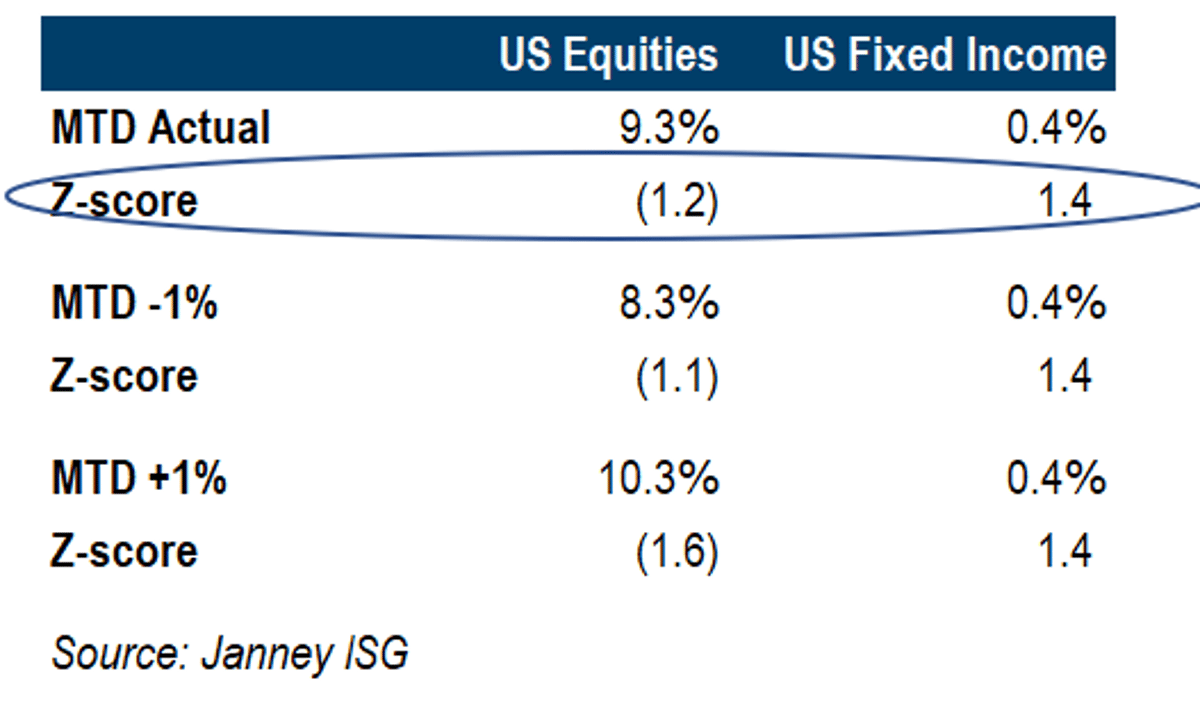
Month-End Rebalancing Drives Strong Equity Sales, USD Rate Buying
Early look: month end rebalancing needs are the highest in a while: have -1.2 z-score for sale on equities (including this morning's selloff) and +1.4 z-score buying in USD rates markets. https://t.co/yuKAoaPSGq
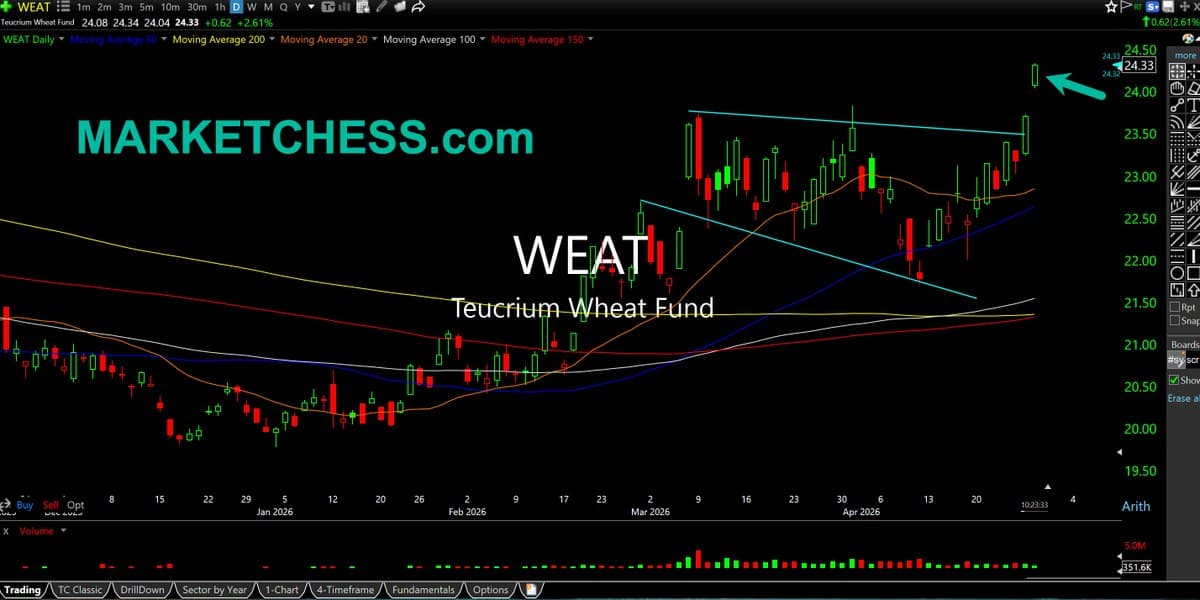
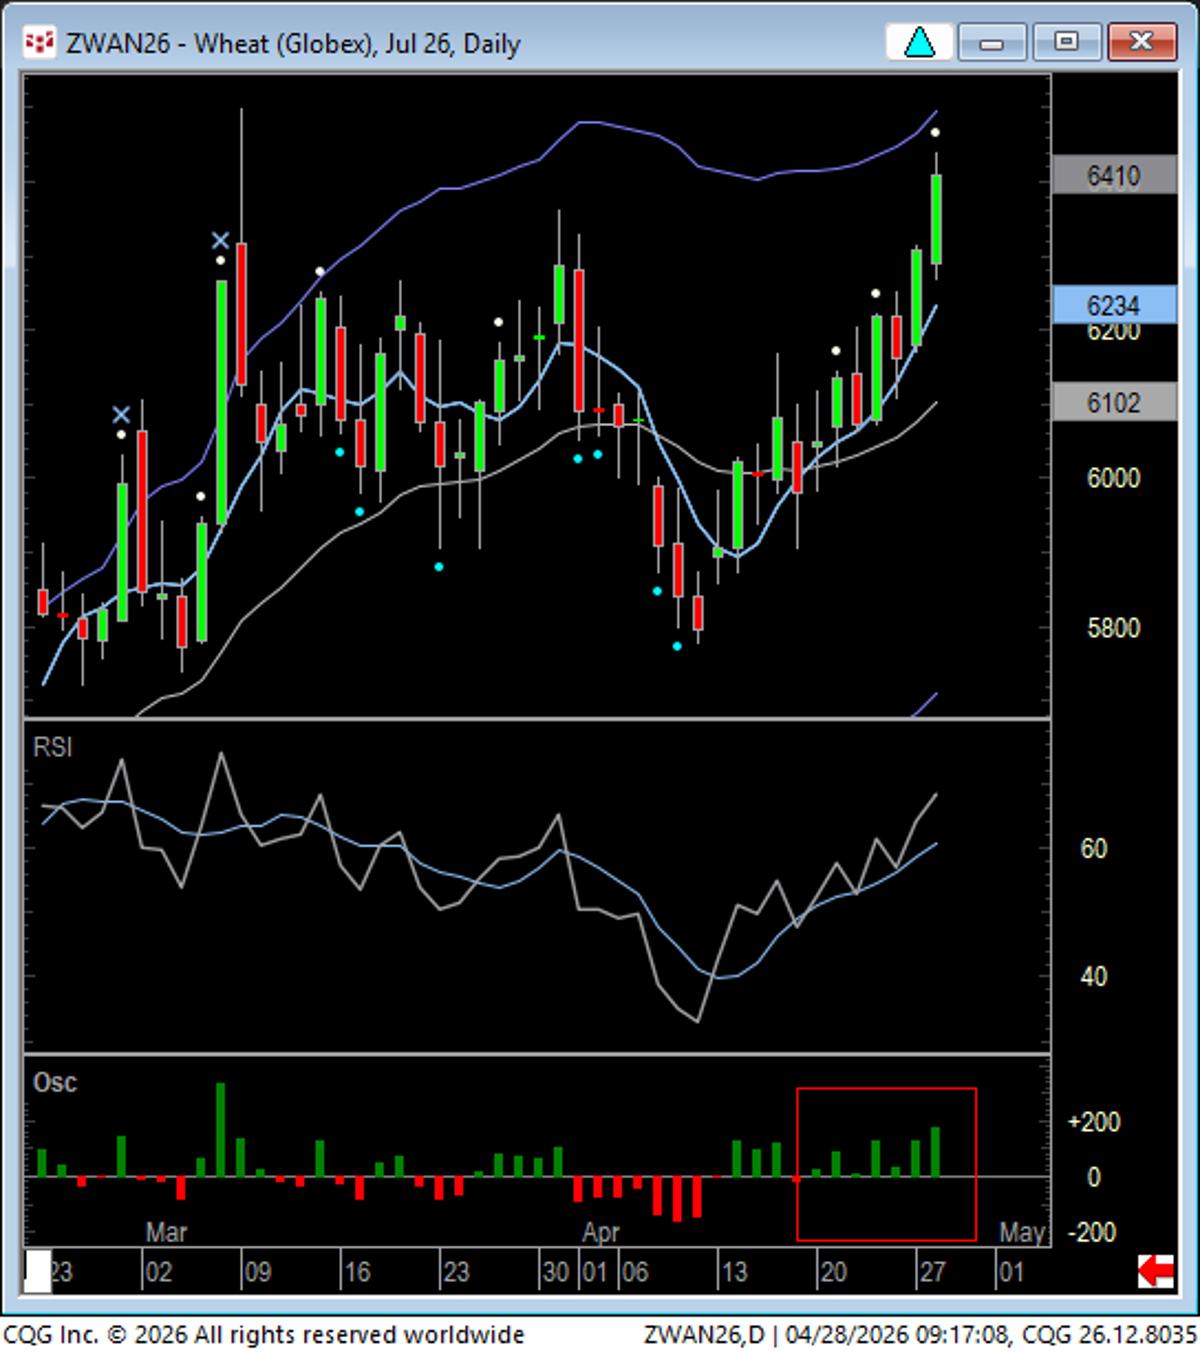
Wheat Shows Strong Multi‑Quarter Breakout Amid Supply Disruptions
$WEAT Daily. Clean, multi-quarter breakout in Wheat likely being overlooked this morning given action & headlines elsewhere. But ramifications are important given supply disruptions. https://t.co/DCE8xmUj62

Riding OIH’s Rise, Adding While Protecting Break‑Even
$OIH is an absolutely beautiful chart. I have been adding on the way up and trailing my stop at break-even average cost.
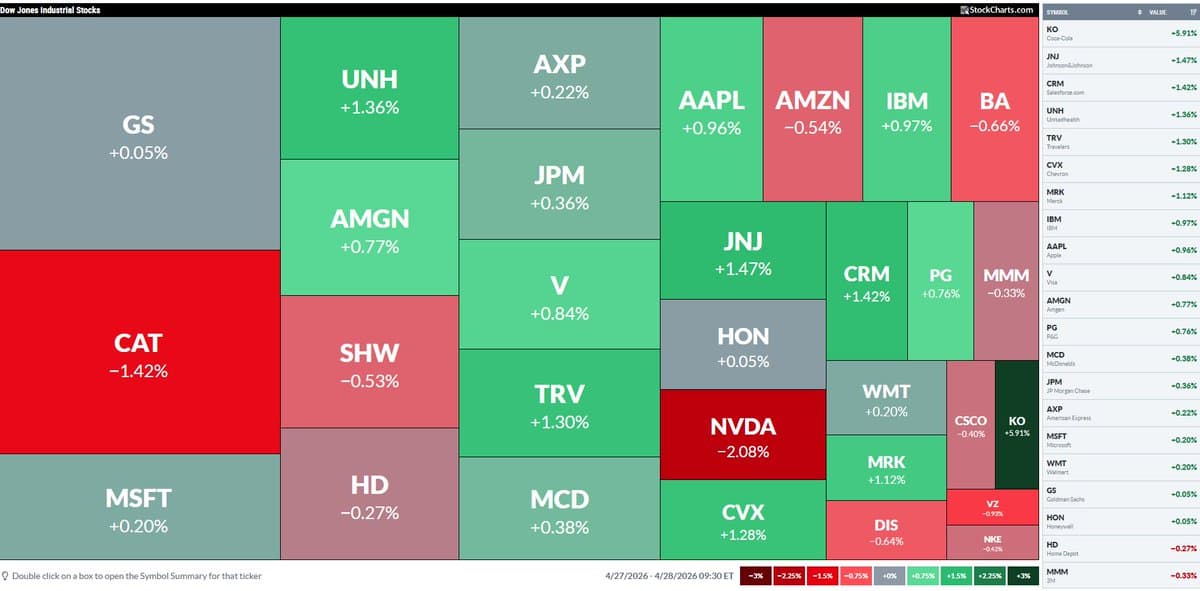
DJIA Climbs Despite CAT Drag; KO Jumps, NVDA Dips
$CAT weighs on the DJIA, but the Index is up $UNH $AMGN @stockcharts $KO popping 6% $NVDA -2% https://t.co/jNhwJV2stv
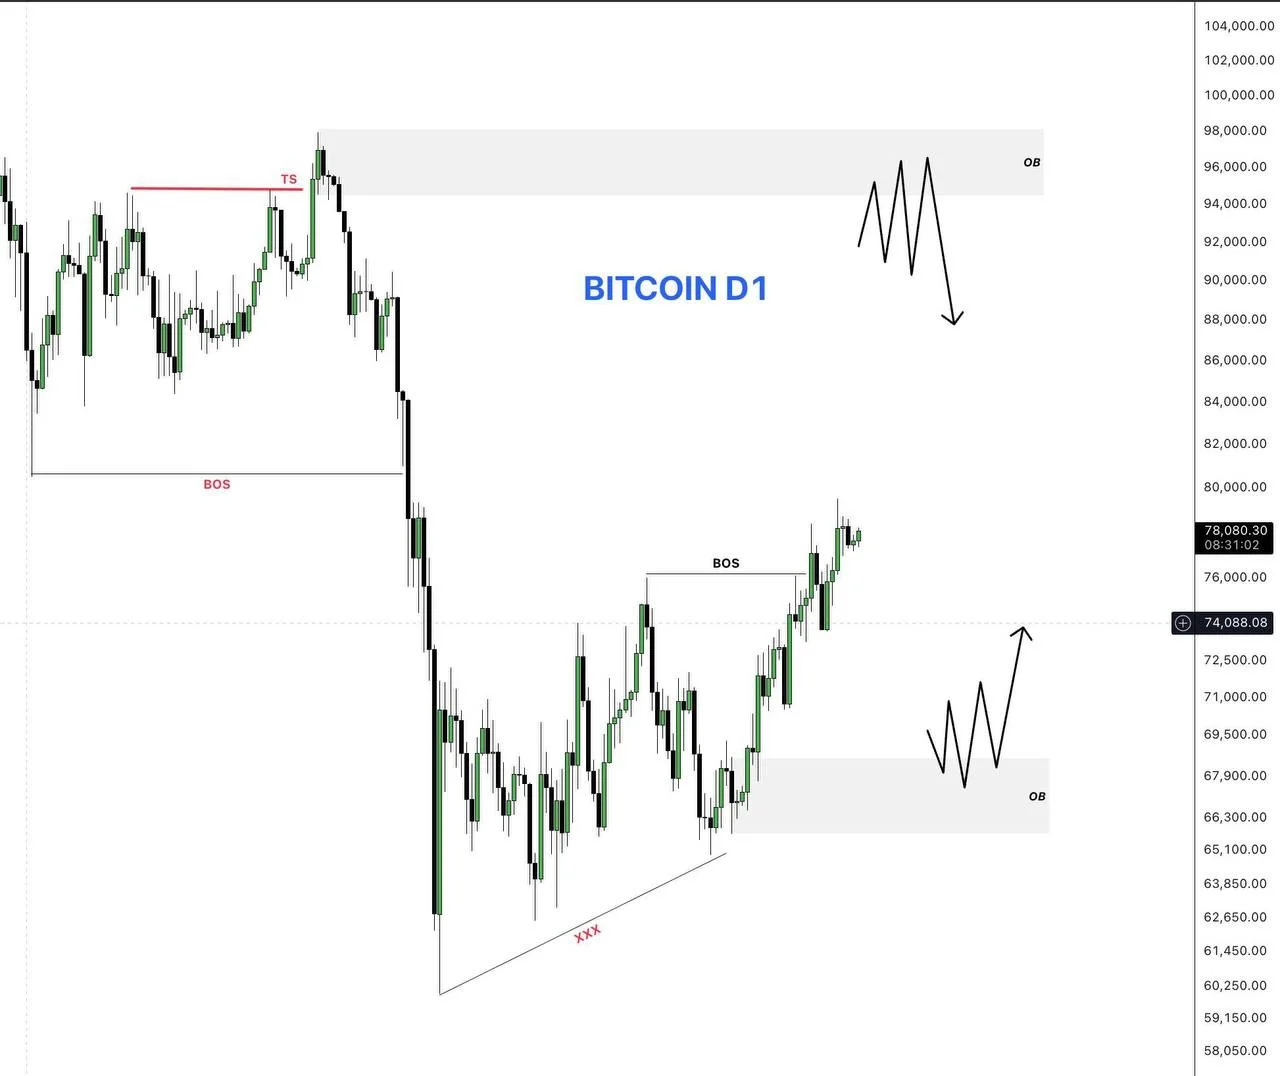
BTC Pullback Bullish Now, Bearish Shift Ahead
📊 BTCUSD – Daily Forecast ✈️ 🔎 Market Structure: • Main structure is bearish 📉 • Current move is a bullish pullback 🔄 🎯 Scenario 1 (Short-Term): 👉 Market is in H4 bullish structure ➡️ Can continue buy move towards Bearish OB 🪙 🎯 Scenario 2 (Main...
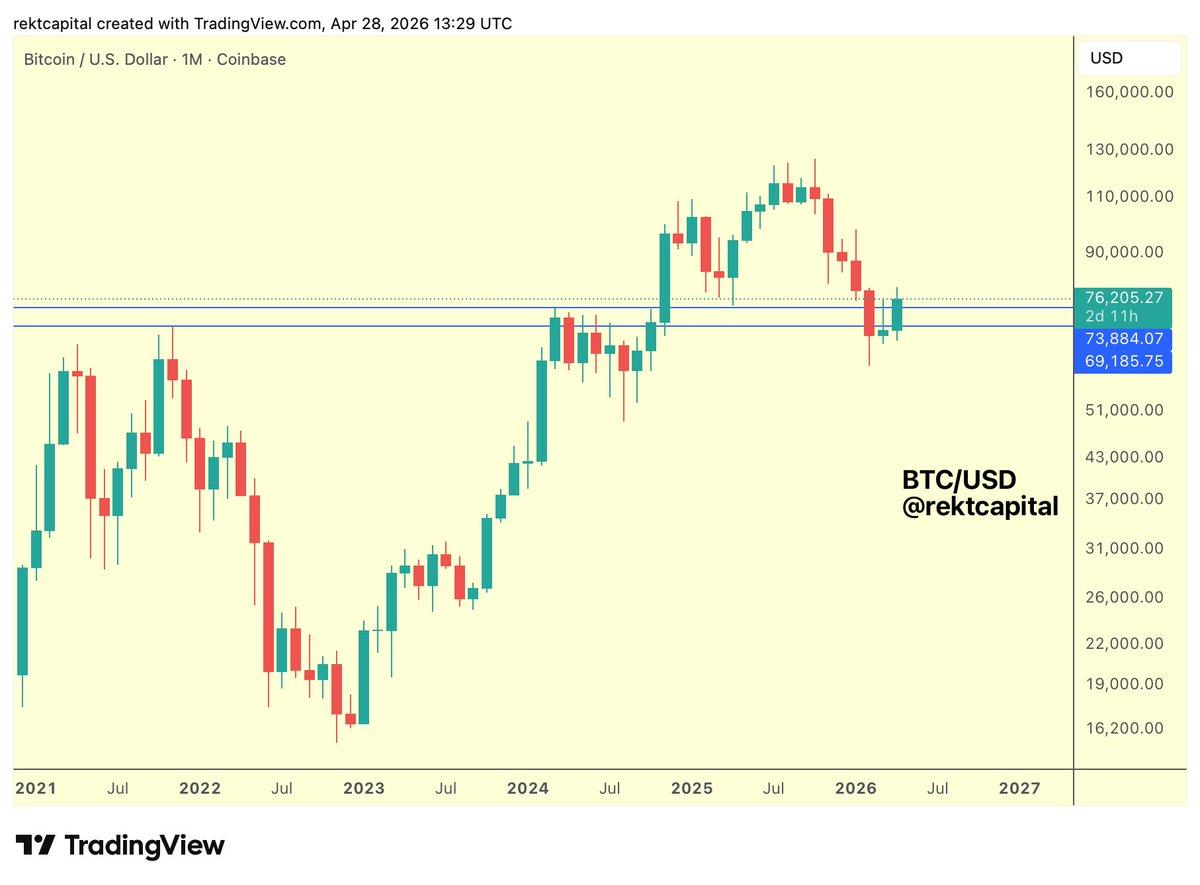
BTC Breaks Past ATHs, 2021 Level Now Support
#BTC Bitcoin has been able to press beyond both old All Time Highs from 2021 and 2024 That said, there are technical nuances to this ascent For example, Bitcoin has been able to successfully turn the 2021 old All Time Highs into support...
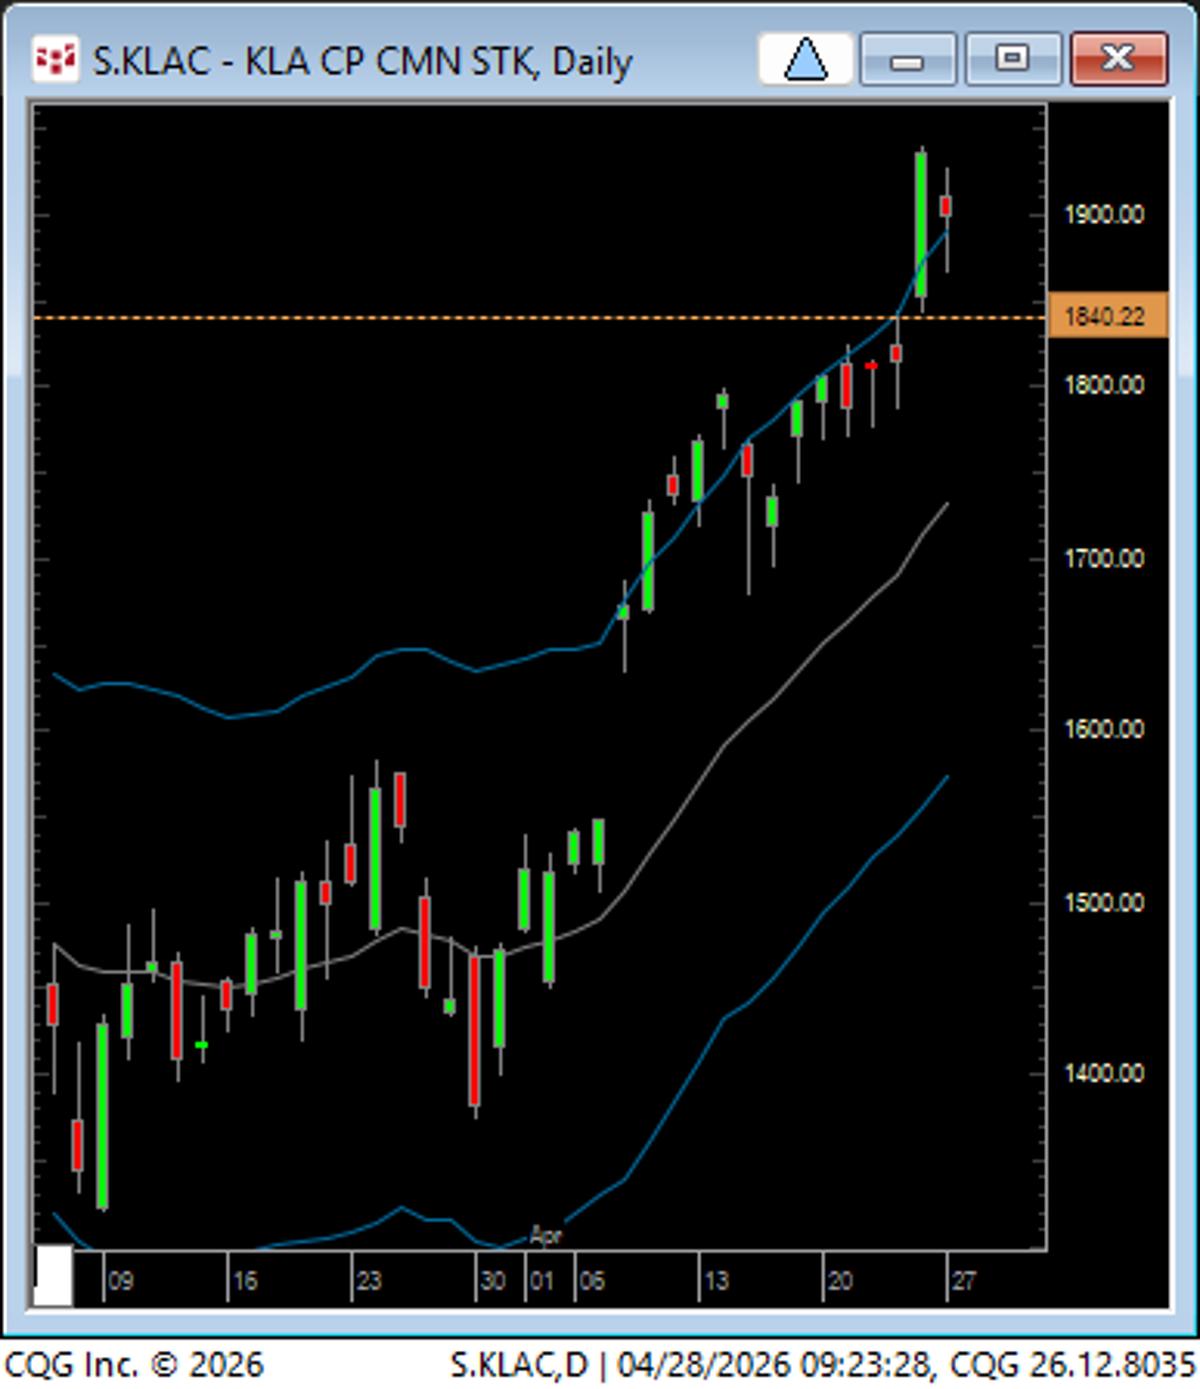
KLAC Expected to Open Below Its Climax Bar Low
KLAC, not to bee outdone by AMD, will open below the low of its climax bar up as well. https://t.co/ICNPsCsaFv
Tesla's Red Reversal Needs Confirmation Before Buying
📺 $TSLA JUST FLASHED A REVERSAL… BUT DON’T TRUST IT YET #Tesla printed a minor red dog reversal after reclaiming a key level, hinting at possible short-term seller exhaustion. But this signal alone isn’t enough. The real test is whether price...
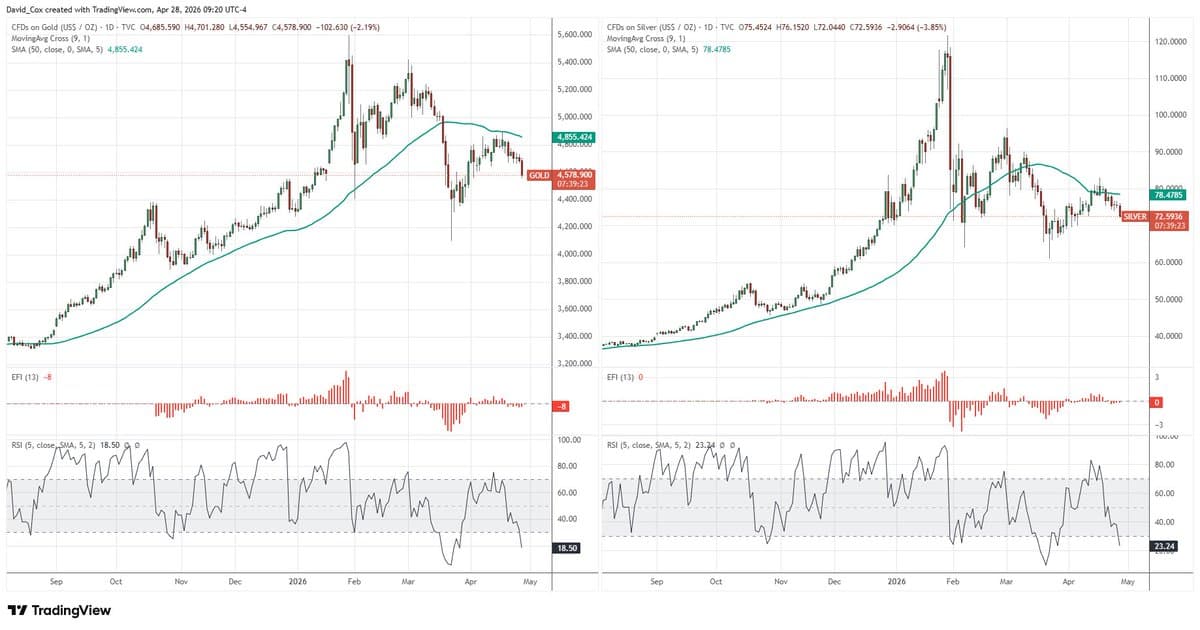
Gold and Silver Oversold Yet Still in Downtrend
gold & silver are RSI(5) oversold on the daily charts... BUT, these are in the context of ongoing downtrends (i.e., lower highs/lower lows and below falling 50-day moving averages)... context matters... https://t.co/DCGZgDHyp4
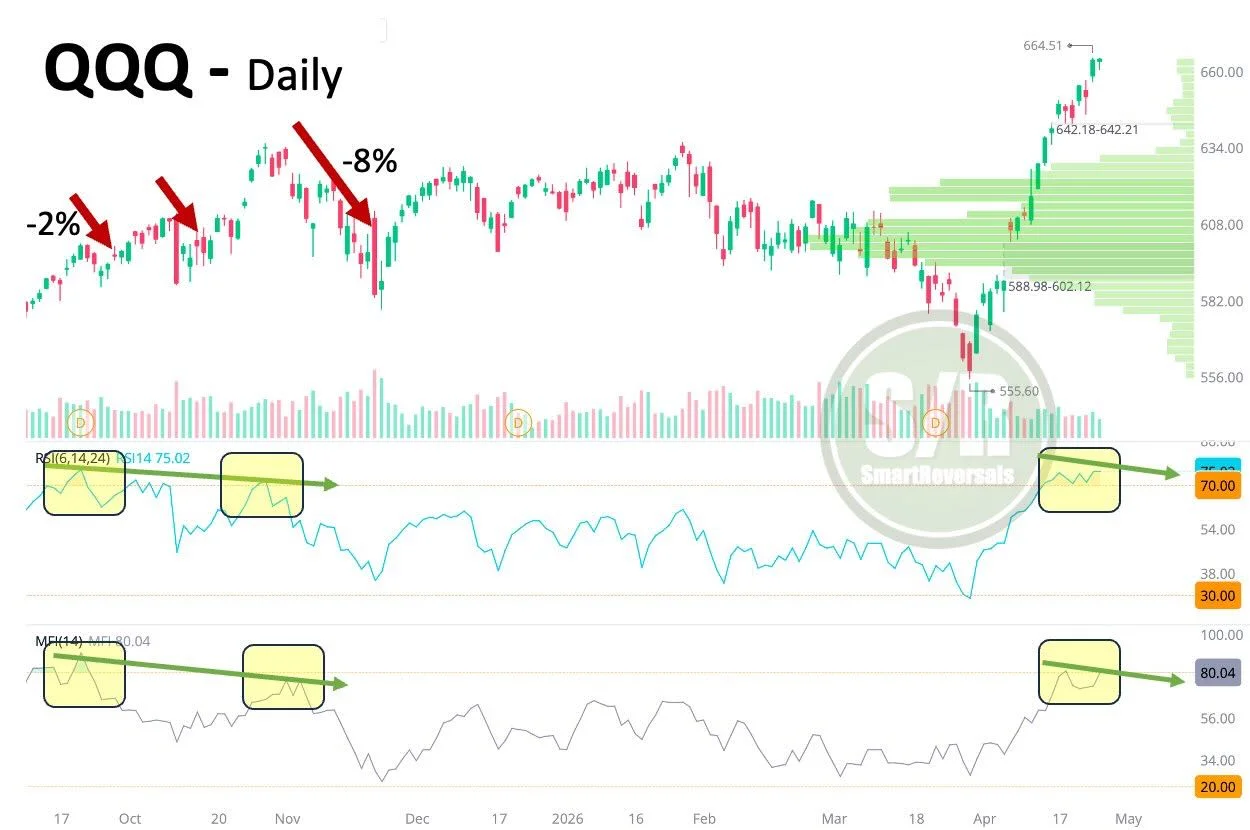
Overbought QQQ Signals Pullback Before 2026 Correction
#QQQ: RSI and Money Flow overbought; time for a breather. A healthy dip usually precedes higher highs in price with lower highs in oscillators, creating a bearish divergence. That's the same expected path: Pullback, recovery, then a sharper correction in...
SOXX and SMH Snap Back to 8‑Day MA
$SOXX $SMH nasty two day reversal (just back to 8MA), can just tell with sentiment + extended vs. MAs doing this for so long
Seven-Day Trend Persistence Signals Trailing Stop Mode
W - going on day 7 of extended run, aka, persistency of trend, aka, trail stop mode. https://t.co/i3ubReK7cx
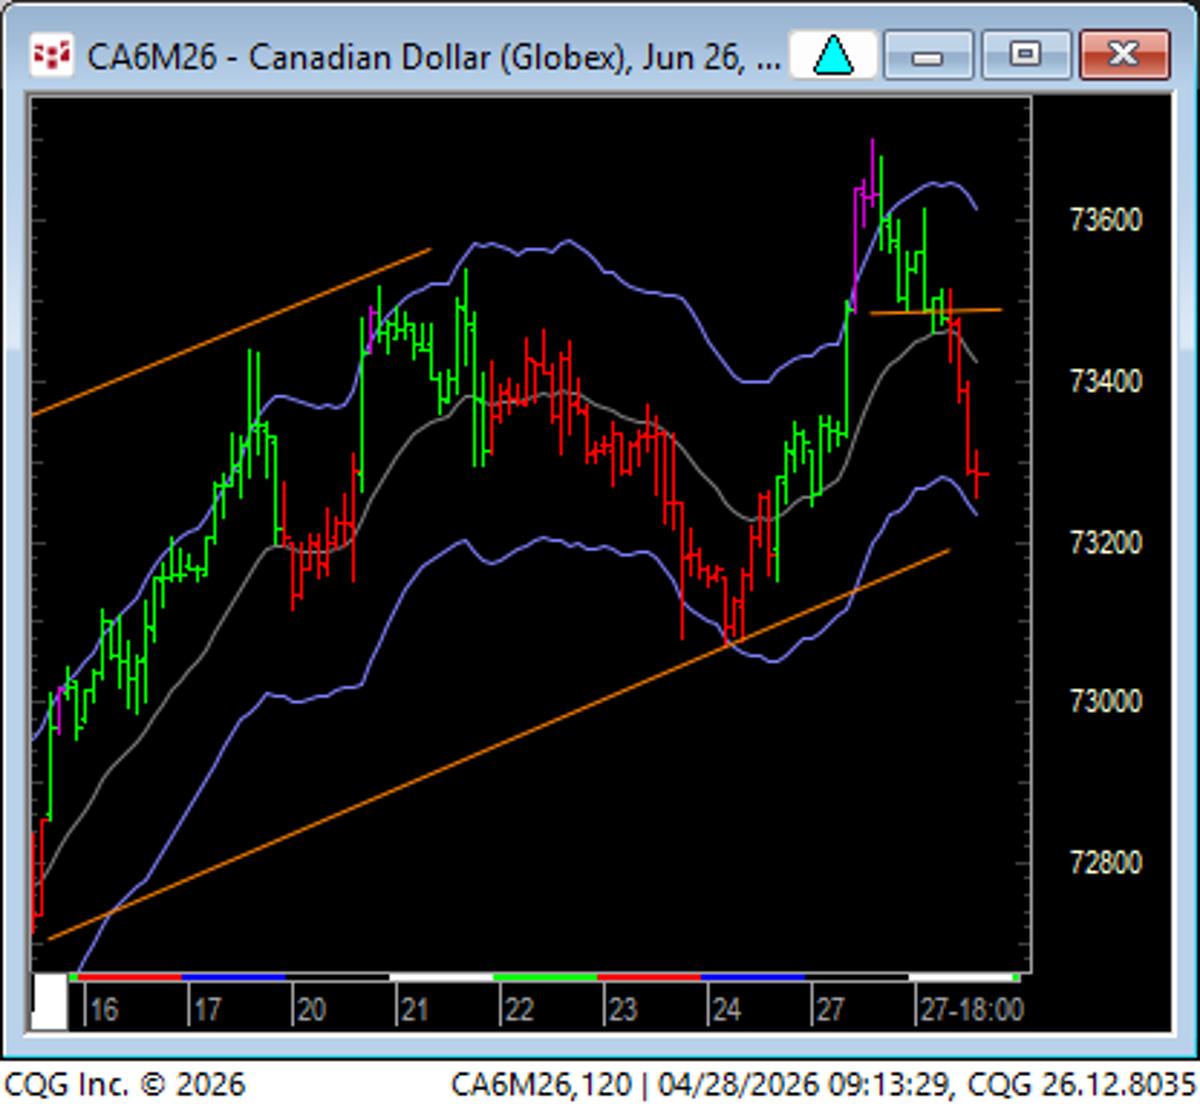
Flag Pattern Triggers Failure Test, Then U‑turn
Follow-up on CD 120 "flag" which led to "failure test" and then "U turn". Closeup on 30 minute candles with osc. https://t.co/u6MEFHYwiA
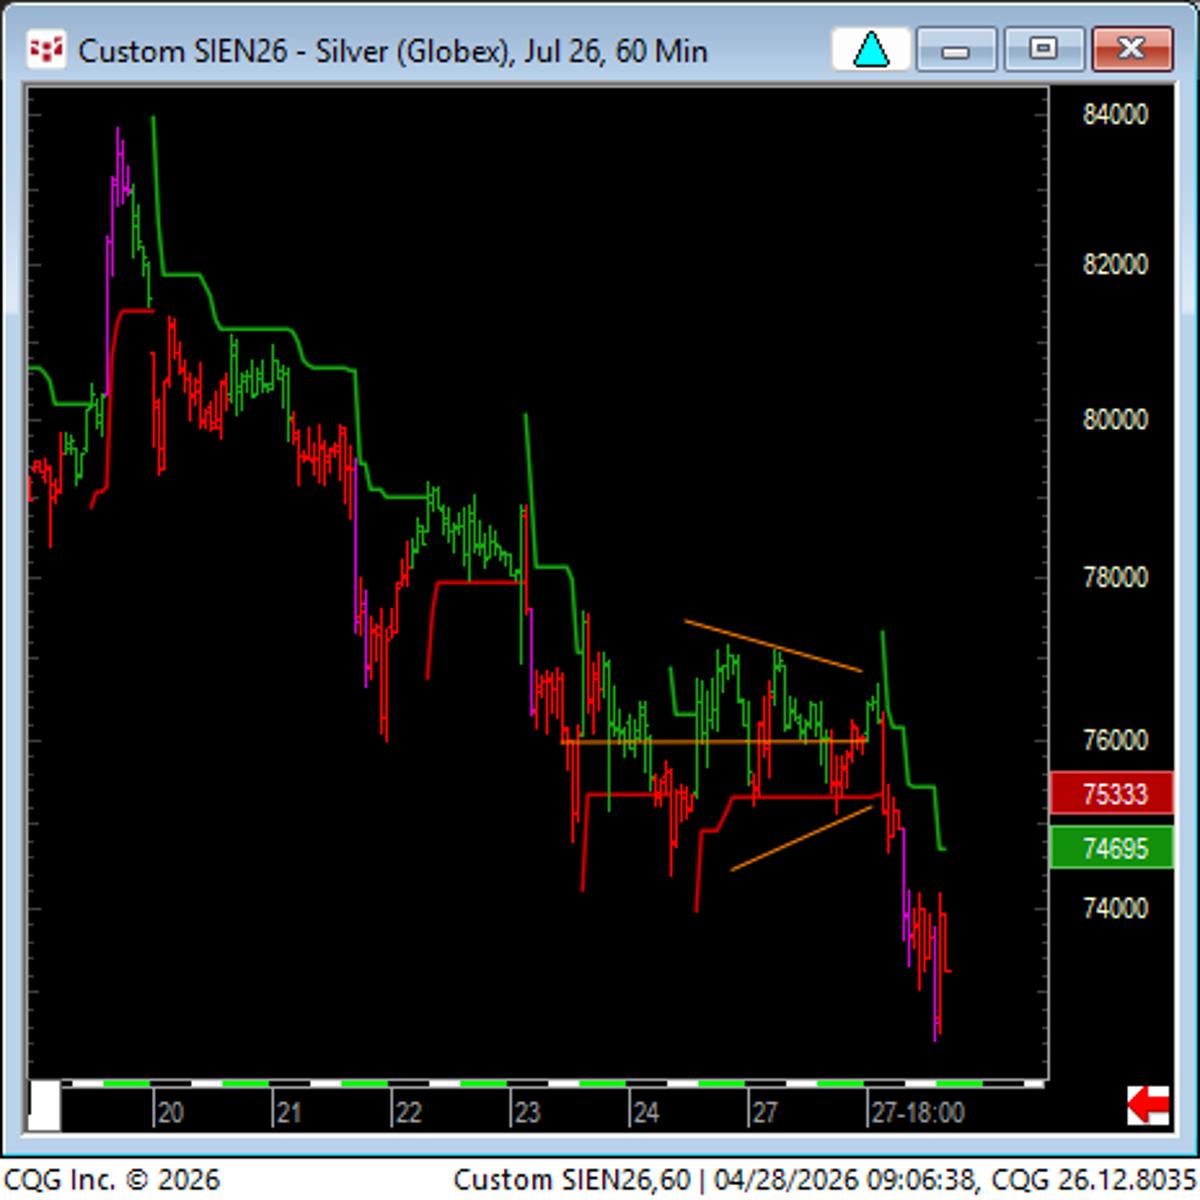
Three‑
SI: downside breakout from three bar with vol trailing stop. Three bars are one of the better patterns leading to range expansion as shown on last nights market profile equilibrium point. (ATR trail stop - red/green lines) https://t.co/1WILeYNVhE
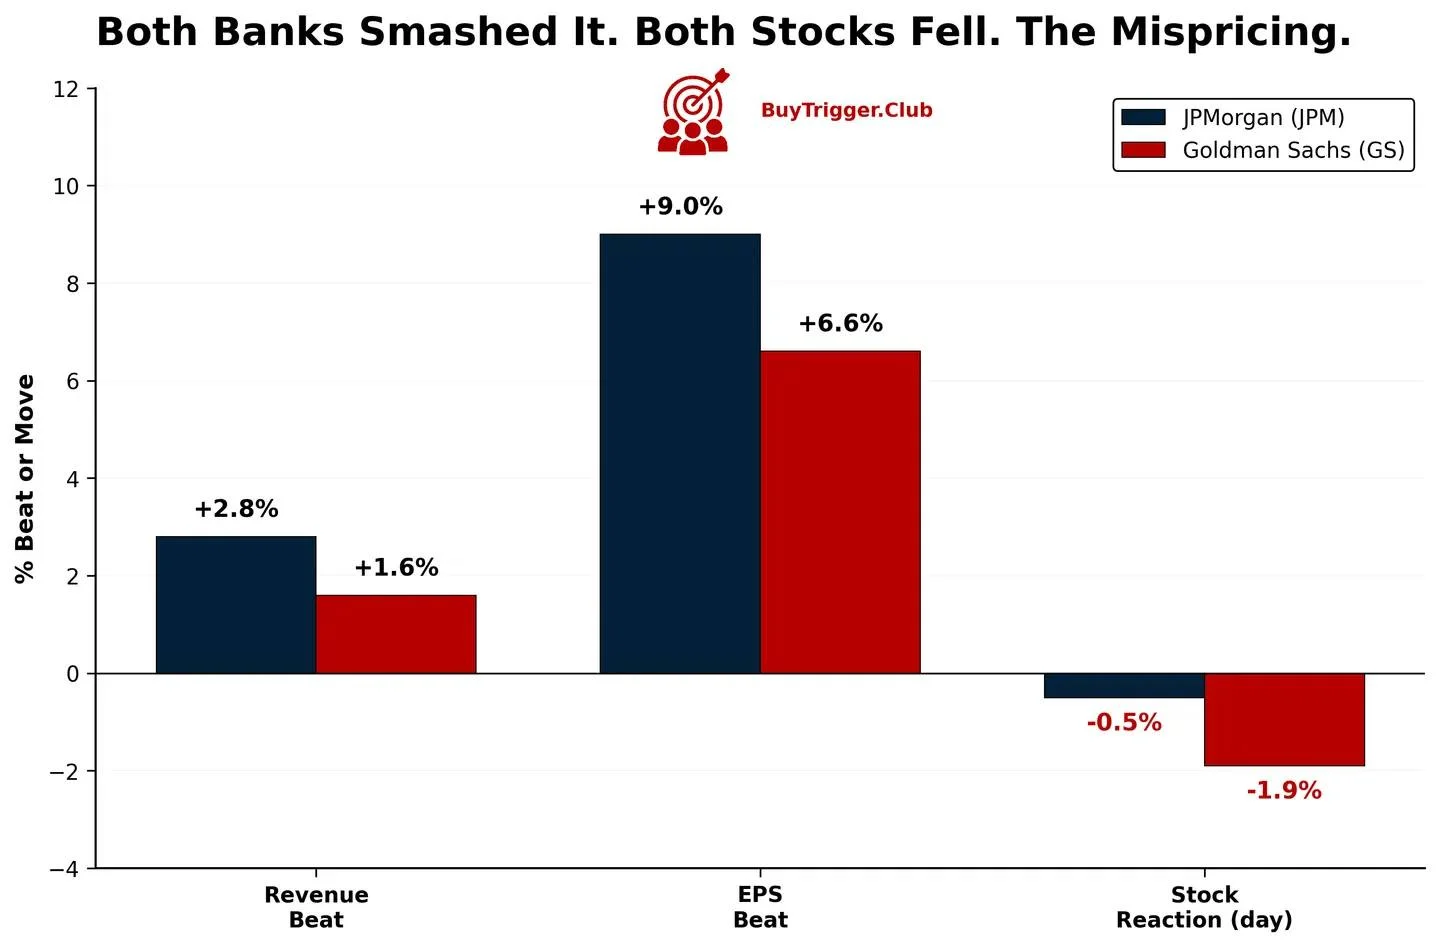
JPM and GS Beat Q1 Yet Stocks Fell—Mispricing Alert
$JPM and $GS just smashed Q1 2026. Both beat revenue. Both beat EPS. Both stocks fell. That's the kind of mispricing my system was built for. Full breakdown — what changed in my BuyTrigger system on both names: https://dralexkoh.substack.com/p/jpmorgan-and-goldman-sachs-just-became?r=4zq7nk
SPY Holds, But Shakeout Looms Ahead of Fed
A SHAKEOUT IS COMING & WHY OIL IS BACK ON WATCH 💌 VIP Mailing List: https://t.co/Rqp84Wg39F $SPY is still in a clean, powerful uptrend, holding above 8/21-day EMAs since early April. This “sequence” (higher highs + holding support) has created broad gains across...
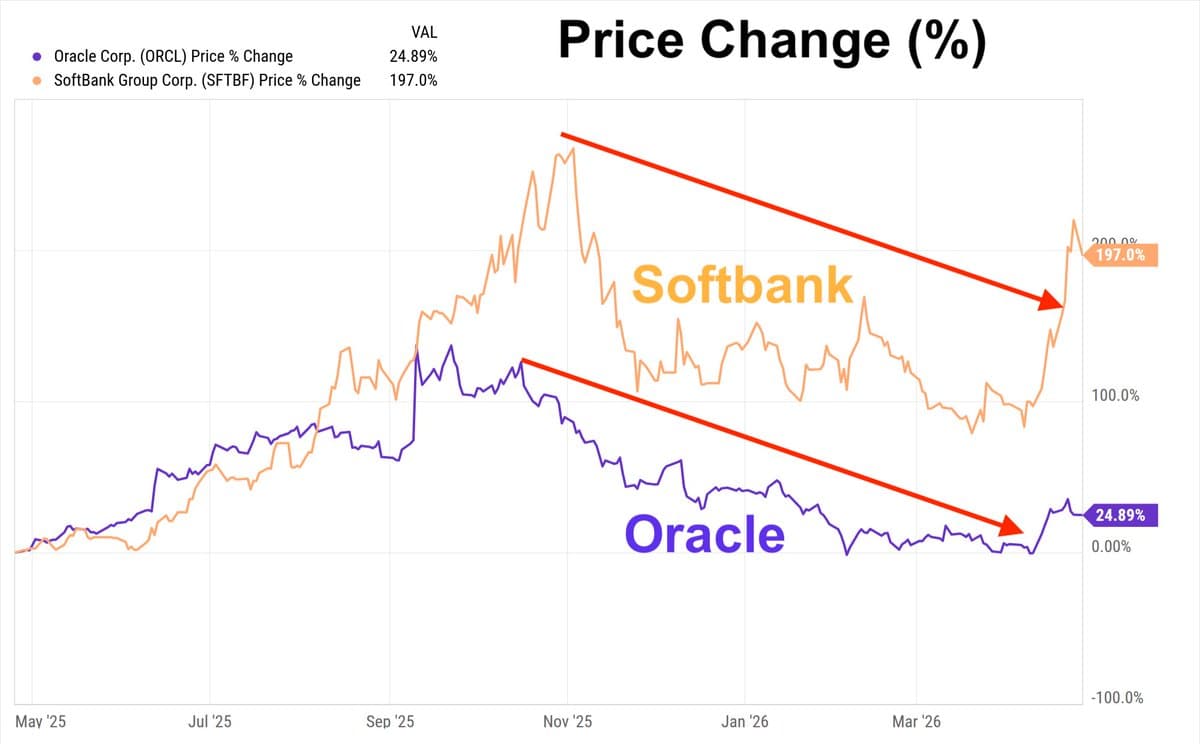
Market Anticipated OpenAI Struggles; Momentum Now Positive
Already known to informed market participants. Markets started pricing this ~5 months ago... Price momentum has turned positive over past 4 weeks https://t.co/Z1qNI2S8kW
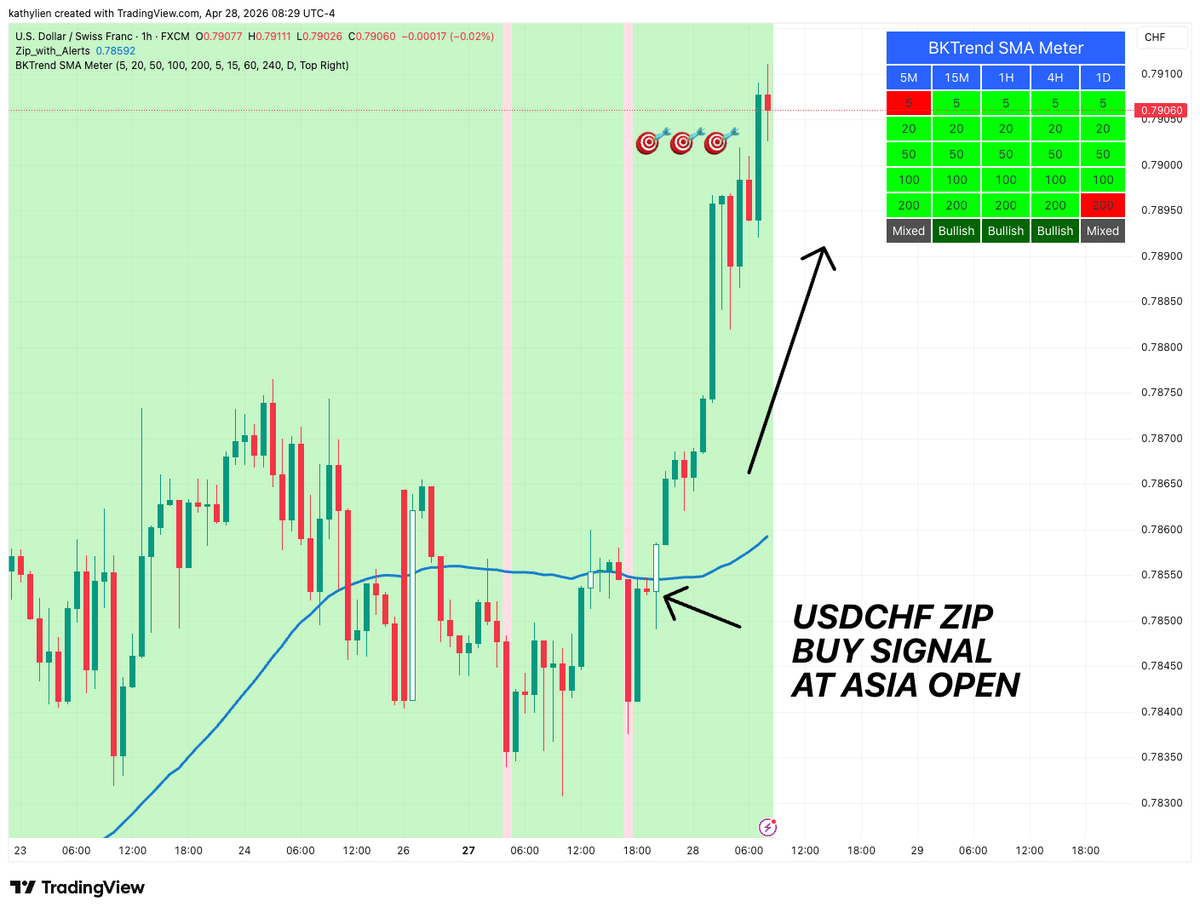
Waking Up to Profits with Smooth ZIP Trades
I ❤️ waking up to profits. Had 2 textbook ZIP trades last night - BUY Signal in USDCHF and SELL Signal in CHFJPY Smooth easy smooths with no pullbacks - that's what I like to see 🎯🎯🎯 What is ZIP? https://t.co/DJA8LNSCBa...
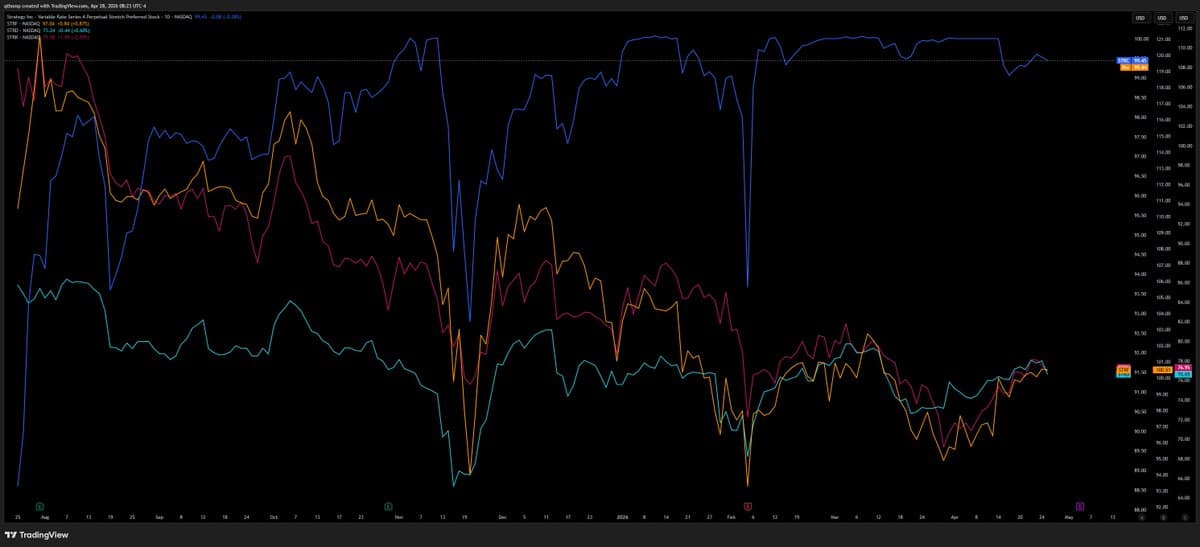
STRC’s Higher Dividend Skews Its Performance Profile
Strategy preferred complex with consistent lower highs. The only reason $STRC doesn't also look like that is because its dividend rate has been increased from 9% to 11.5% in 8 months since launch. $MSTR $STRC $STRF $STRD $STRK https://t.co/39u3MMZrM7
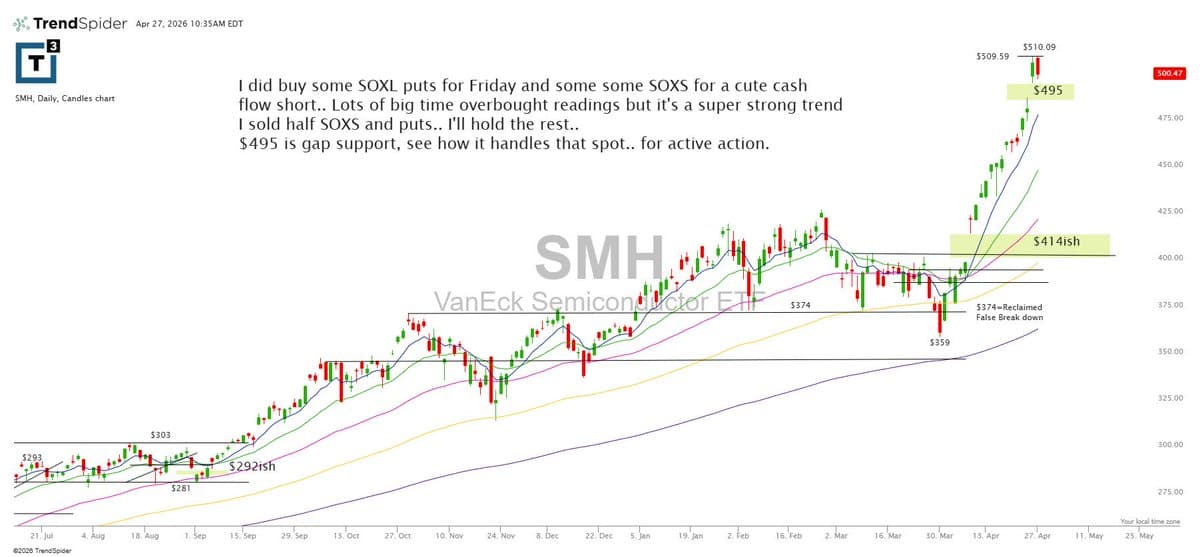
Bought Sox and SOXL Puts to Cover Trailer Longs
$smh filling that gap. I’m glad we bought some $Sox’s and $SOXL puts yesterday on the VTF. It will help. I still have some trailer longs to manage and see how today plays out https://t.co/4YpND0hPHG

Markets Pressured; GM Shines as Oil Drags
Markets under pressure from multiple fronts, with Open AI missing internal targets and Oil causing the brunt. $GM bucks the trend with strong EPS growth but already starting to sell, while $HOOD and $SBUX await their earnings after the bell. $IBIT...
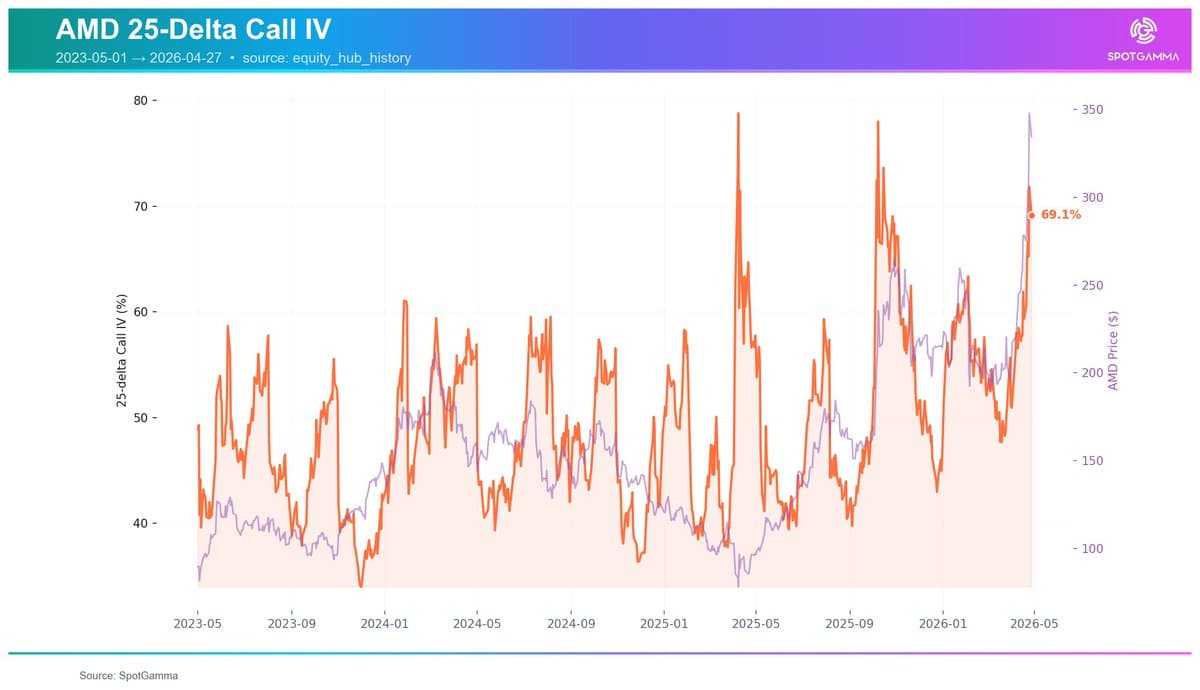
AMD Needs
You need a ~20% move in $AMD for the calls to pay off The stock is up 50% this month Oil is >100 but you are betting that the rate of change of semis continues as unhinged upside GL https://t.co/smohuP8jKm
Live Premarket Update: Redler Highlights NV
⏰ Scott Redler’s #630club - LIVE Premarket Stock Market Update ➡️ Free VIP List Newsletter: https://t.co/EW4O2nbz8N $NVDA $TSLA $IBIT $SNDK https://t.co/rkr3EsfFnw

Semiconductor Valuations Hit Record Highs, Prompting Shorts
On Friday and Monday we @SeabreezeLP shorted $INTC, $MU and $AMD. Go to @thestreetpro for an explanation why.... @dougkass Global Markets Investor on X: "⚠️Semiconductor valuations have RARELY been this stretched: The Semiconductor Index, $SOX, now trades at a P/E ratio of...
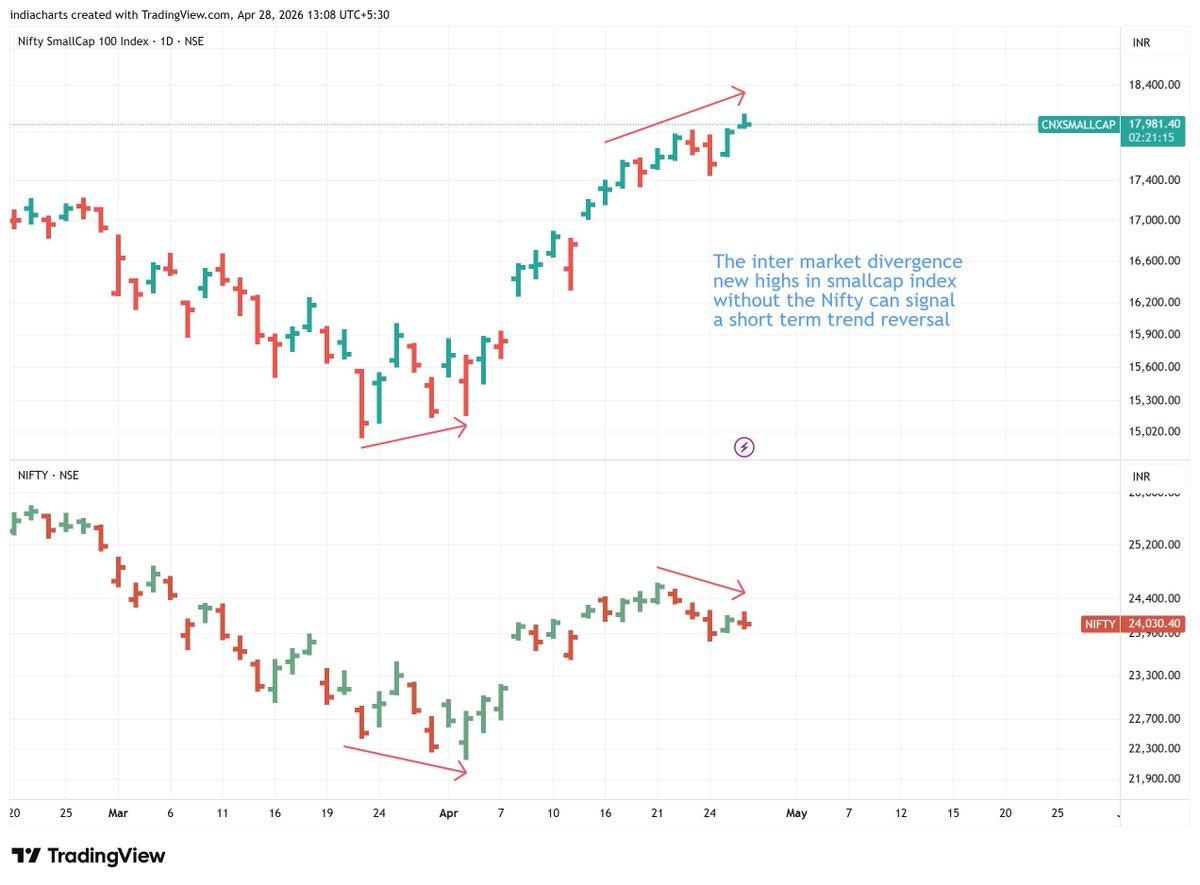
Nifty‑Smallcap Divergence Warns of Imminent Market Reversal
Spotting the critical divergence between the Nifty 50 and Nifty Smallcap 100 could be the key to anticipating the market's next big move. Discover why the Nifty's failure to confirm small-cap highs signals a potential trend reversal and how you...

Gold Poised Near 4650, Buy 4625, Target 4680
Macro: Gold compresses at 4650 pre‑FOMC; real yields stable, USD firm. Key factors: yields, USD, positioning. Risk: FOMC shock breaks range. Trade: buy near 4625, target 4680, stop 4600. — Viktor Kopylov, PhD, CFA. More insights: t.me/si14Kopylov
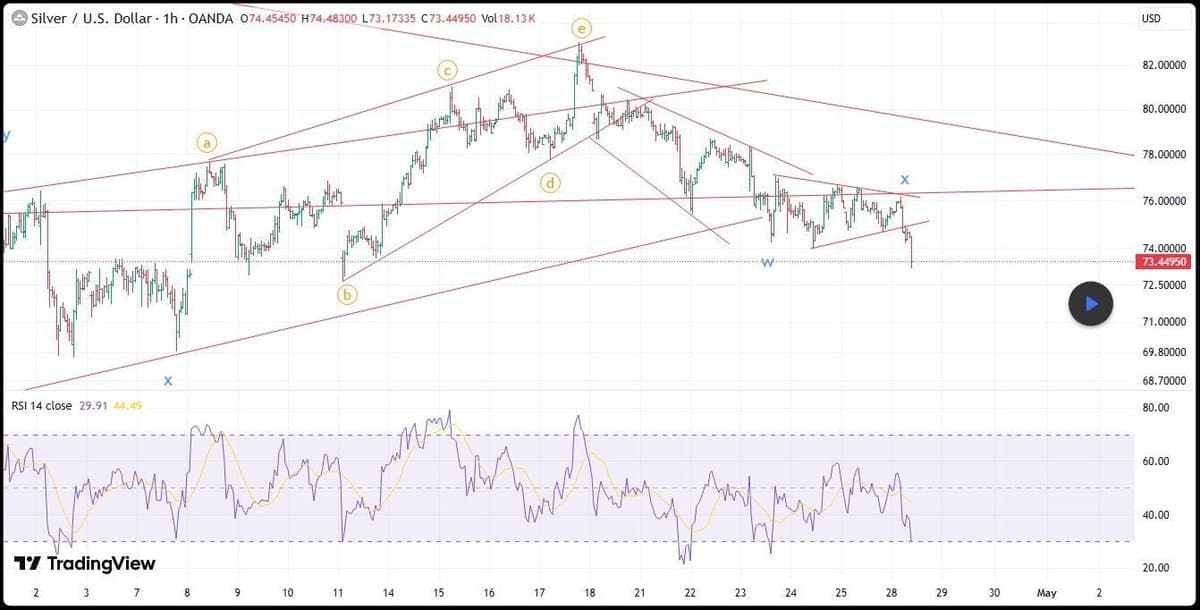
Silver Poised for Deeper Dip Below $70
Is Silver's bearish momentum here to stay? Our latest Elliott Wave and RSI analysis reveals why the recent downturn was predictable and suggests a deeper correction could drive prices well below the 70 or even 60 mark in the weeks...
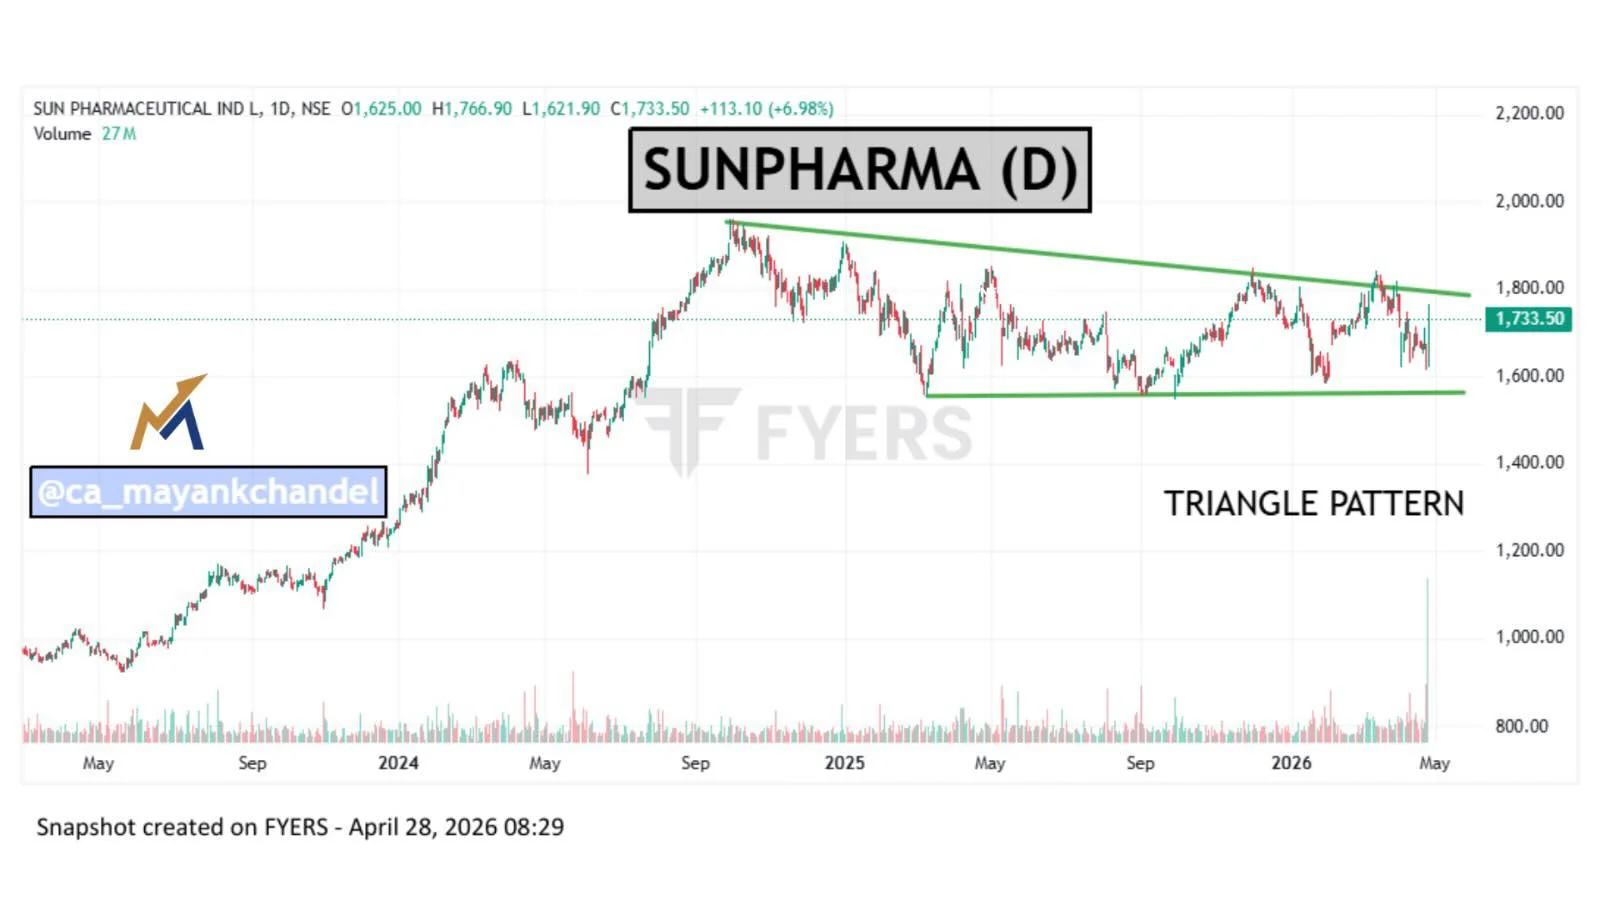
SUNPHARMA Poised for Breakout From Triangle Consolidation
#SUNPHARMA - Trading inside a triangle pattern - Consolidating before a potential move Keep it in your watchlist for a possible breakout opportunity 👀🚀 #BreakoutStock #StockToWatch
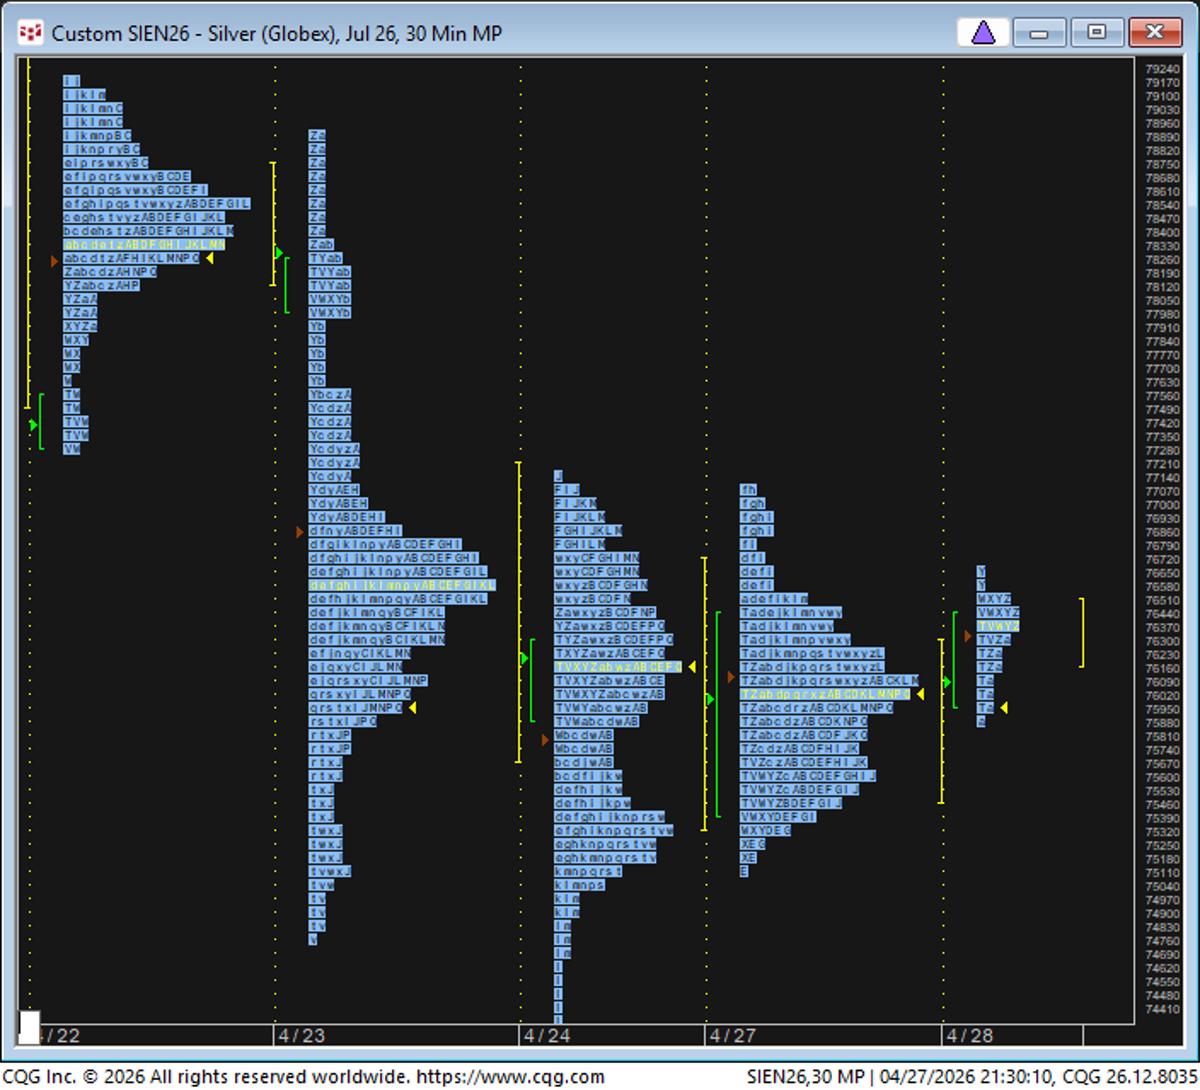
3‑Bar Triangle Signals Strong Move Beyond Overlap
This is what a 3 bar triangle looks like on a market profile chart off silver. When the market moves out of overlapping value areas like this, that is what leads to a more powerful move. https://t.co/5BsGdriJ9E

Nifty Holds 23,876 Support, Eyes 24,300 Breakout
Nifty Analysis And Prediction For Today 28 April 2026 By Rohit Srivastava | Indiacharts The Nifty 50 successfully defended its critical previous swing support at 23,876, keeping the overall market bias decidedly positive. The index is currently making another attempt...
3‑Bar Triangles Signal Breakout Mode Across Markets
NR7s in indexes, bonds, SI, CL and lots of 3 bar triangles. For those who don't get it, a 3-bar triangle = "breakout mode". And a breakout can happen in EITHER direction. Stay tuned.. https://t.co/GvA2maoF2J
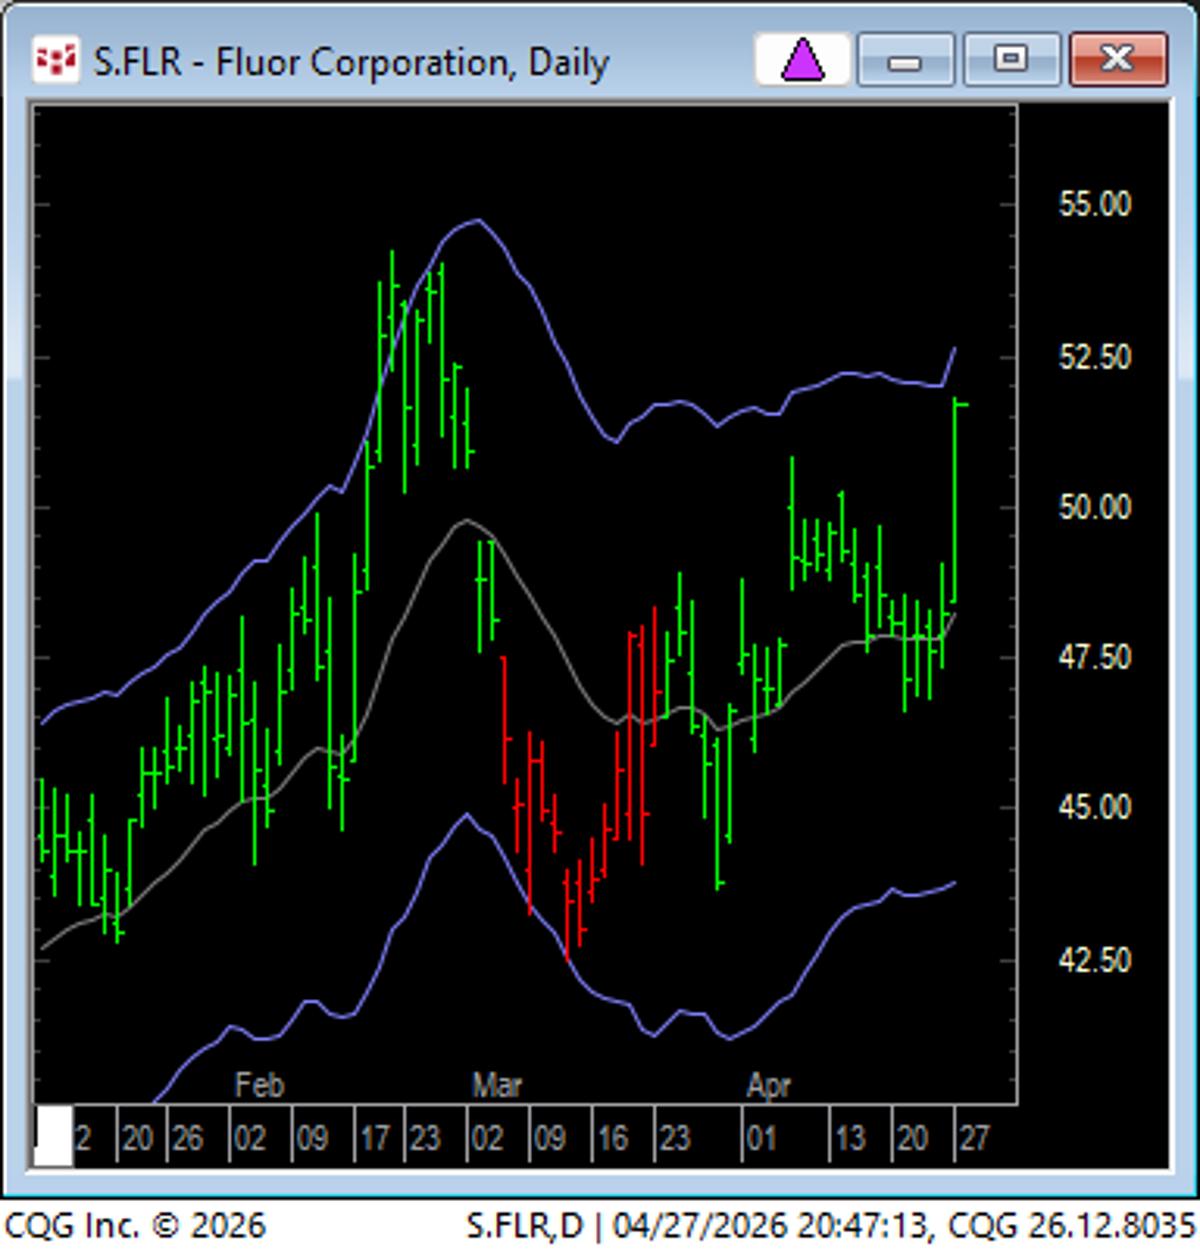
FLR Demonstrates Ideal Wide-Range Reversal Buy
FLR saying "this is how it's done"! Kyle brought this to my attention when it made a wide range reversal buy. https://t.co/QhY2zKJGbp
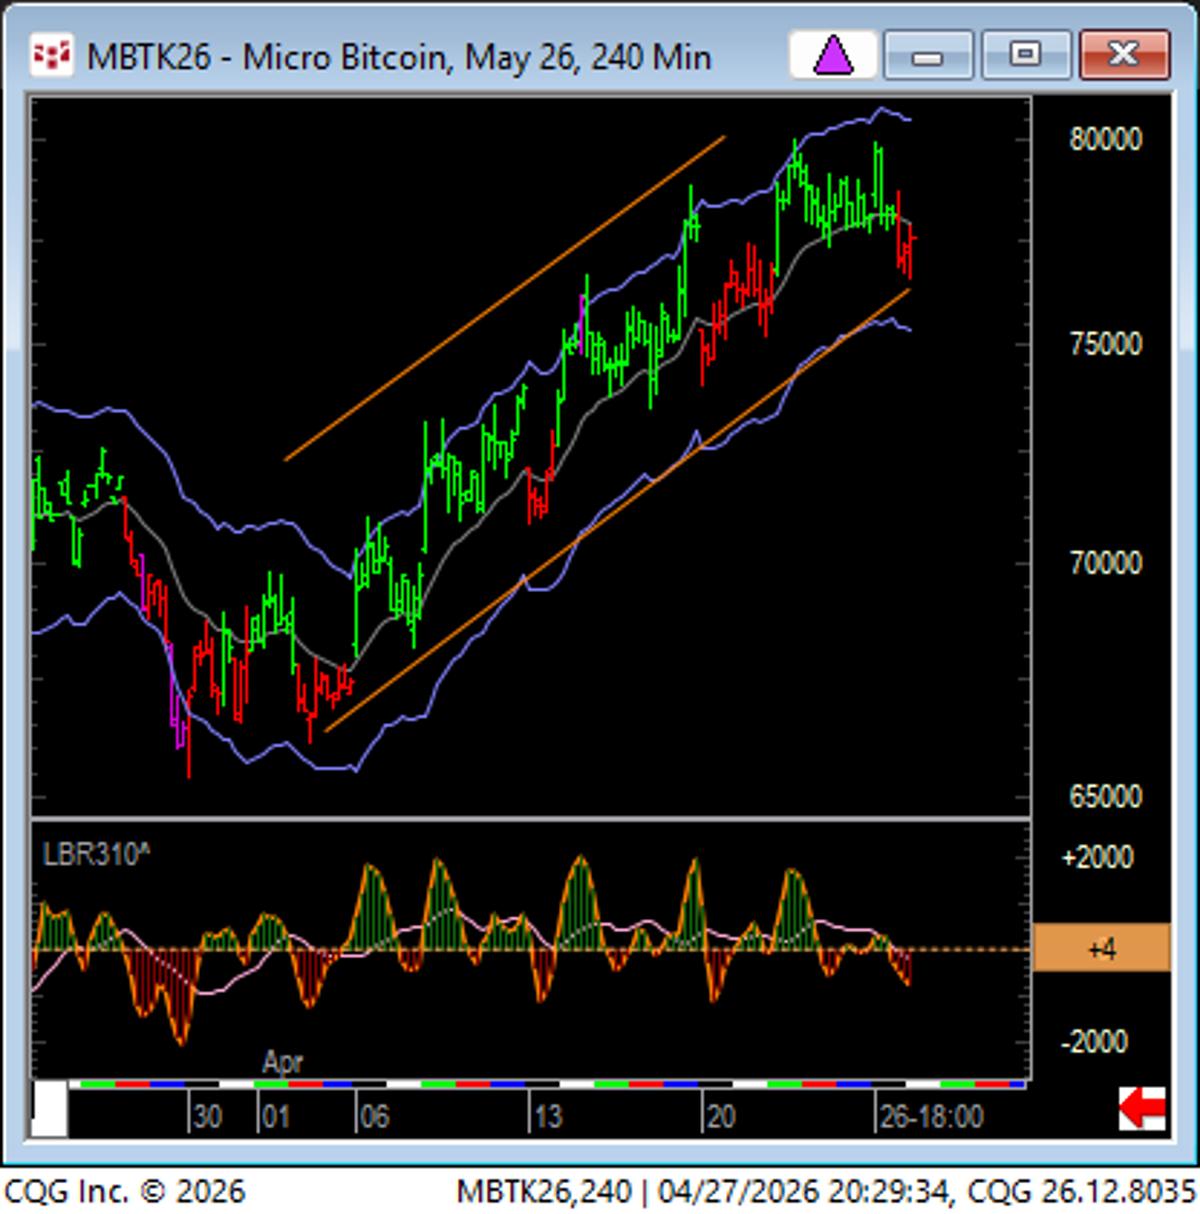
Bitcoin Pulls Back Yet Bullish Channel Remains Intact
BTC - late in the game pullback but channel still intact. It's holding its upside BO area. :-) https://t.co/no3puyIfLq
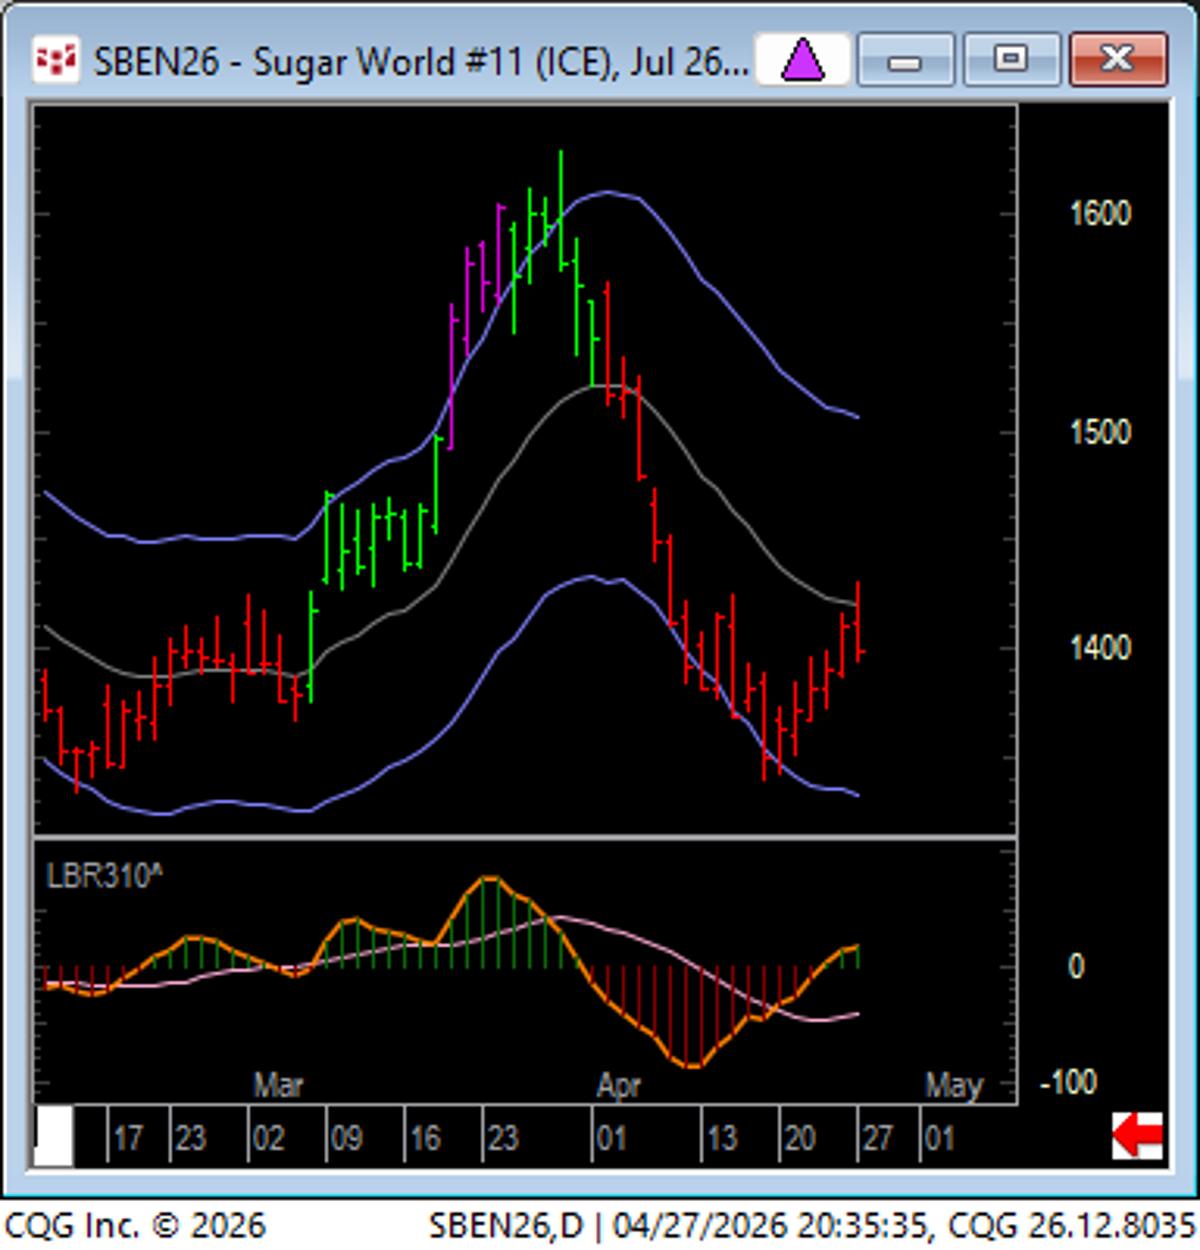
Sugar Faces Technical Resistance at Daily EMA
Sugar hit resistance at daily EMA...Note how technical the resistance was - right at start of single prints as well as previous congestion area. https://t.co/Prpw7U8rzz
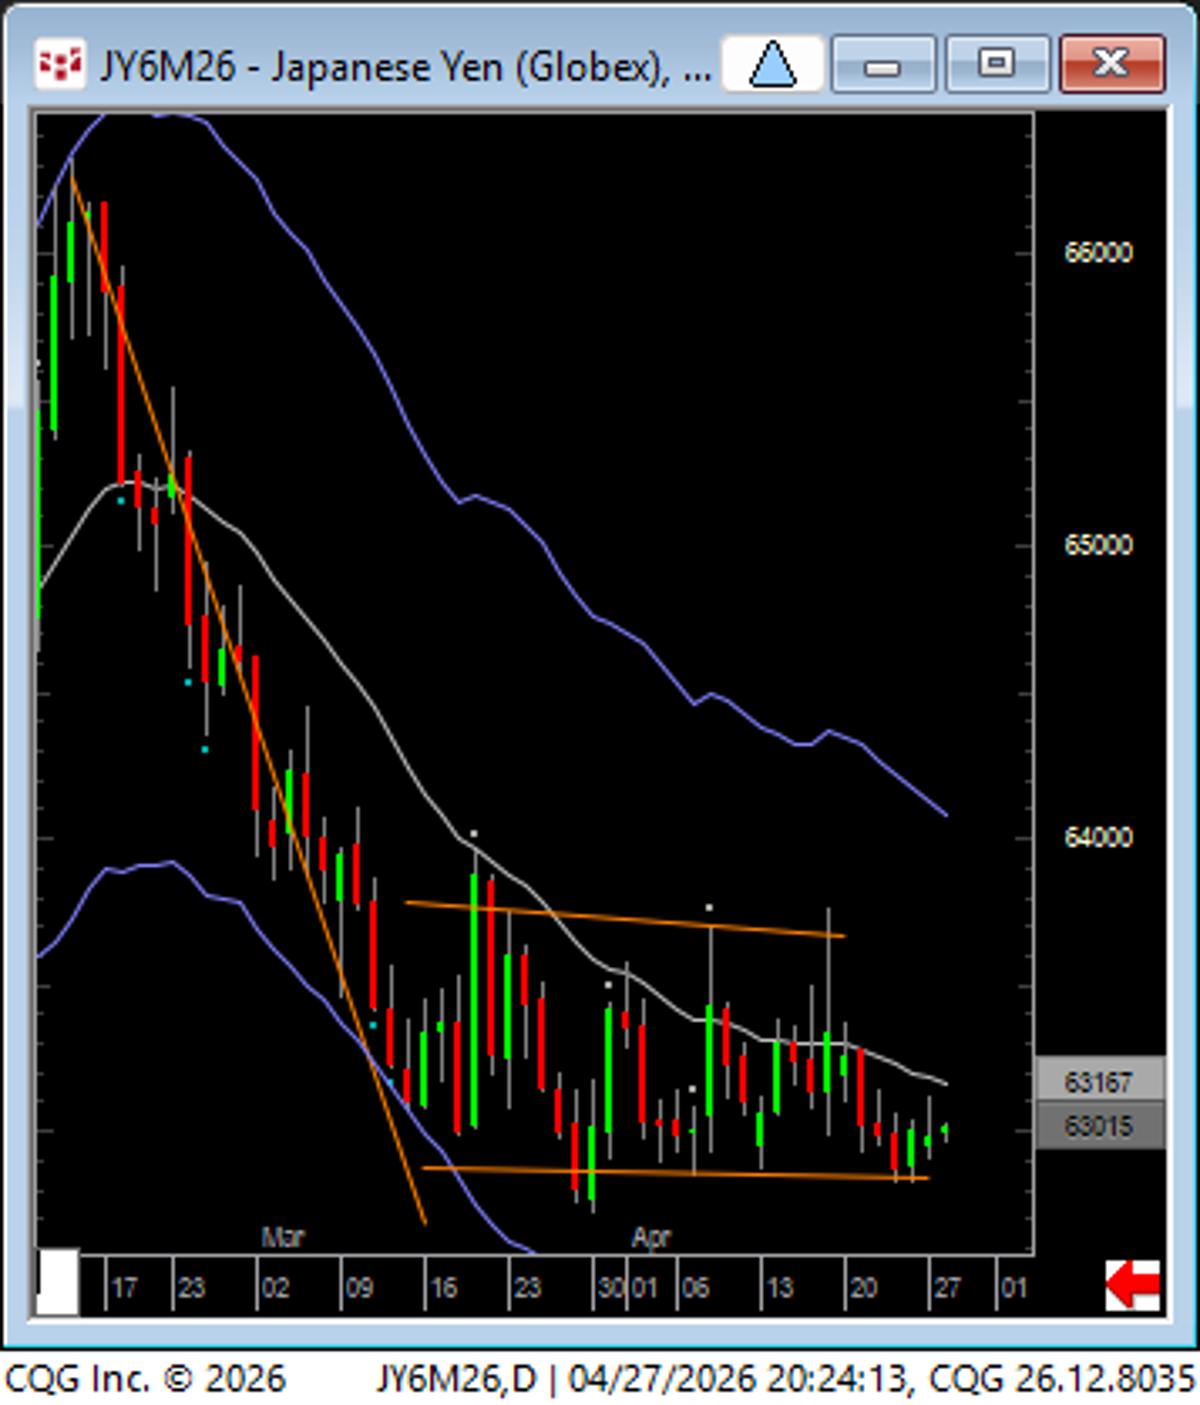
Yen Enters Bracketing Mode, Expect Whipsaws and False Breakouts
Yen: "Price equals Time". After a large STD move, the market consolidates in "bracketing mode", which suggests multiple whipsaws and false breakouts. https://t.co/hcp55m124r
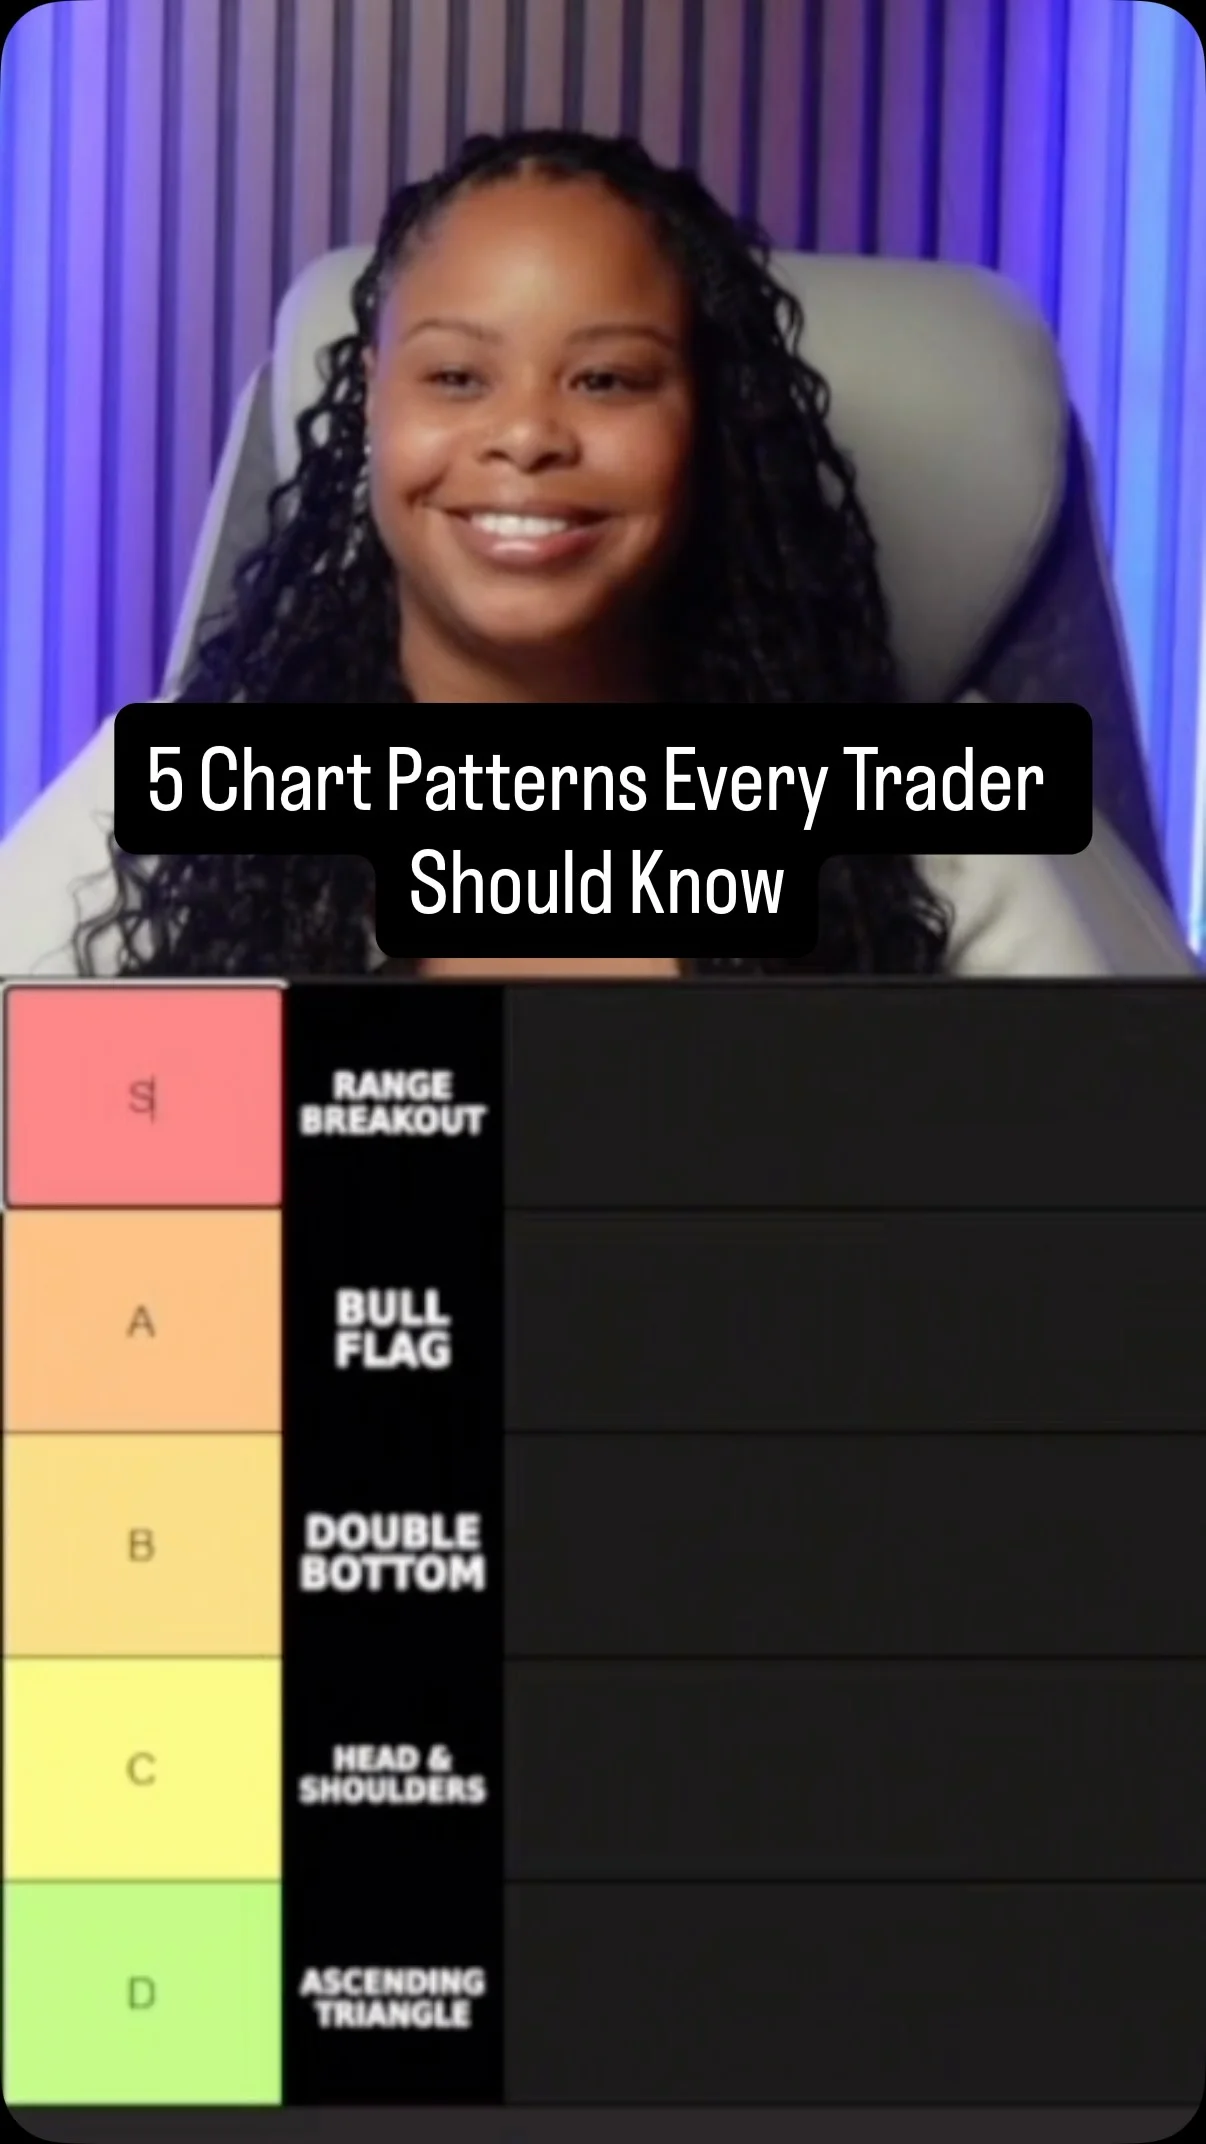
Chart Patterns Need Structure, Confirmation, Not First‑Touch Entries
If you trade and don’t understand these, you’re guessing. Double bottom, head and shoulders, bull flag, ascending triangle, and range breakout. These patterns show trend continuation, breakout setups, and reversals. But the pattern alone isn’t the trade. You need market...
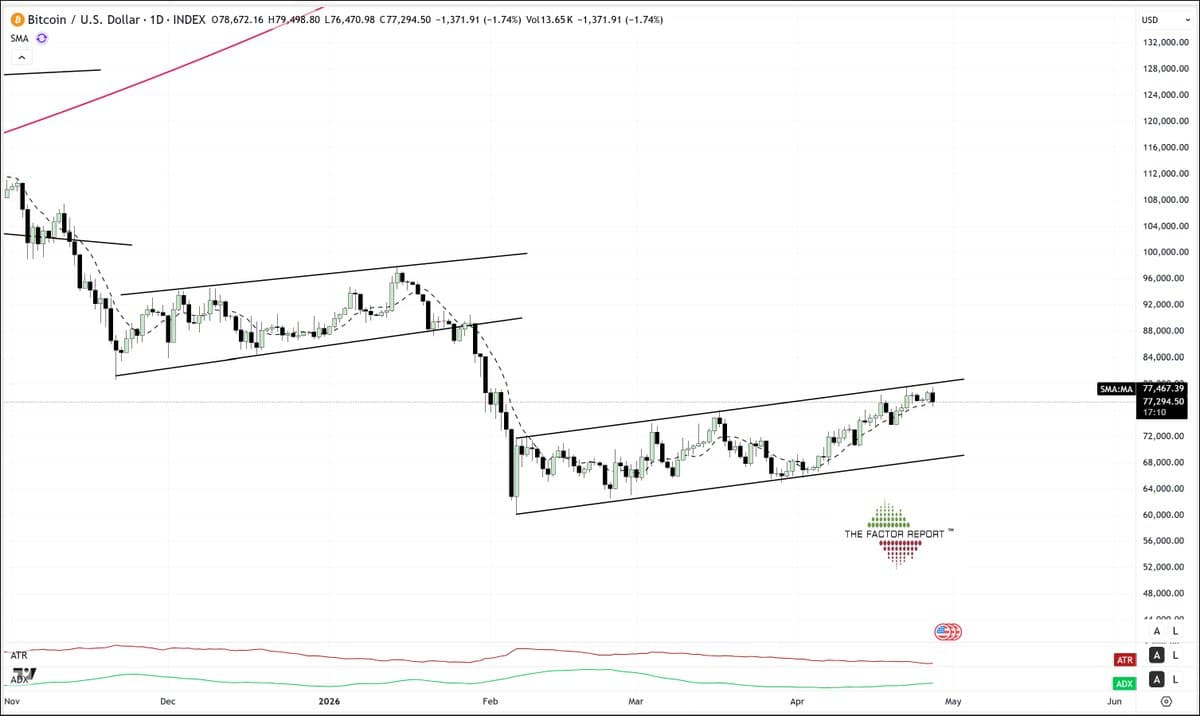
BTC in Channel, Not Bullish Bottom—$250k Hype Premature
Bitcoiners Those of you predicting $250,000 in 2026 need to stop with the mushrooms This is called a channel $BTC While it does not preclude further price gains, it is NOT a bullish bottoming pattern The Factor Report reports on classical chart analysis https://t.co/6nRit1xsVp...
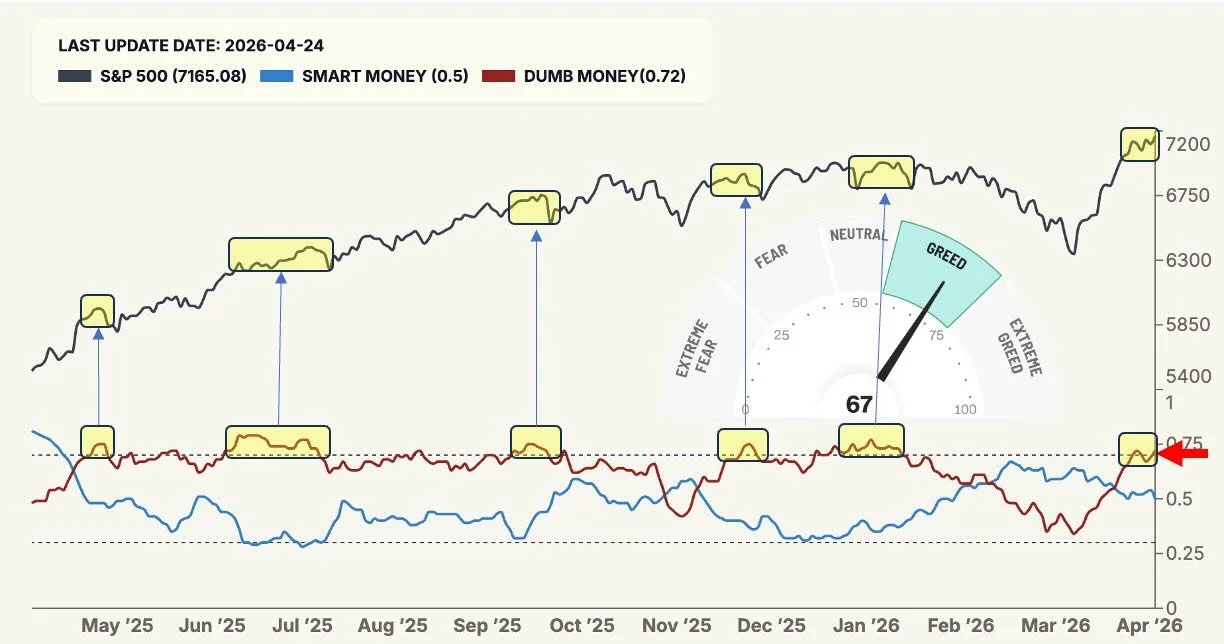
Dumb Money Extreme Optimism; Expect Pullback Despite Greed
SPX: Dumb Money Confidence has entered the Extreme Optimism zone, a level that historically coincides with index consolidations or healthy pullbacks. Furthermore, the Fear & Greed Index sits at 67 (Greed), while Smart Money Confidence is neutral ahead of major...
S&P Hits Record Highs Amid Weak Market Breadth
New all-time highs on the S&P 500, and breadth still won't confirm. NYSE advance-decline line is below its 13-week cumulative average, an entire quarter of narrowing participation. Time will tell.
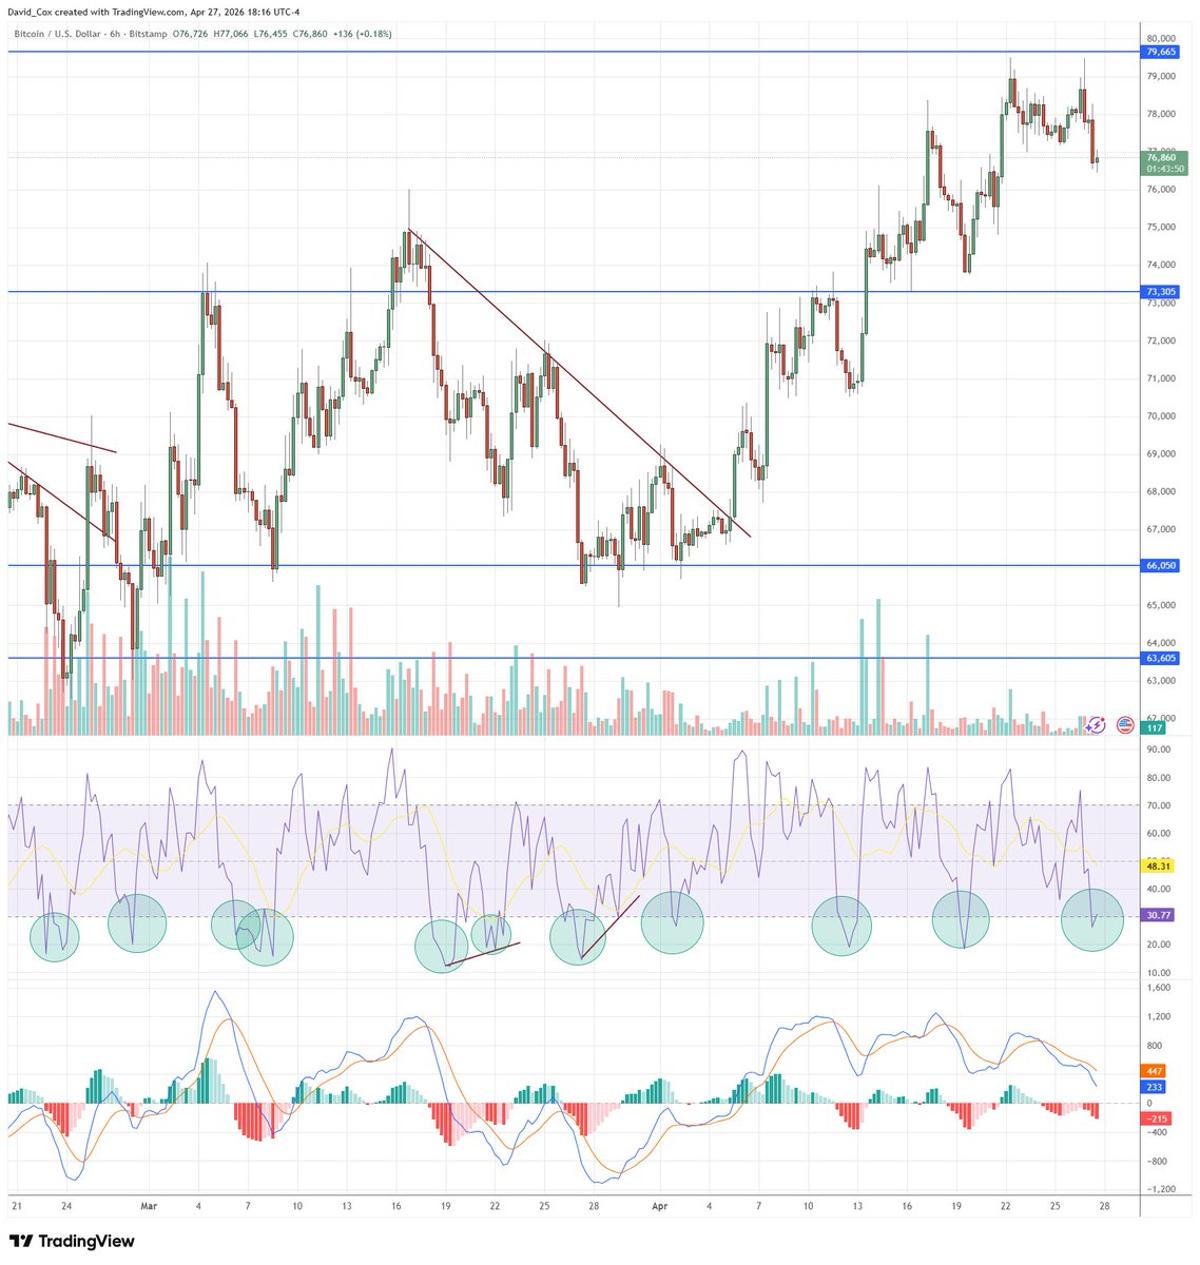
BTC RSI(5) Oversold on 6‑Hour Chart at $76.9K
Bitcoin #BTC $BTCUSD is RSI(5) oversold on the 6-hour chart for the first time since the ~$73.5Klevel... currently sitting $76,860... https://t.co/2CV8FPy47x
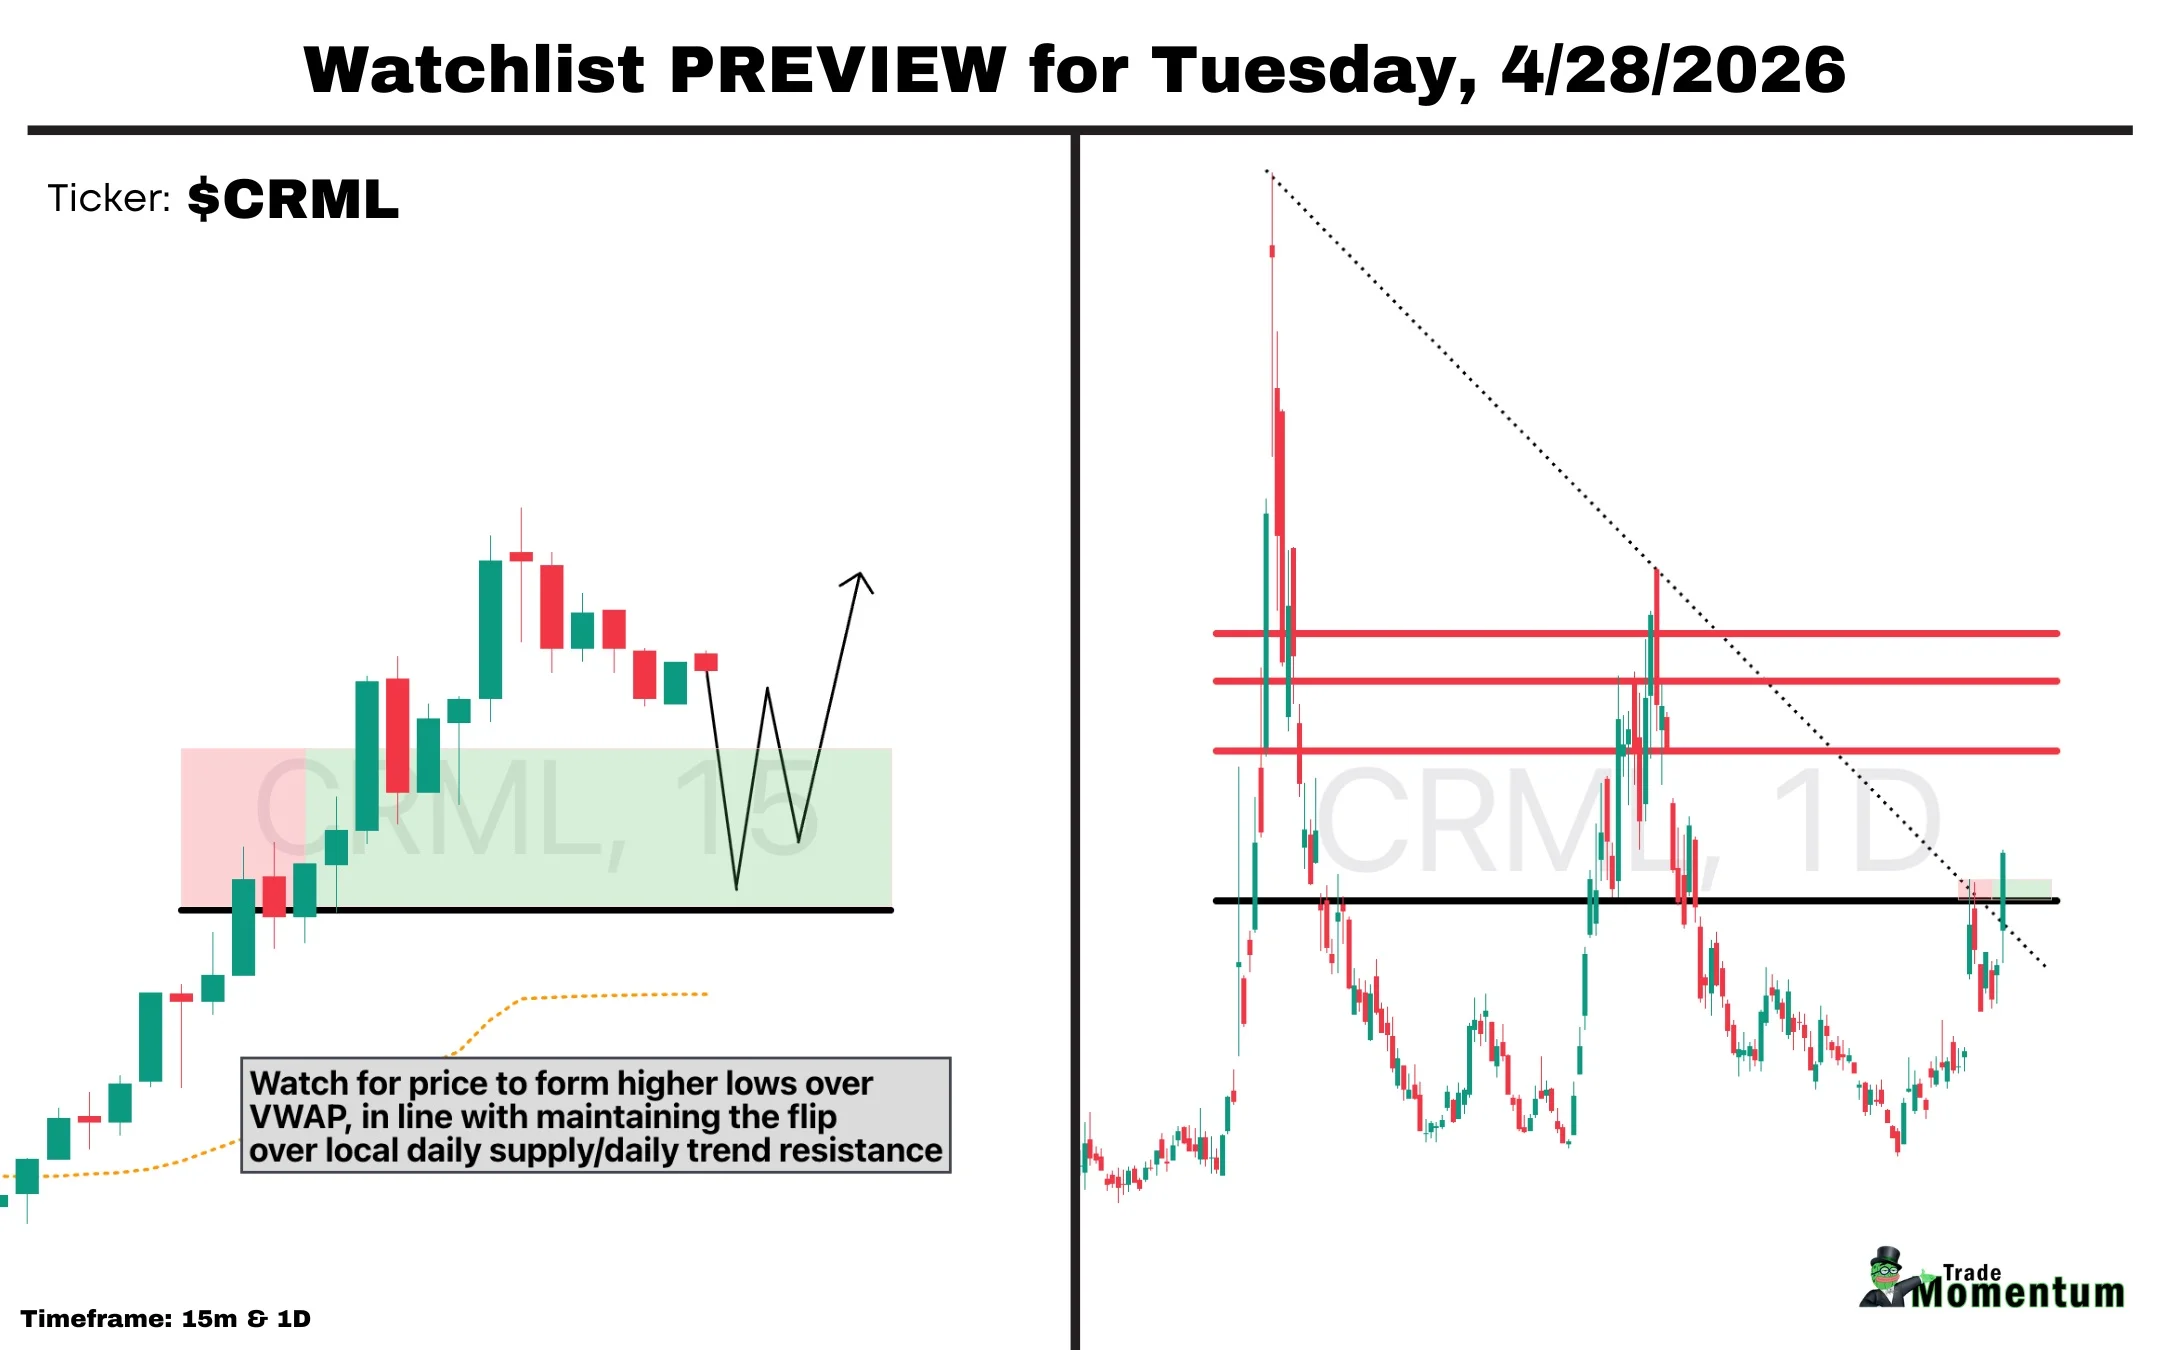
Critical Metals Secures European Lithium, Targets $20 Rally
$CRML - "Critical Metals to buy European Lithium in $835M deal, taking full Tanbreez ownership" WOW, this daily chart looks good. Super high confluence setup here over that key 13 spot, and if we see higher lows forming over it in...
FTSE250 Doji Signals Caution Near Support, Bullish EMAs
#FTSE250 doji Candle. Support 22087, 21557, 21000. Resistance 23231, 23844. RSI 53 just off Neutral. 13/21 day EMAs Bullish. Top Bollinger Band 23193. Midpoint Line 22811. Bottom Band 22440.
S&P 500 Futures Breakout, Yet Internals Signal Weakness
S&P 500 futures hit 7,211 today on a breakout, but the internals are concerning. Areas of concern that the bears will point out are light volume on up-days and open interest declining into the rally. Looks a little more like...
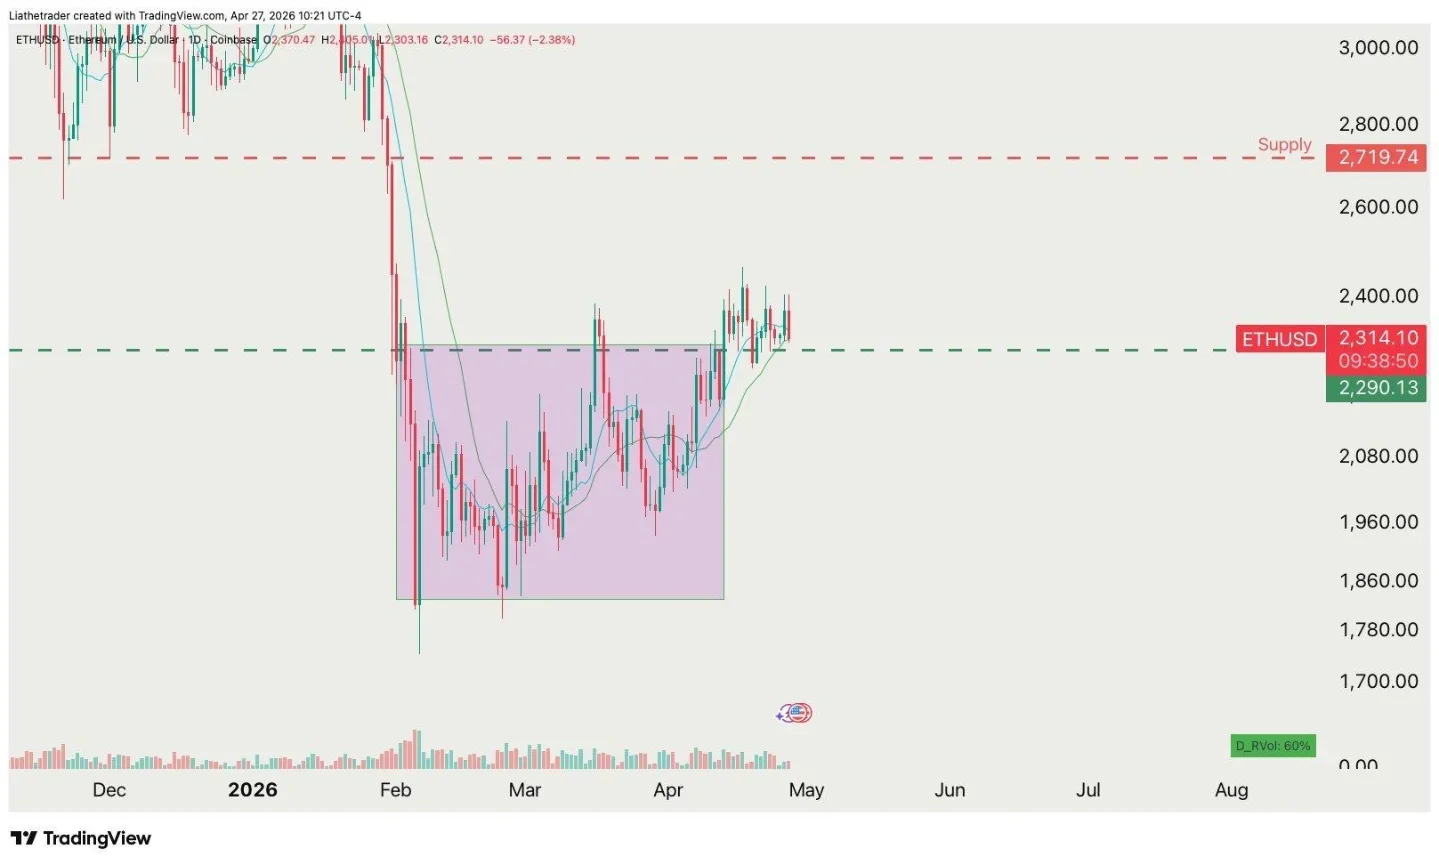
Ethereum Aims Above $2,290, Targeting $2,719
Ethereum — the plan hasn’t changed. Hold above $2290. Target: $2719. Simple levels. No noise.

DAX Consolidates Near Resistance, Bullish EMAs Signal
#DAX doji Candle and Sideways. Resistance 24792. Support 23482, 23000. RSI 54 near Neutral. 13/21 day EMAs Bullish. Top Bollinger Band 24607. Midpoint Line 24225. Bottom Band 23832.
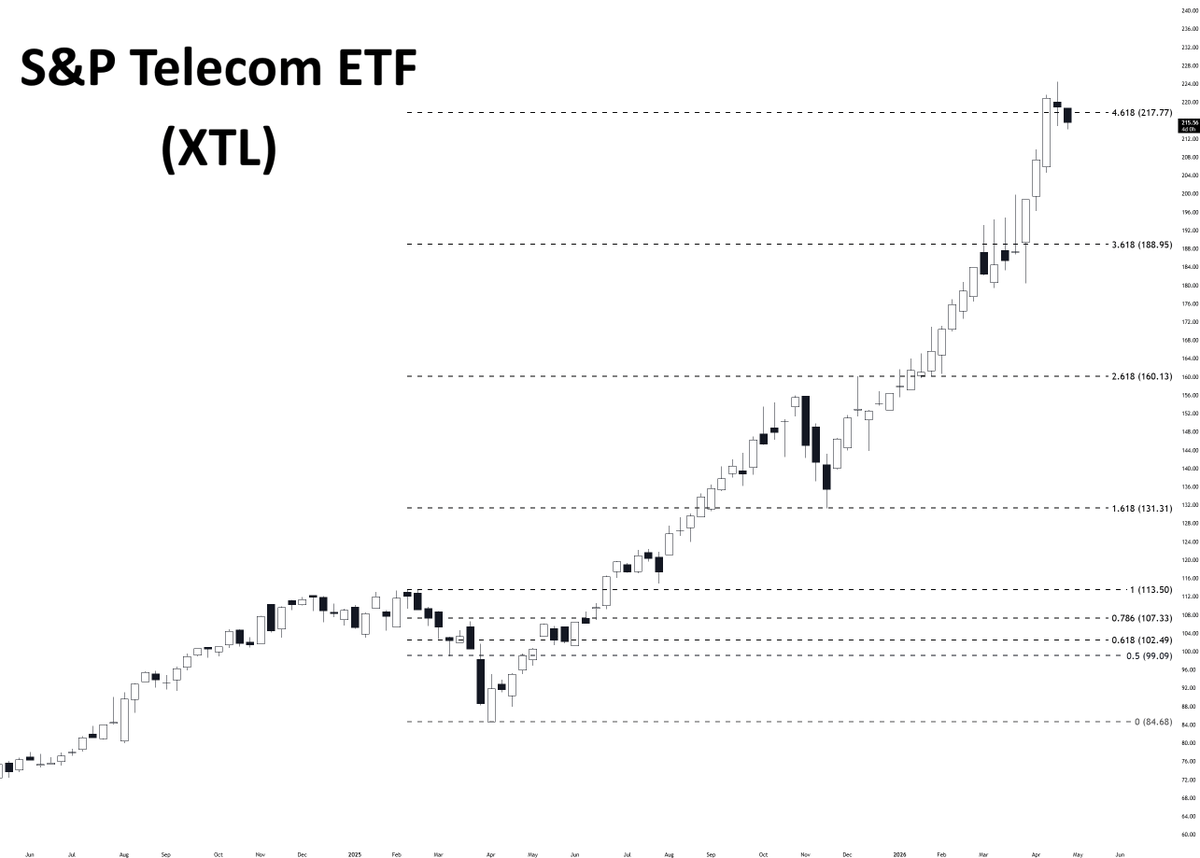
XTL Telecom Stock Soars
What a run by telecom… Said no one ever. Now trading at the 461.8% extension of the 2025 high to low. $XTL https://t.co/FVGJ4ZhiTl

ERAS Slides 10
$ERAS -10% AH. Reason(s), anyone? Chime in, please. Sell the news, or red flag in the data?

FOMC Looms, Charts Messy; I Scalp Through
Charts slick sucked today but it's expected with FOMC coming up. I scalped my way through
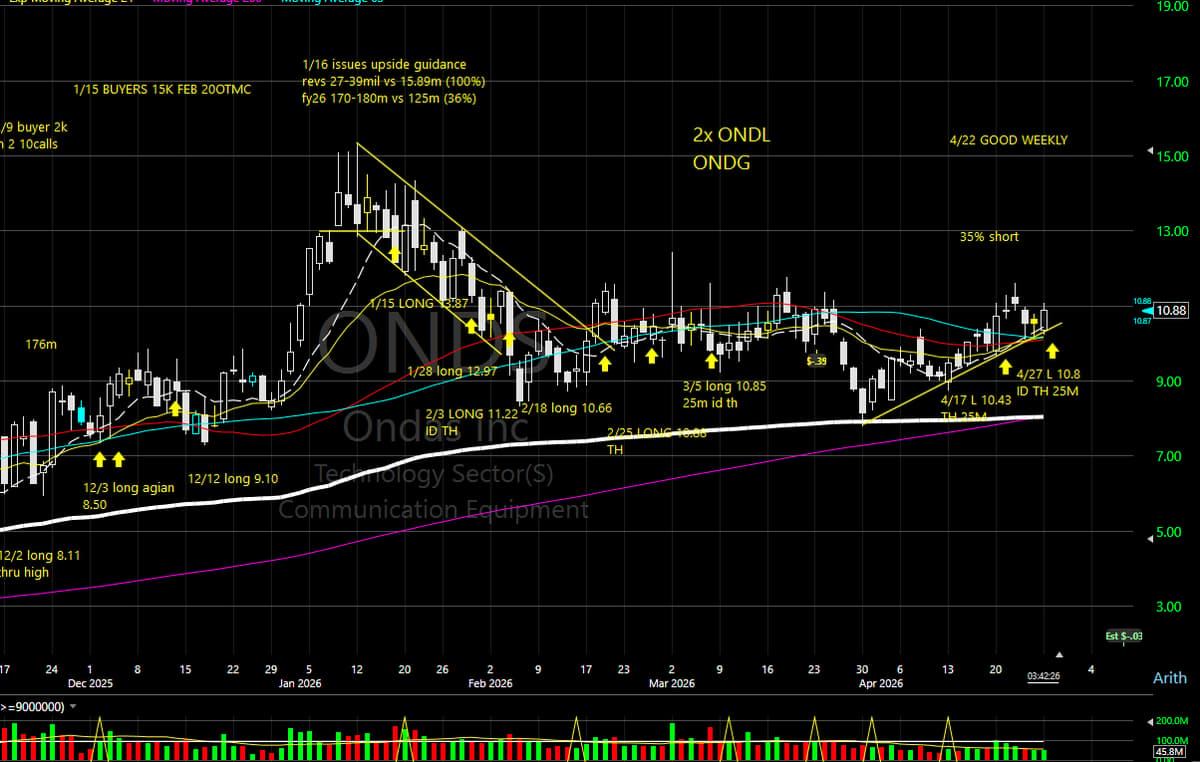
Shorted Stock $ONDS Meets All Criteria, Ready to Trade
$ONDS hit my radar last night. Checked a lot of boxes. • Since mid-April, I've been focused on heavily shorted stocks ✅ • Printed an inside day — under this context, actionable through the inside day high ✅ • Weekly chart aligned ✅ •...
NVDA Breakout Continues: Let It Ride
$NVDA nice mover since the end of March. Breakout on Friday with follow thru today. Moved up all let it ride stops.