Market Set to Erase Gains, Hit New Yearly Low
Unpopular opinion: the market next week will not only give back last week’s gains, but make a new low for the year. Fucked.

EchoStar Poised for Swing Trade Breakout Next Week
EchoStar is our favorite swing trade idea for next week. Lifting out of its base on Friday after a sluggish start to the week. The way we're trading it in the chart below and more details shared in the video: Watch...
All Major Tech Indexes Hit Record Highs This Week
The Equally-weighted Technology Index Fund (RSPT) just closed the week at the highest level in history. The S&P600 Small-cap Tech Index just did the same thing. So did the S&P400 Mid-cap Tech Index. So did the Market-cap Weighted AND the...
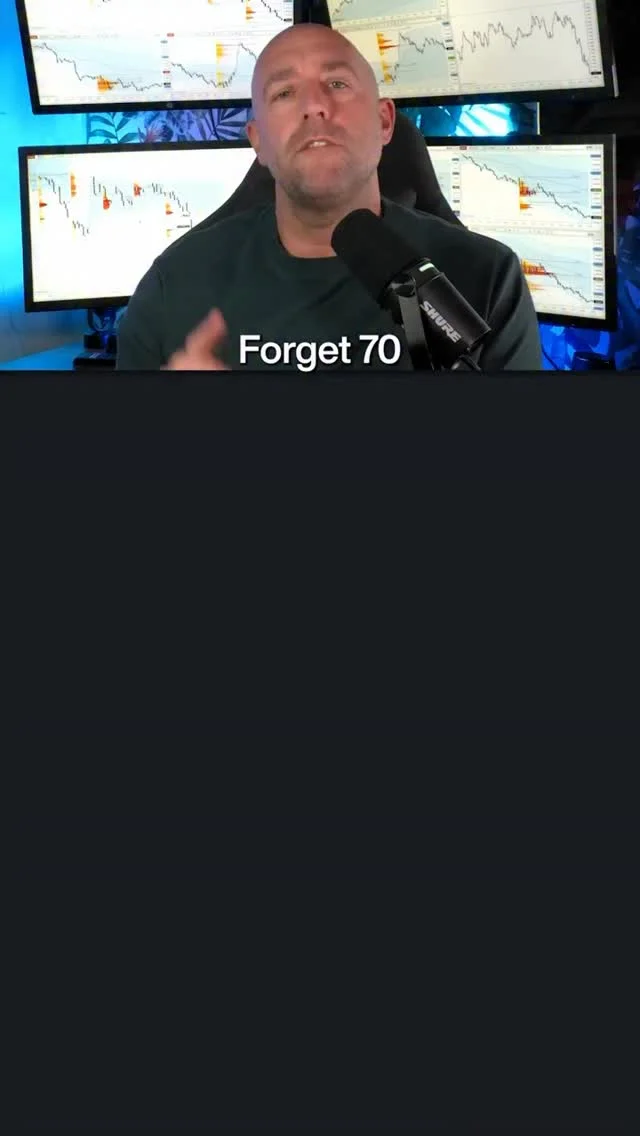
Ditch Classic RSI; Use Real‑Trend Indicator for Better Signals
Forget RSI 70/30. That’s retail thinking. 🚫 In real trends, RSI stays extended… and in ranges, it fakes you out. Use THIS instead 👇 Which one do you struggle with more? 1️⃣ Fading extremes (keep getting trapped) 2️⃣ Trend pullbacks (keep missing moves) Comment your number...

Druckenmiller: Use Liquidity, Not Valuation, to Time Markets
“I never use valuation to time the market. I use liquidity considerations and technical analysis for timing. Valuation only tells me how far the market can go once a catalyst enters the picture to change the market direction.” — Stanley Druckenmiller...

Scale Small, Add Only to Winning Trades
Macro: markets favor trend & momentum; drivers: liquidity hunts, news pauses; risks: oversized entries, tight stops, averaging down. Trading insight: scale in small and add only to winners. — Viktor Kopylov, PhD, CFA. More insights: t.me/si14Kopylov
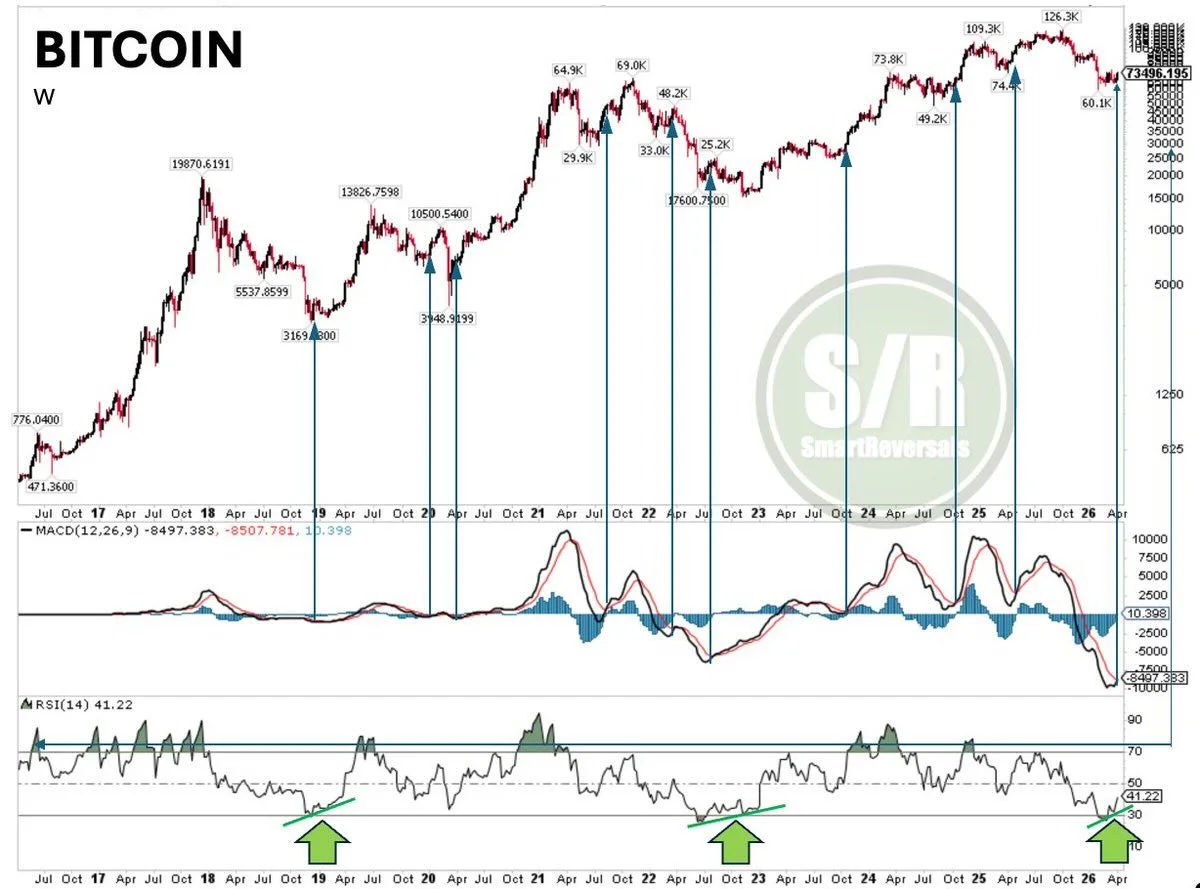
MACD Crossovers Plus RSI Divergences Boost Bitcoin Bullishness
#BTC: MACD crossovers have been a reliable bullish signal during the last three years. Occurrences before 2023 have preceded mixed outcomes. However, when combined with RSI divergences, the bullish thesis strengthens exponentially. #Crypto #Bitcoin #ETH

Leveraged ETFs Require Active Timing, Not Long-Term Holding
Leveraged ETFs designed for trading, not holding. Compound losses during downtrends. Early 2X XRP ETF buyers currently underwater holding. Timing required. Many investors disqualified by advisors from leverage products. Volatility demands active management.
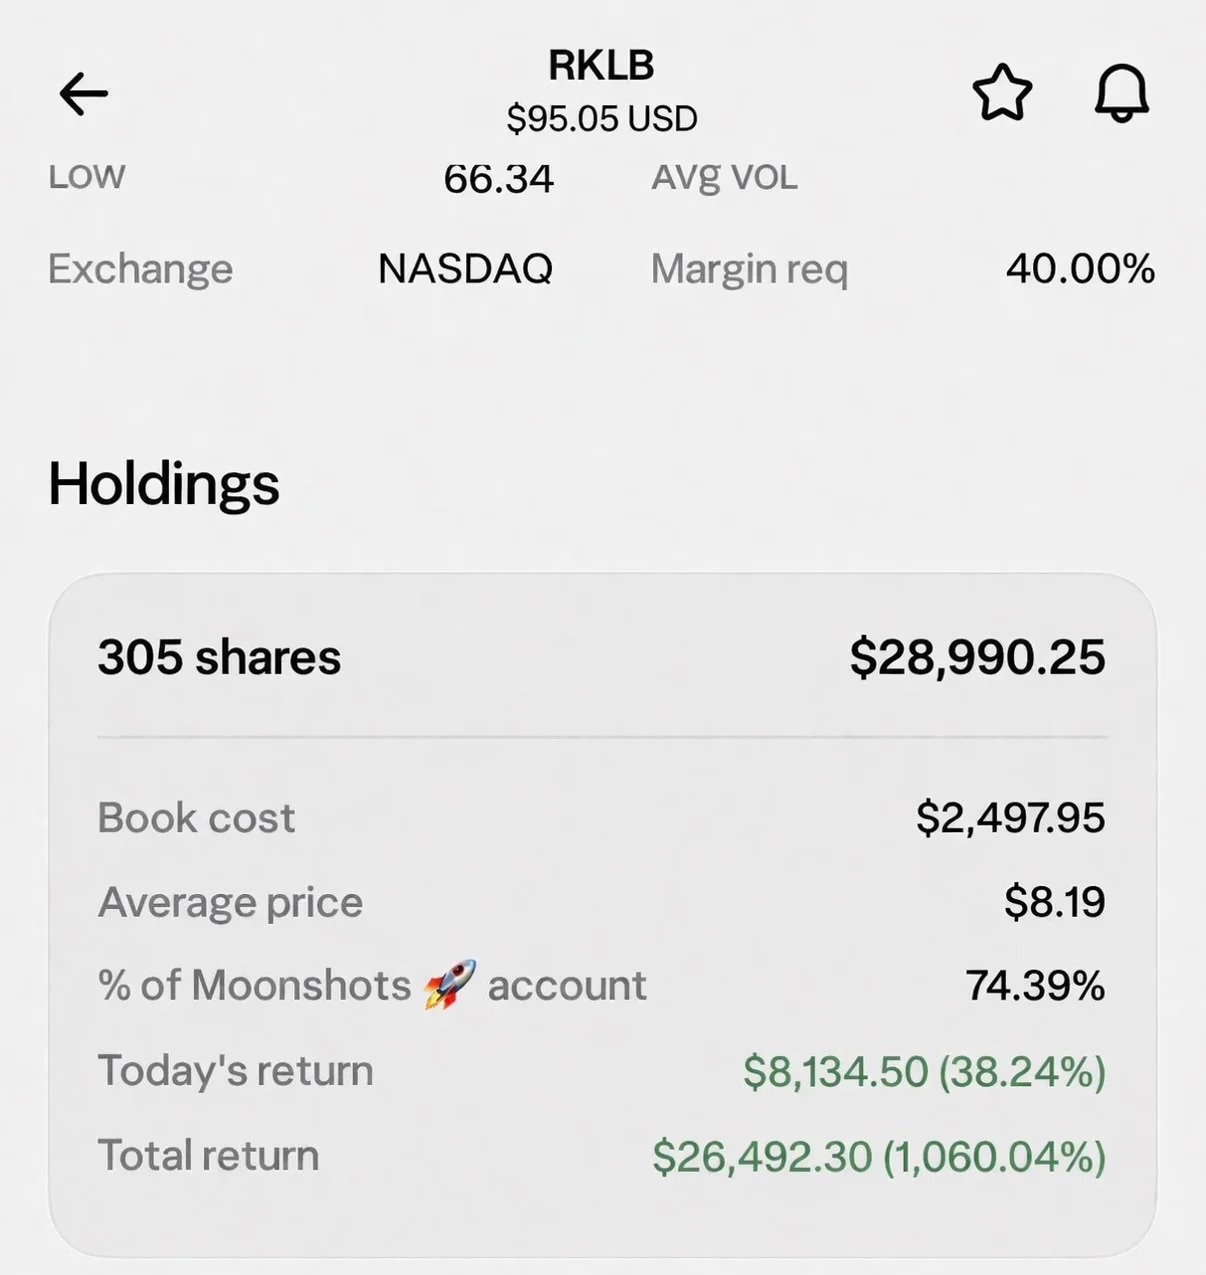
Turned $8.19 Into 11x, Eyeing $65 Re‑entry
Bought 305 shares of $RKLB at $8.19. Sold 75% of my position for a 11x… and now I’m seriously considering buying back in at $65. With a Space X IPO this trade isn’t over

Avoid Shorting: Risks Outweigh Potential Gains
Why I don’t short stocks.. and why you shouldn’t either. #howtotrade #daytrading #momentum #tradingeducation #stockmarket

Puell Multiple Green Dip Signals Bitcoin Bear Market Bottom
Every bear market the Puell Multiple dips into the green bottoming zone That always corresponds to the #BTC bear market bottom https://t.co/iaL3F4lHEr
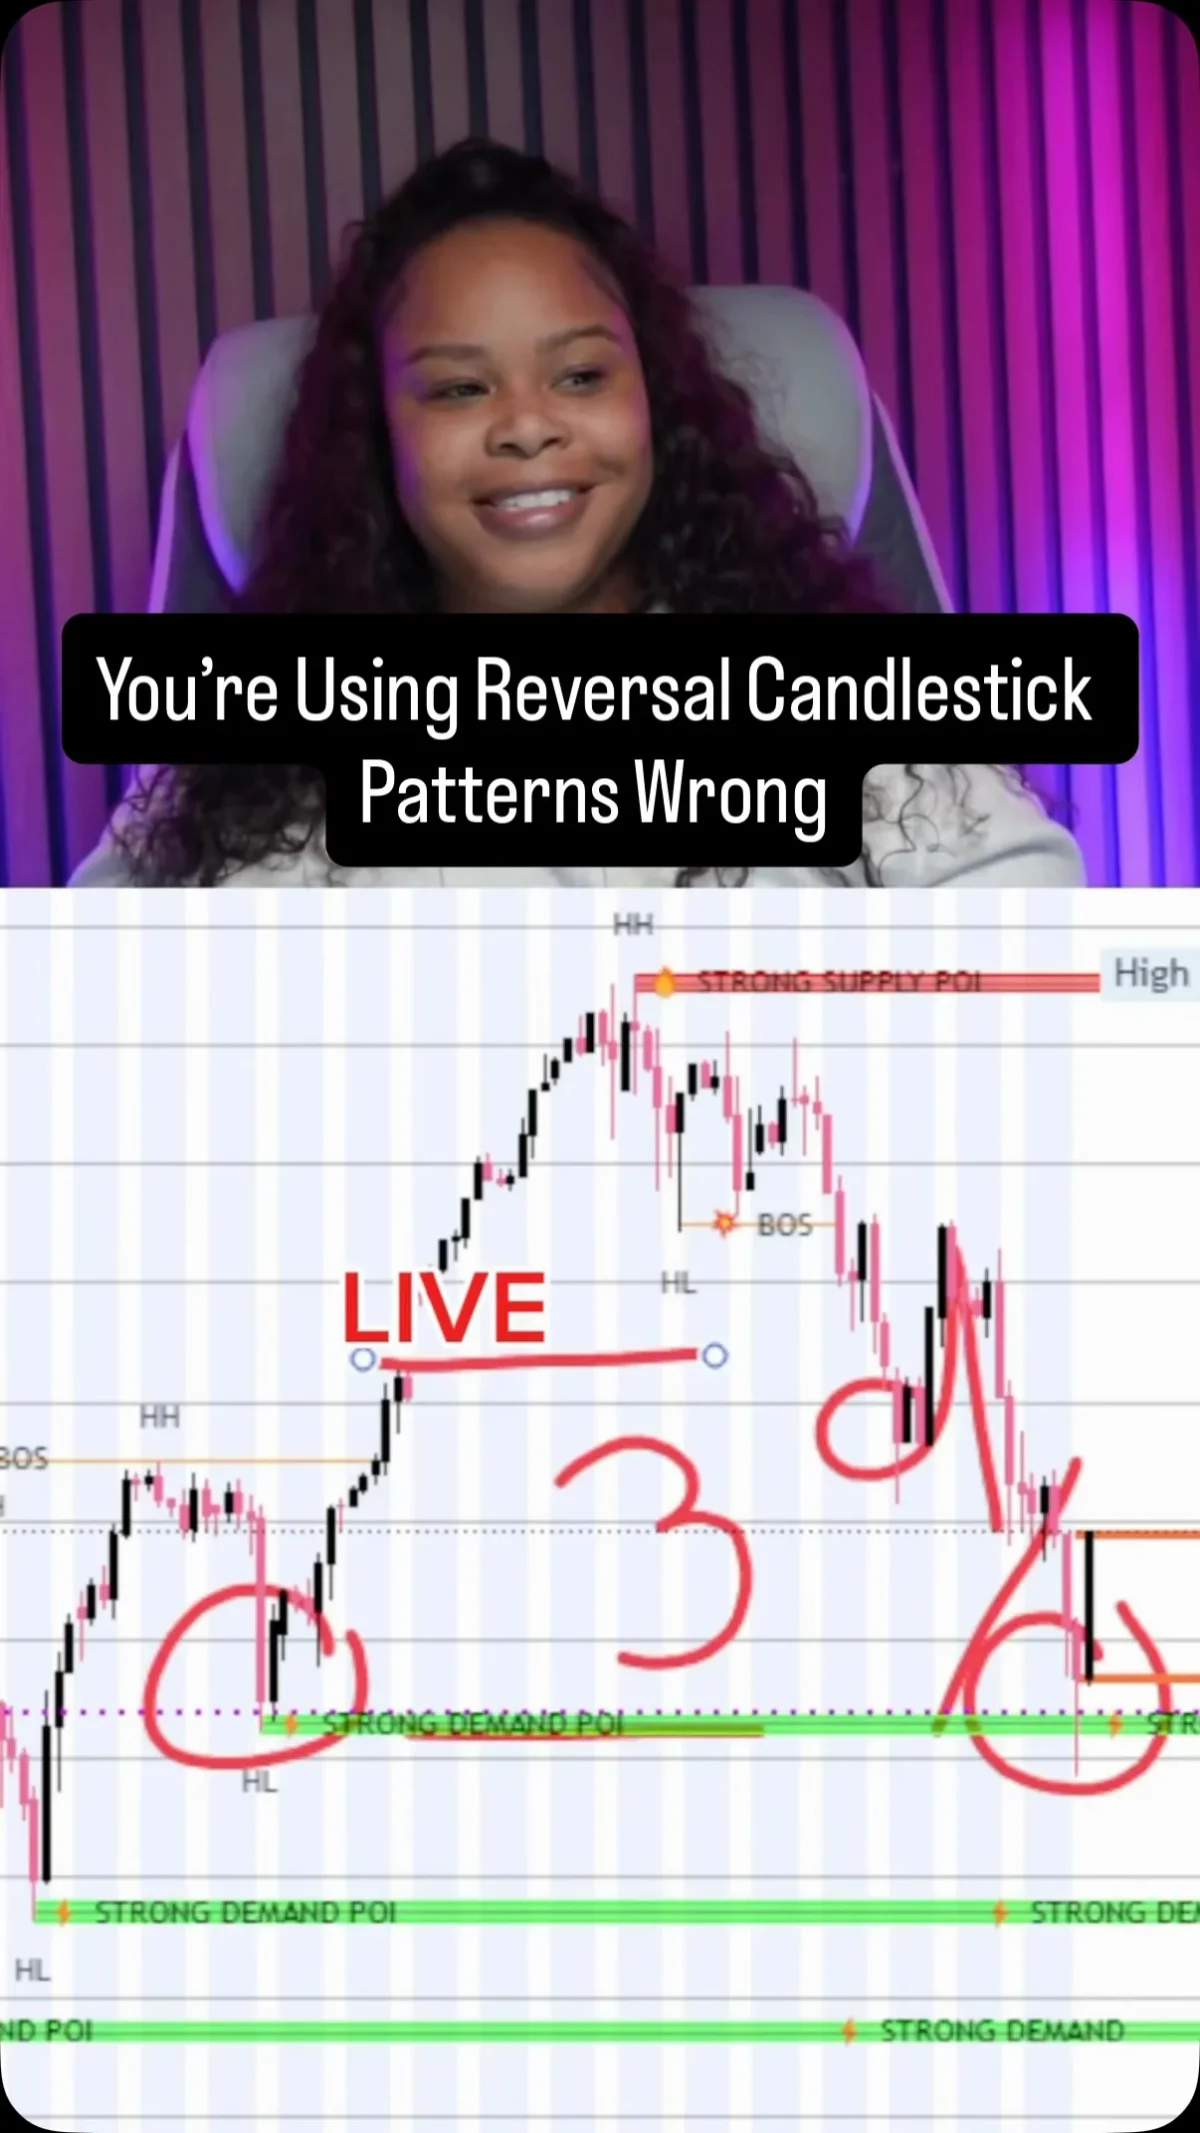
Candlestick Reversals Need Support Zones and Confirmation
You see a bullish engulfing or hammer and enter right away. That’s why it fails. Reversal candlestick patterns don’t work without context. If it’s not at a demand zone or key support and resistance level, it’s just noise. Wait for structure and confirmation. That’s what...
Eight Weeks of Bearish Sentiment Rare Near All‑time Highs
I looked at the 19 other times in history we saw more bears than bulls for eight weeks in a row. Usually stocks were much further away from ATHs. In fact, last time this close to new ATHs and 8 in a...
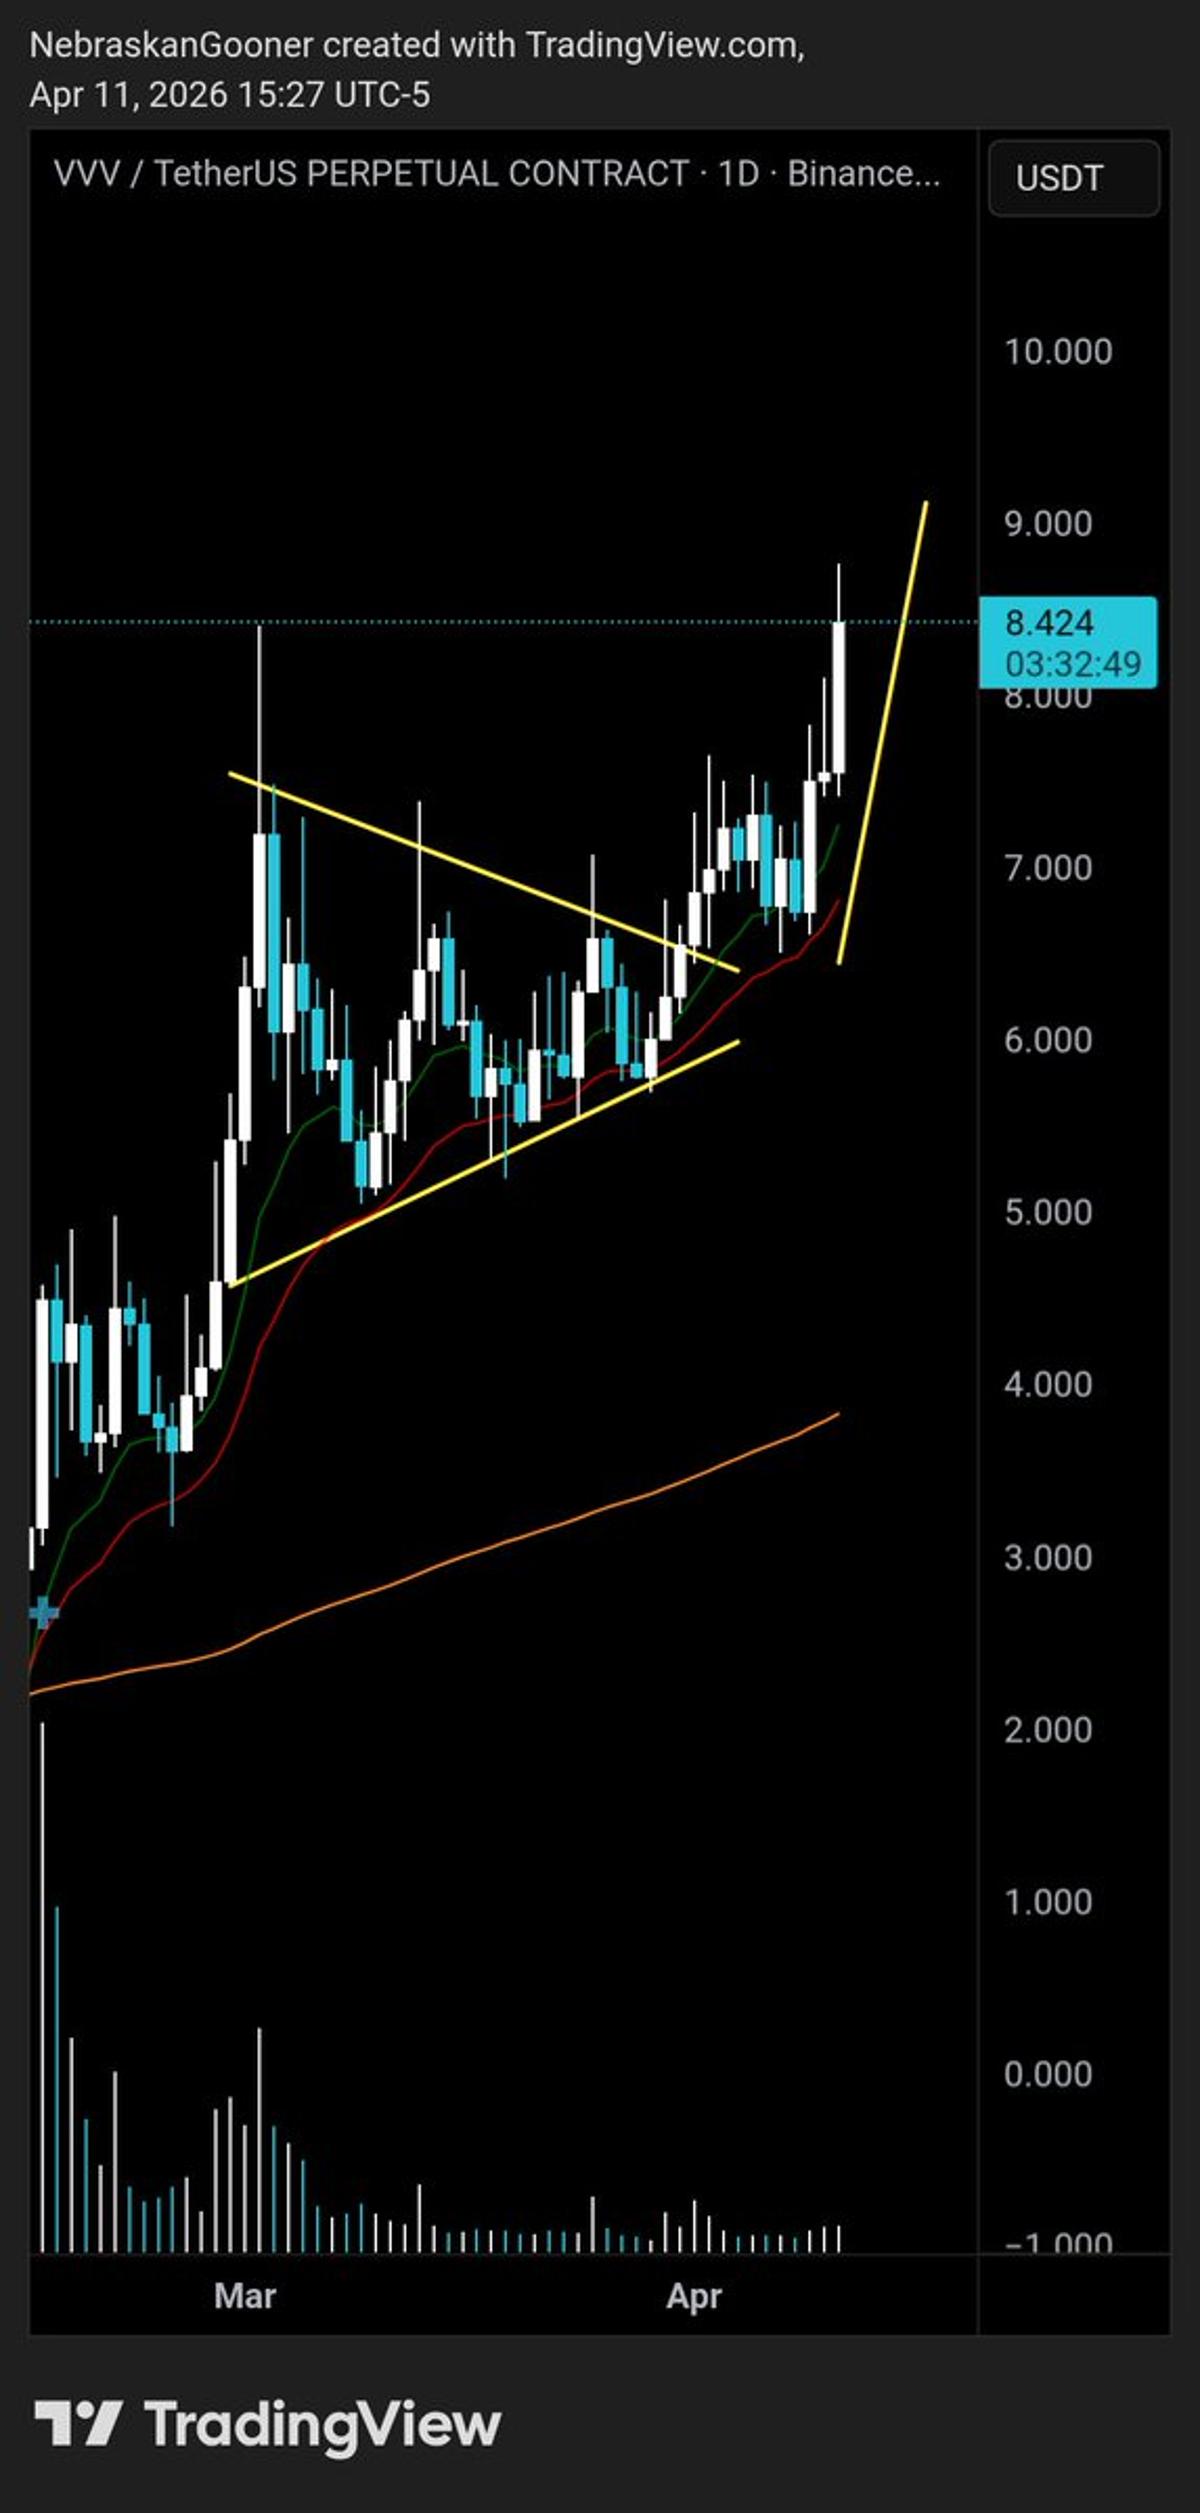
Missed Bull Pennant Breakout: VVV Up 30%
$VVV Up 30% from breakout, almost to target The most annoyingly obviously bull pennant break out in a while and didn't trade it because these have been failing lately 😓 https://t.co/TyUFzY5mt2

Hedge Funds Turn Bearish, Raising Unwind Risk
Goldman Prime Book shows hedge funds are more bearish now than at the Liberation Day lows. The potential for a serious unwind higher is real. @dailychartbook with another gem. https://t.co/BYv3uPRt2G
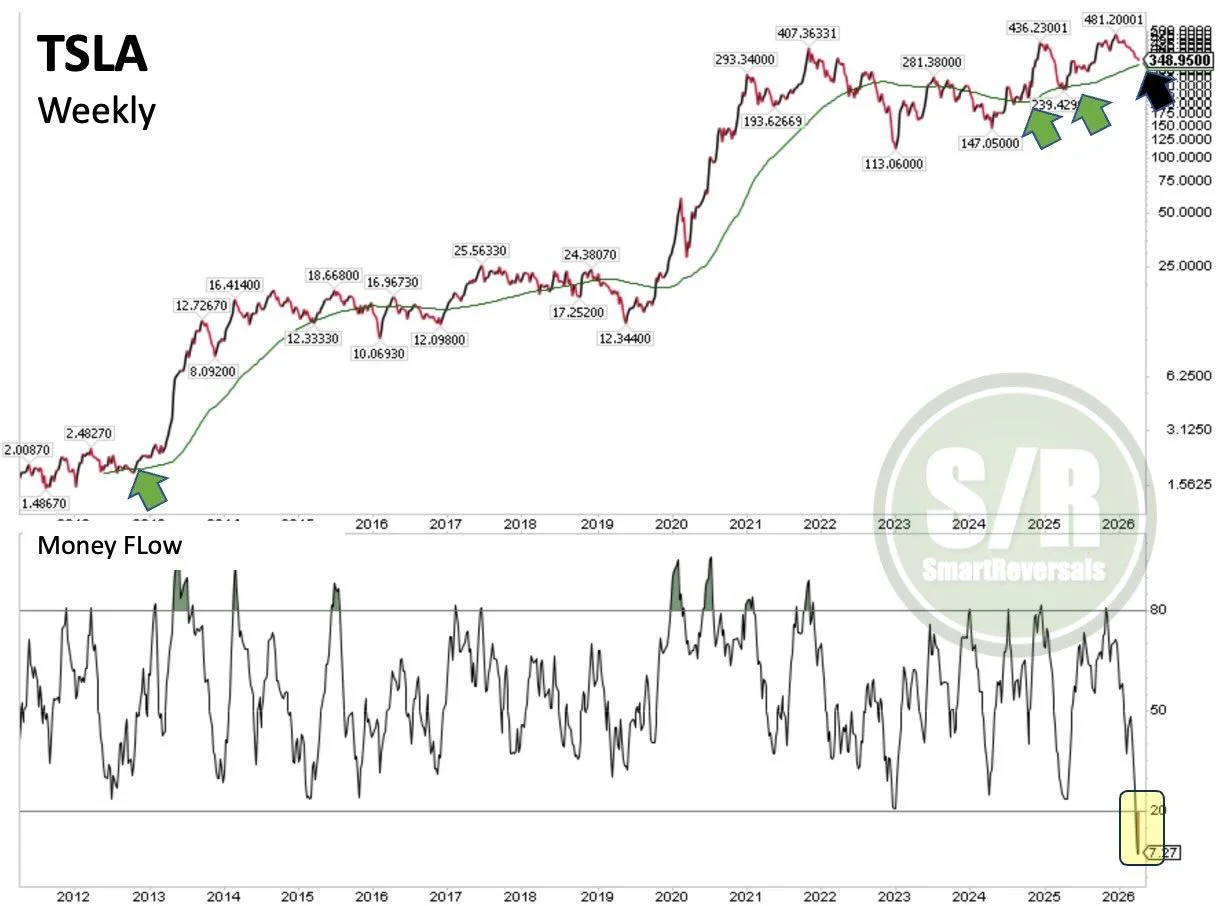
Tesla Near 100‑Week MA, Money Flow at Historic Low
#TSLA: Bounce Ahead? Money Flow is at historical lows on the weekly, and the price is sitting at the 100 week moving average which has supported the trend since August 2024. The bullish above/bearish below weekly level for Tesla is...
RSI Over 70 Doesn't Mean Short in Trending Markets
Old RSI is dead ☠️📉 Most traders still see RSI above 70 and instantly short. In a trending market, that’s a great way to get steamrolled. RSI can stay over 70 for hours while price keeps ripping. The market does not...

META's 20% Two‑Week Surge Hits Intermediate Low
$META was up 19.81% over the last 2 weeks. This 2 week rally is on par with the 2 week 19.05% rally after the April 2025 low, which means that it probably made an intermediate term low 2 weeks ago....

Markets Price 65% Chance of June Rate Cut
S&P 500 just had its best week of 2026 +3.6% for the week. Nasdaq +4.7%. What triggered it: - Trump's 90-day tariff pause - Oil down on Iran de-escalation - Markets now pricing 65% June rate cut Here's the thing nobody's saying 👇
Master Rules‑Based Swing Trades with In‑Depth Stock Scans
Just posted for X subscribers Manual Scanning for Opportunity Process The goal of this 42 minute video is to show you the process and how to think about anticipating a move so you are able to apply a rules based...

AVGO Surges 18% to Break 20‑week MA
$AVGO was up 18.12% this week. It was the biggest up week since late November. It closed the week above the 20 week MA, confirming that it made an intermediate term low last week. We'll find out if it leads...

Amazon Spikes 13.6%, Tops 20‑week Moving Average
$AMZN was up 13.64% this week. It was the biggest up week since the bear market low in January 2023. It closed the week above the 20 week MA, confirming that it made an intermediate term low in February. We'll...
IGV Breaks Support as PE Software Costs Rise, AI Falls
Ballsy call. IGV just broke support. Private equity has software problems. Cost of capital is rising in the sector while AI cost of capital is dropping. Maybe a short squeeze but doesn’t feel like real capitulation after a twenty year bull market.

Bearish Engulfing Signals Potential Oil Top, Await Confirmation
$USOIL - The weekly bearish engulfing candle is further evidence to what I claimed since the March 9 top, that a major top was in. Technically, it hasn't been confirmed yet. That will happen only when the price of oil...

Silver Poised for Bounce to 88.84 Amid Bear Market
$Silver - The bounce out of the March low should continue into late April. The target could be as high as the 78.6% retracement of the March down leg at 88.84. Overall, it's just another bounce in a developing bear...

Gold Poised to Rise to 5028‑5280 by Late April
$Gold - The bounce out of the March low should continue into late April. The target is the 61.8%-78.6% retracement of the late January to late March downtrend at 5028-5280. https://t.co/YIo7oWw7FV

XLK RSI Signals Bearish Range Capped Near 60
$XLK - RSI regime analysis points out a bearish range topping out around 60......we shall see.... https://t.co/gwSV7XMr1T
Market Shifts Require Four Steps, Retests Can Reset
The market goes through a 4 step process to transition from a downtrend to an uptrend. The process isn't always linear. Retests (step 3) can fail, resetting the process to step 1. In rare cases the market skips step 3,...

TLT Set to Outperform USO as Oil Rises
TLT Flushed vs. USO -- Dip to Buy, or Different? The iShares 20+ Year Treasury Bond ETF (TLT) has dropped to a 10-year low vs. the United States Oil Fund LP (USO). Will the TLT/USO total return spread be higher or...

Gold Peaks Signal Potential 25% S&P Decline
When Parabolic Gold Peaks, Stocks Typically Drop The stock market tends to decline when gold peaks from high-velocity rallies. Will it be different this time? My graphic highlights the metal rolling over from its greatest premium to the 20-quarter moving average...

Market Holds Near Highs as Volatility Crumbles
Despite war, an oil shock, and nonstop tweets, the market is holding near highs and volatility just got crushed. With OPEX coming up next week, @spotgamma and I are back to break it all down. https://t.co/FIJLn2JfZr

SPX Gains 7% as Six-Strategy Ensemble Beats Benchmarks
Weekly Signals update: $SPX had strong performance the past two weeks with 7% gain. The ensemble of six strategies still outperforms by 300 bps YTD, with much lower drawdown. Link in reply below with free access to weekly recap. 👇...

Expect SPX Dip, Buying Puts at Current Levels
Saturday 3/28 SPX 6400. Expect a sizable dip on Monday and "Nothing but a buyer" Saturday 4/11. SPX 6820 buying puts last week at current levels . Just doing what we do. https://t.co/ZSOy0u6uI1
Russell 3000 Hits Highest 4‑Week High Count Since April 2025
The number of net new 4-week highs in the Russell3000 just reached its highest count since April 2025

Buy Bitcoin Dips Near $70.5k as ETF Inflows Surge
ETF demand rebounds: BlackRock IBIT $269.3M inflow. BTC ~72k as geopolitics ease. Risk: technical divergence; resistance ~73k, support ~70.5k. Insight: buy dips near 70.5k. — Viktor Kopylov, PhD, CFA More insights: t.me/si14Kopylov

Nasdaq 100 Achieves Rare 8‑Day, 8%+ Streak
Nasdaq 100 is 8-for-8! #NDX is now positive for 8 consecutive days with 8%+ gains for only the 13th time in 40 years.

One Low‑Vol Short Can Power an Entire Year’s Alpha
It is underdiscussed how much great short selling talent sits at multis, and how important alpha shorting really is to success in the multi-manager model. One big short, particularly in a low vol name you can size in dollars, can make...

Market Executes V‑Shape Rally; Semis Hit All‑Time Highs
Market just pulled off a full V-shaped rally Semis at all-time highs, breadth expanding, and positioning flipped fast. Here’s how we're trading it $SPY $QQQ $IWM $SMH $USO https://t.co/fgOrjqiQ0I

Ceasefire‑Driven Rally Likely Short‑Lived Ahead Weekend Risk
Relief Rally Ends Ahead Of Weekend Risk $SPX $VIX Mechanical buying & short covering made for an historical bounce on 'ceasefire' news. But is it really safe? https://t.co/rBuCLlLEIj

SAFX Fireworks: Sold Wednesday Core Swing Addition
$SAFX nice fireworks today -- sold what I added around core swing from Wednesday @IUTraders https://t.co/V7sKzPxW1U

Two‑Week 3%+ S&P Surge Predicts Strong Year‑Ahead Returns
More good news for the bulls. S&P 500 up >3% back to back weeks is historically quite bullish. Above average returns across the board and higher a year later 86.7% of the time. https://t.co/vVfLF8fE7P

Hedge Funds' Short Covering Crushed Market as Retail Shifts
From the TFF which I much prefer to COT. The last month was clear. Long only asset managers do what they always do which is chase price. Through tuesday they were nothing but buyers and must have...

SPX Needs 6855 Breakout to Reach 7K
$SPX - Ended a 7 day up streak after almost reaching the 78.6% retracement of the late January to late March downtrned at 6855. The March 30 low was confirmed as an intermediate term low but it needs a close...

Tech Rallies 4%+; XLK Hits First Death Cross
Technology led the way higher with a more than 4% gain for the second-straight week. But XLK couldn't avoid a death cross, its first since March 2025 https://t.co/gGrsYGe9od
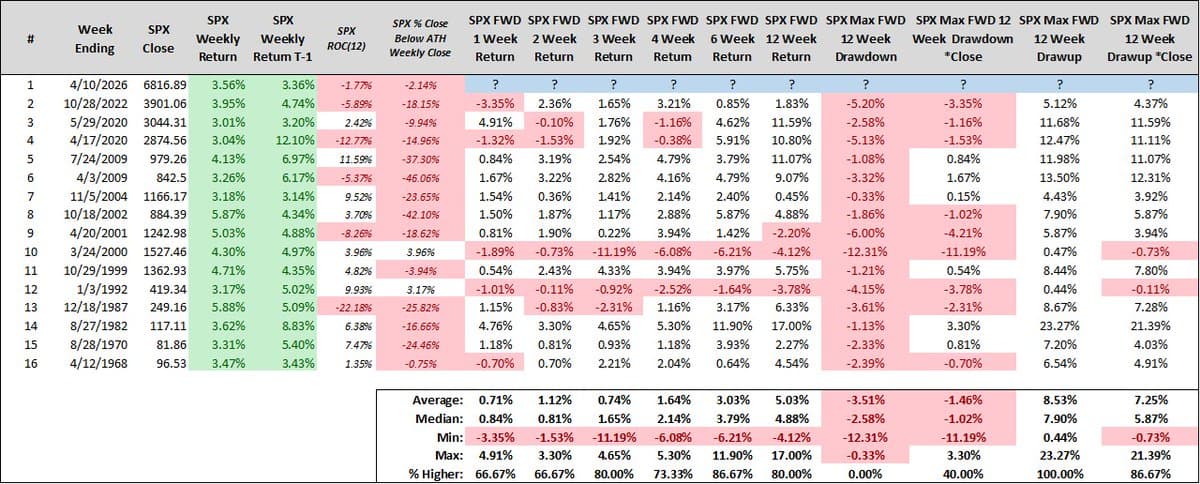
Rare 2‑Week 3%+ S&P Gains Predict Future Moves
Random: The S&P 500 just gained more than 3% in consecutive trading weeks - 16th instance since 1950 (per my data). Here's how the index has traded thereafter. $spx https://t.co/TrSK4jsJpR

IGV Near Support; Below $74 Triggers Drop to $65
$IGV - Broke the major support at $76, but has reached the 62% retracement of the 2022-2025 bull market at $74, so it can't be ruled out that this is not a real breakdown. However, a close below $74 will...
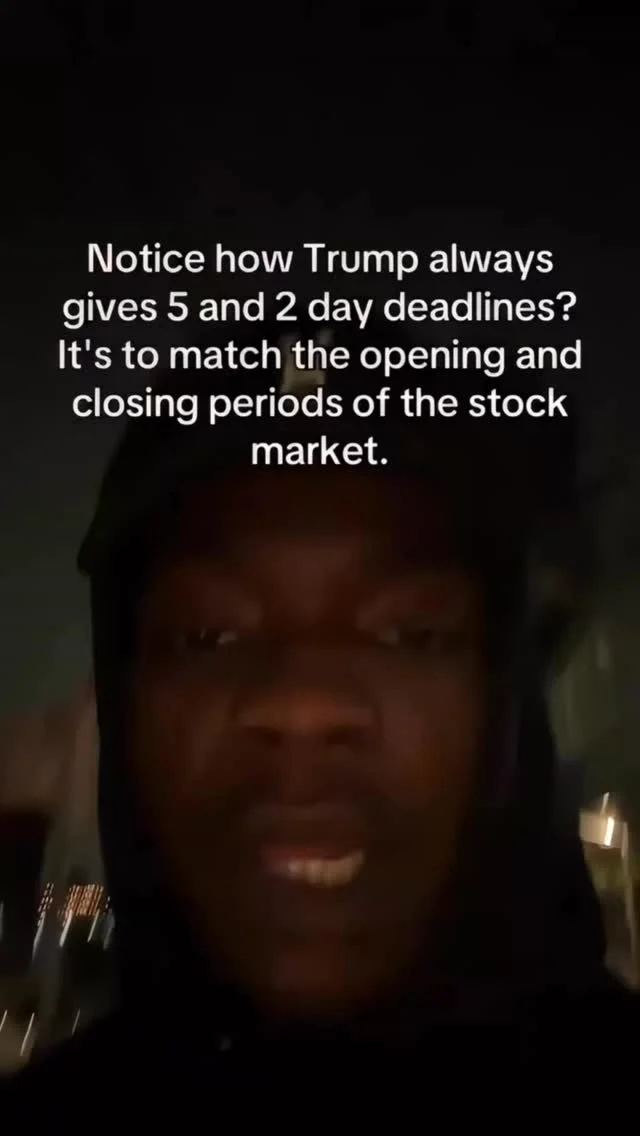
Timed Deadlines Manipulate Markets via Fear‑Relief Cycles
Thoughts? We break down how strategic deadlines are timed around stock market openings and closings to engineer market movements. We explain the fear-relief rally cycle: creating extreme fear with shocking announcements, causing heavy selling, then announcing relief to trigger buying...

Rolled QQQ Put Spreads,
Adjustment: $QQQ May 590/550 1x2 put spreads ==> June 600/564.78-560 1x2 put spreads taking $2.30
Signal Detects Upcoming News, Triggers CRWV Short Cover
We sent Institutional Subs a signal to cover the $CRWV Short this week The Signal sniffed out the pending "news"

Hedgeye Nation Spotlights XTL Volume Surge
Long "Optical" yet? Big week for Hedgeye Nation after adding this one to the pile where you see the volume accelerate (green arrow) in this chart $XTL https://t.co/dfBPEvo71B