
200‑Week EMA Unreliable; Bitcoin’s Bullish Meander Lik
#BTC In the weeks since this post... Bitcoin lost the 200 week EMA as support and turned it into resistance Only to then Weekly Close above it two weeks ago and successfully reclaim it as support last week Indeed, as per the previous post, "the 200-week EMA is acting as both unreliable resistance and unreliable support never truly confirming a clear role, lending itself to meandering in and around here" Here's what may be happening: This meandering will likely continue to further build out this current cluster of price action to come across as sufficiently bullish but somehow ultimately fail to resolve with sizeable bullish momentum before transitioning into Macro Downside over time $BTC #Crypto #Bitcoin

Bottom Detection: Use Checklist, Not Black Box
as i showed in the #WhereDoWeStand webinar on Friday, i had shared my "Is It a Bottom?" checklist on April 1st, pointing out that many ingredients were in place... it's not a black box, nor it is reasonable to hit...

Nat Gas Enters Extended Seasonal Trading Window
Start of a long Seasonal window for nat gas as of today (courtesy Moore Research Center). https://t.co/mYPvrsOkle
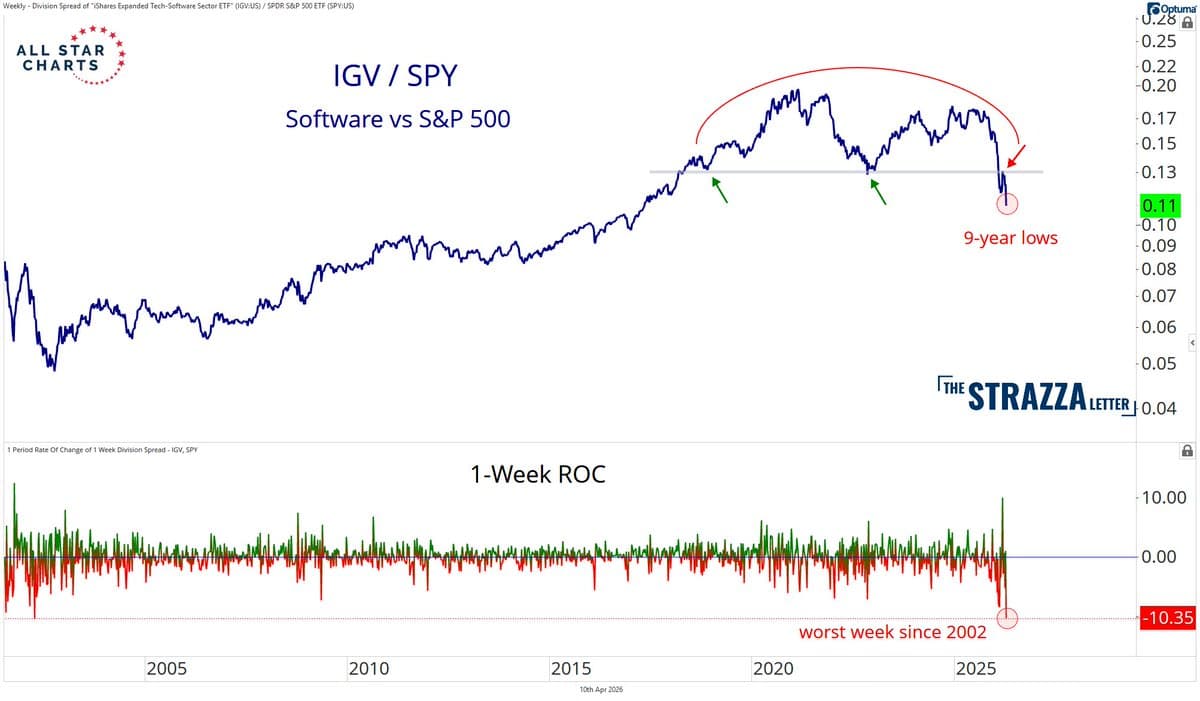
IGV Records Its Worst Week Vs. S&P 500
Software stocks $IGV coming off their worst week in history relative to the S&P 500 https://t.co/zaCRYoPb9i

Indexes Surge, First Dip Signals Buying Opportunity
indexes been on extended run UP...first flush below was buying op. Now: hold this upside 240 channel, or put in a lower high today... https://t.co/ChRsgSpkin

BTC Faces Dual ATH Resistance, Must Reclaim 2021 First
#BTC Bitcoin actually Monthly Closed below both 2021 and 2024 old All Time Highs, technically solidifying them as resistance However, price hasn't rejected much from here since then, raising doubts about the rejection strength in these levels The most important level for...

Avoid Jumping Into Gold Gap Moves
Another lesson in gap trading in gold last night - NEVER jump into the move

SPY Tests Critical $671‑$673 Support Level
$spy morning glance as we see if $671-$673 can hold. That would be impressive https://t.co/JegnizirdN
Markets Wobble, Oil Climbs; Stay Nimble Amid Volatility
The looming blockade has the markets off to a shaky start to the week, and $GS shares are trading lower despite being the first bank to report and and bring a top and bottom beat. All eyes on Oil futures...
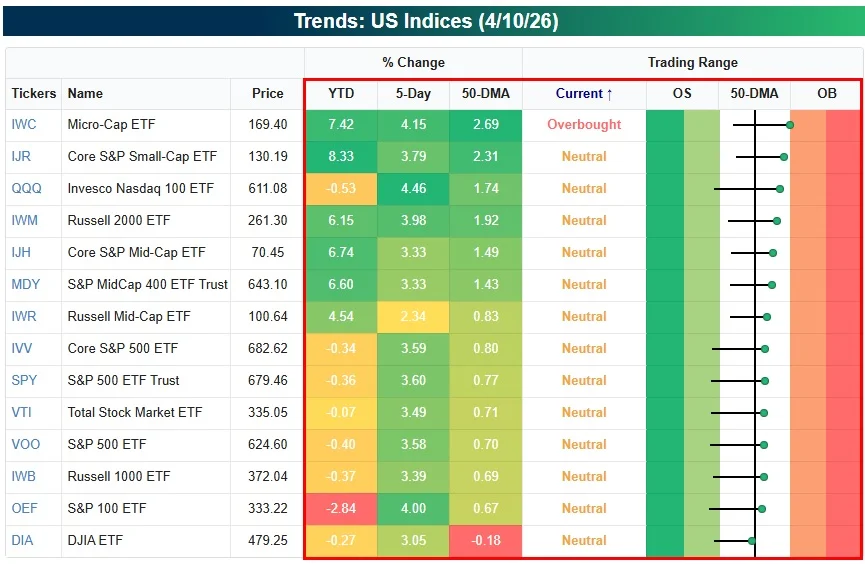
All US Index ETFs Surge Above 50‑DMA, DIA Lags
All of the key US index ETFs across market caps moved back above their 50-DMAs last week with the exception of the Dow 30 ETF #DIA

Bitcoin Poised for Upward Breakout, $80K Target
Essentially, I think that we're lining up for breakouts upwards on $BTC. To get there, I have three scenarios that could play out. Scenario 1 - Immediate breakout to $80k in coming weeks (35%) The reasoning for this is relatively simple. - $BTC is...
Semiconductors Outpace Energy Gains After Iran Tension
fun fact: the energy stocks have been "strong" since Feb 27th (the day before the U.S./Israel attacked Iran)... $XLE +1.8% 👀 but the semiconductors? $SMH +7.5%

Watch 6740 S&P Support; Dip Buying Opportunities
$SPX moved from 6316 (~9.8% off highs) to 6845, and the oscillator went -40 to +60, so some downside makes sense, 6740 is the big gap support from last week. If 6740 doesn’t hold it can get sloppier, but there...

Oil Surges 8.2%, Signaling New Quad3 Cycle Highs
Did you buy more Oil and Energy Stocks when they were on sale last week? Oil inflating another +8.2% here with immediate-term upside in our Risk Range™ Signal to new #Quad3 Cycle Highs https://t.co/ye9Xfr03uQ

HSBC's Kettner Stays Bullish Despite Modest News
HSBC's Max Kettner is still bullish: "We don't need a full return to normality in order to fade the moves of the last 6 weeks. Given our positioning framework is still sending the most bullish signal for risk assets since...
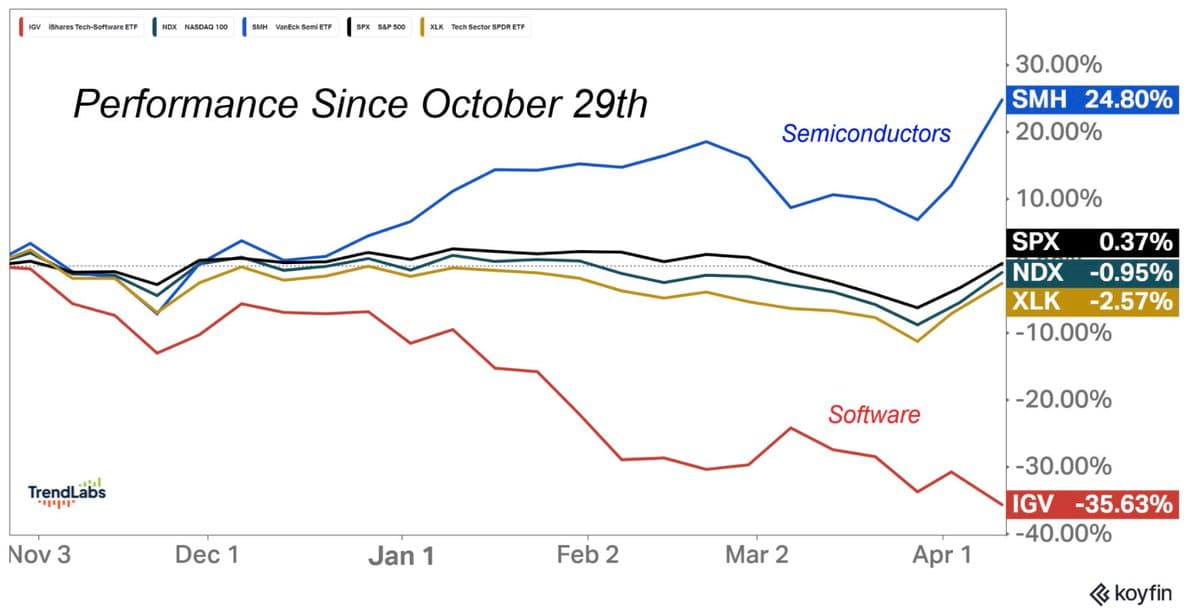
Tech Stocks Show K‑Shape Recovery You Can’t Ignore
The K-Shape economy for others may not be your problem. But this K-Shape in Tech stocks actually is 👀 https://t.co/jQdzcPqdUp

Beyond Price: Analyze Volume and Volatility Momentum
When you "look" at markets, are you just looking at the color and the "Moving Average" of price or the ROC of the volume and volatility of that price? https://t.co/qgJeZy0Z5c

SPX Implied Vol Premium Plummets From 95% to 13
$SPX Implied Vol collapsed to a +13% premium (vs. 30-day realized) vs. a +95% premium 1-month ago https://t.co/JxuNpzgXz1
SPY Volume Decelerates After Seven Straight Gains
VOLUME: CTAs were still chasing Friday, but total volume continued to decelerate post 7 straight up days for $SPY https://t.co/4GpuK0sjtf

Good News, Falling Stock Signals Bearish Trend
If all the news about your stock is good and it’s still going down, that is a bearish signal few traders have learned to listen to. https://t.co/DgIP78v7Wv

SPY's Friday Rally Masked 18:1 Downside Risk
For those of you who chased $SPY on green on Friday, there was only 18:1 downside vs. upside in our immediate-term Risk Range™ Signal. No worries

Two‑Week Bounce Shows Market Resilience Globally
Mixed/small red arrows around the World as I’d say this is “in stride” after the size of the two week bounce that just took place. https://t.co/HVI7wGoFBW
Hedgeye's VIX Risk Range Analysis Delivers Recent Alpha
Undaunted and strictly process oriented, @KeithMcCullough @hedgeye provided a valuable analysis of the VIX risk range that producedexcess returns (alpha) in the last several trading days. That analysis was worth the price of admission alone. @dougkass @SamofAmerica @HedgeyeDJ

Midcaps Surge Past Large Caps, Ratio Hits New High
This one chart will keep me on the right side of the market. No matter what the news, the midcaps have outperformed the large caps over the last month. The ratio is making a new high today. Why worry about...
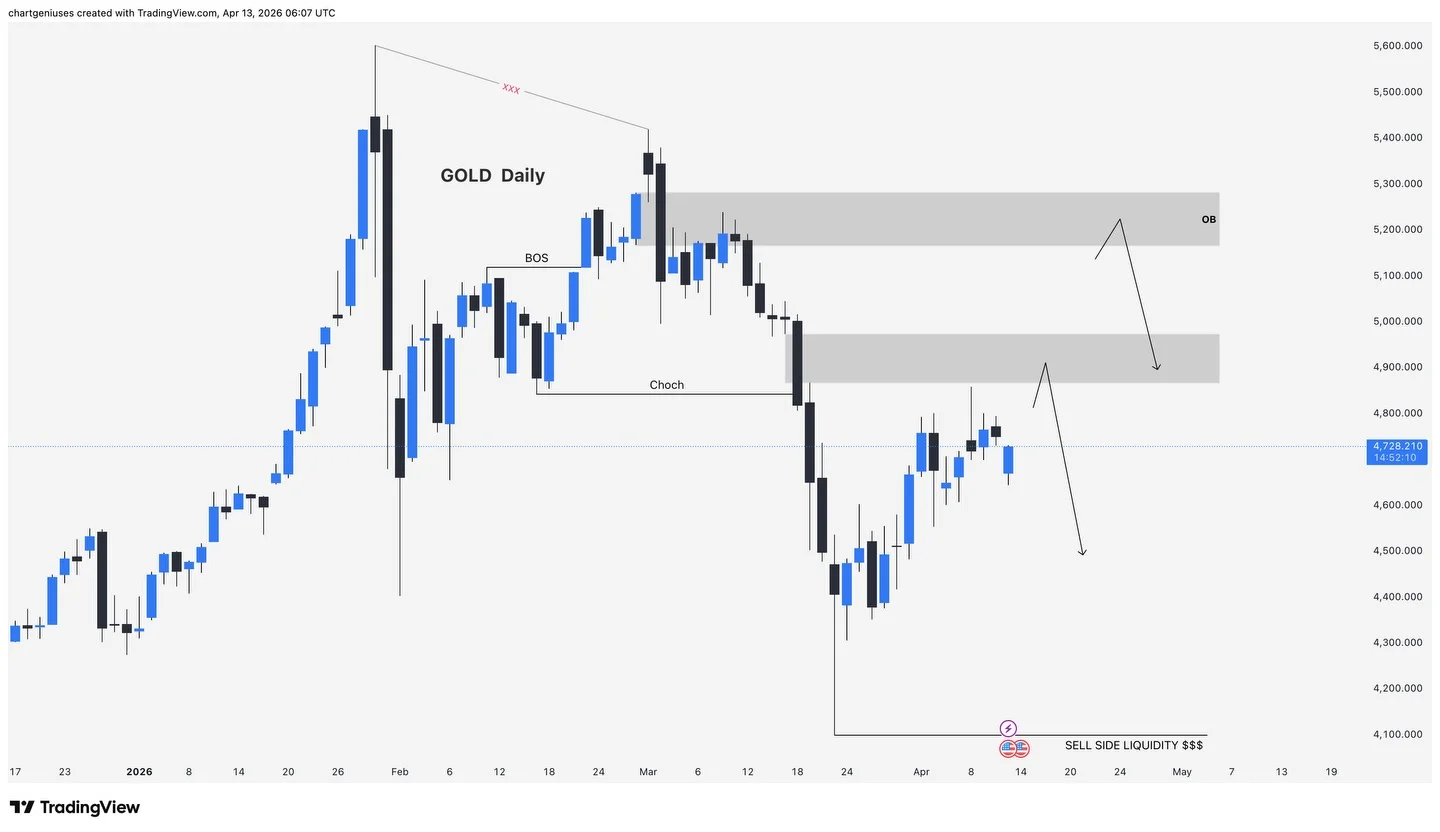
Gold Follows Structure; Wait for Confirmation, Not Prediction
Most traders miss this simple truth… Gold is not moving randomly It is reacting to structure and liquidity After a clear shift in direction, price is now retracing into a key zone where reactions matter most The real edge is not predicting It is waiting...
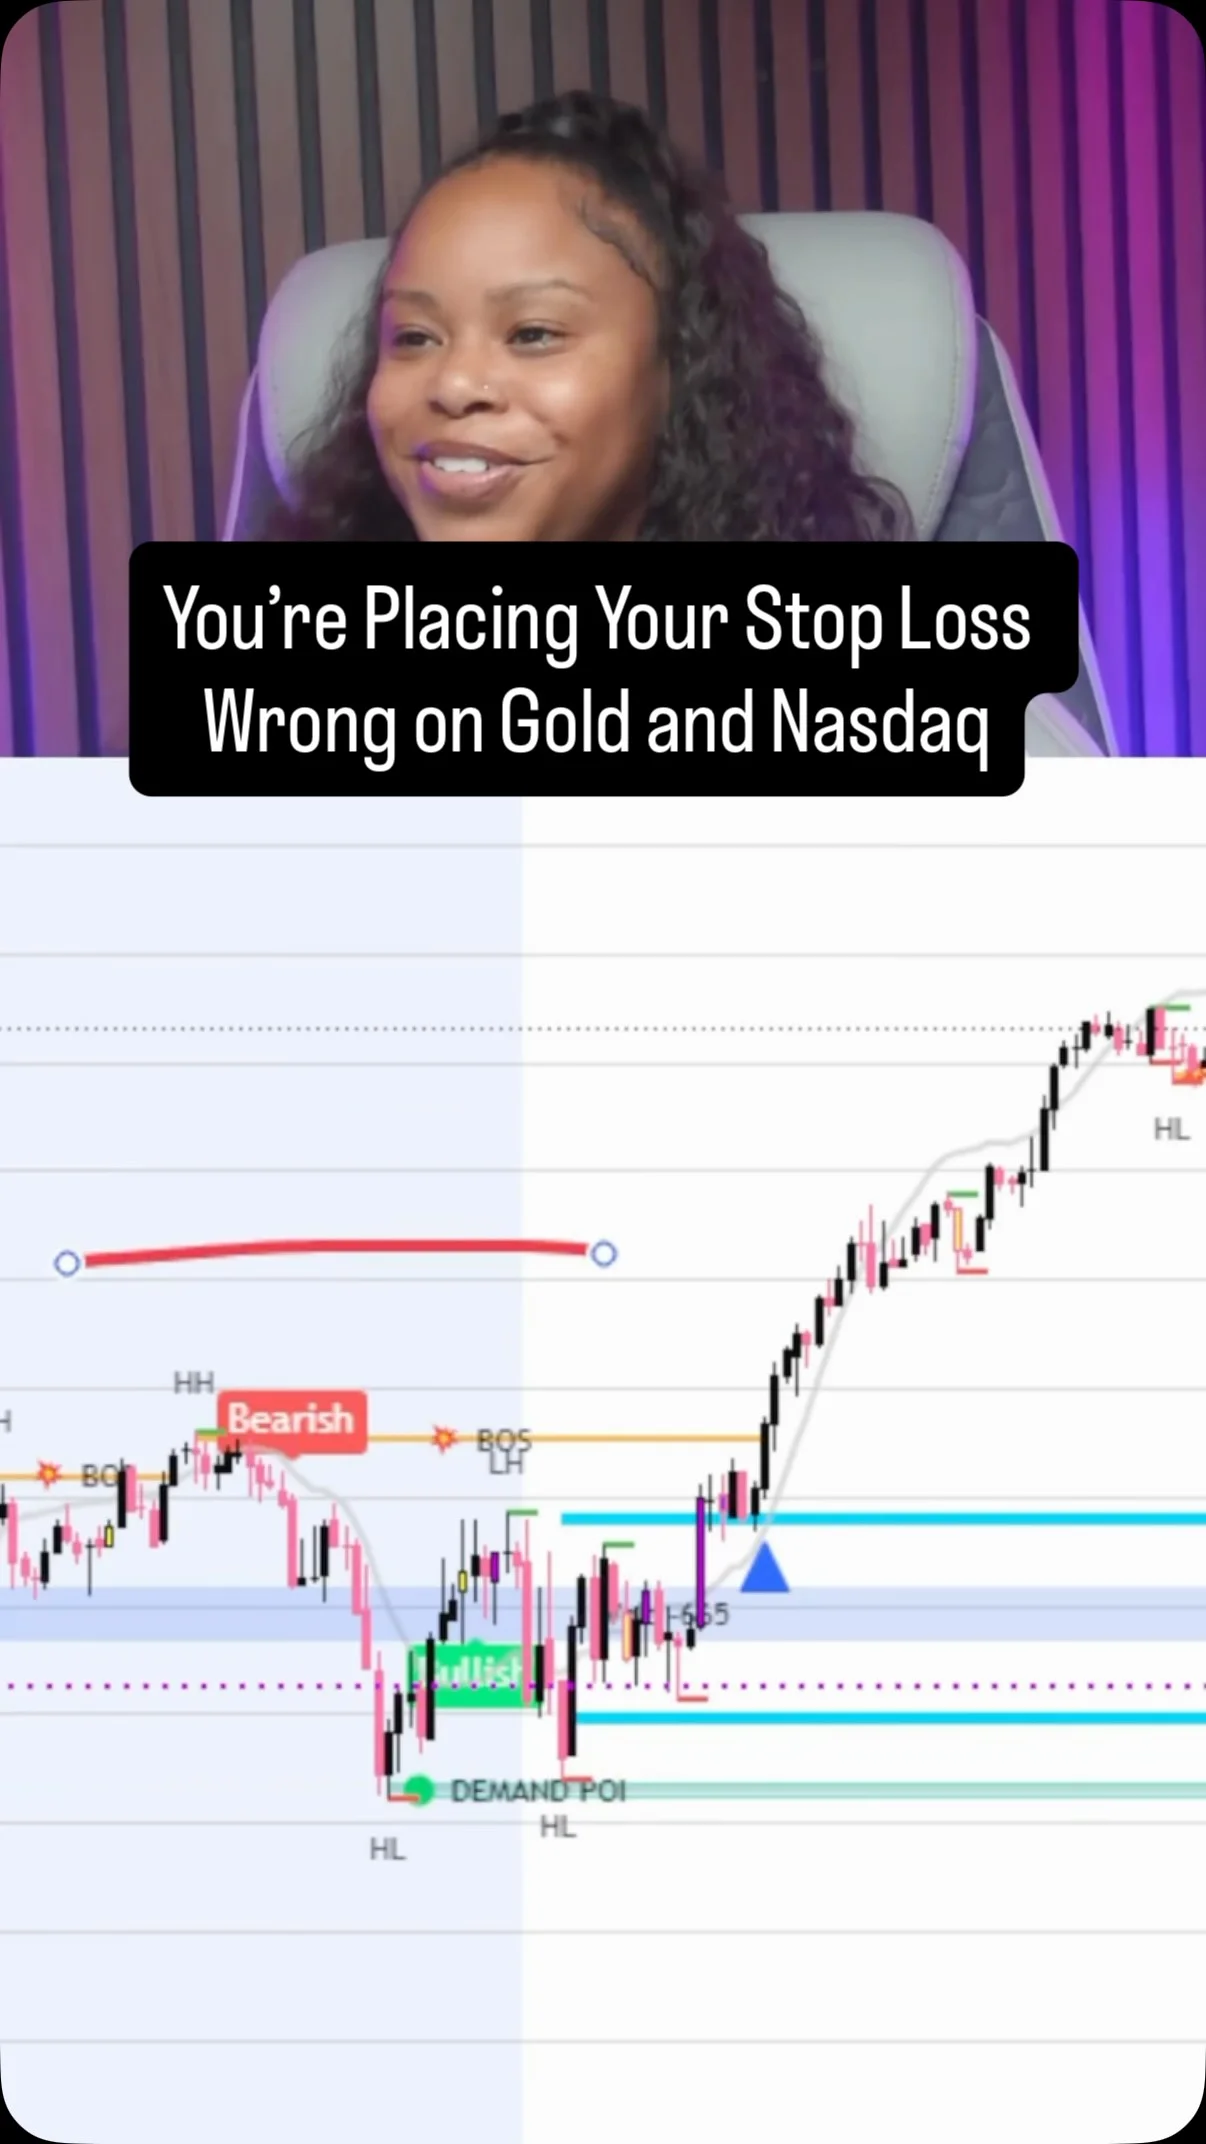
Place Stops on Market Structure, Not Fear
Most traders place stops based on fear, not structure. Too tight… right into liquidity. If you’re not using market structure, you’re guessing. Higher highs, higher lows, lower highs, lower lows. That’s where your stop loss should be built from. Below structure in an uptrend. Above structure...

Improving Breadth Isn’t the Same as Achieving Strong Breadth
Improving breadth is different than strong breadth.... Breadth is improving but it's far from strong. https://t.co/jhcybGcDj4

Bulls Return: SPY Gains Signal Bull Market Revival
$SPY - The Sunday Stalk List | Ep. 41 The Bulls are Back In The Ring https://t.co/A64JrtLll6

Embrace Uncertainty: Don't Ignore Possibilities in Charting
Cheds, I never want to ignore a possibility. There are no certainties in charting. And, probability does not apply to individual slices of time. Not an ideal Compound Fulcrum. Let's follow the P&F work. See example of Copper from 50 years...
Stochastic Bullish Crossover Signals Crude Spike, SPX at Risk
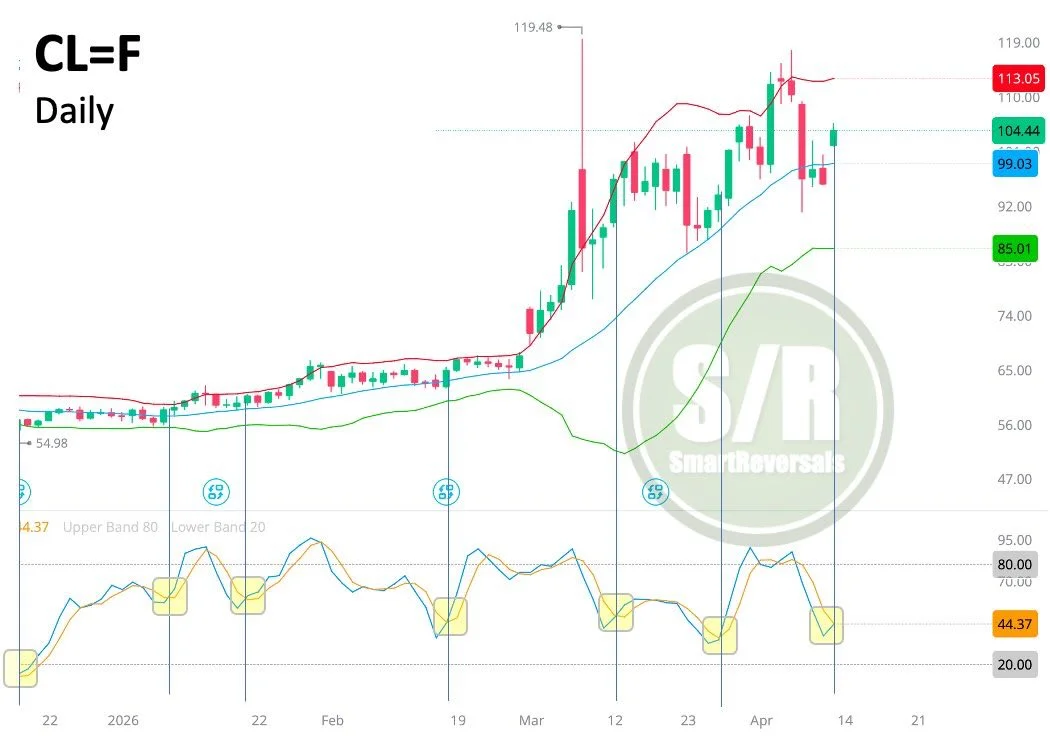
#Oil: A bullish Stochastic crossover is forming, typically preceding multi-day spikes in #CL_F. The recovery of the 20DMA is concerning for #SPX bulls. The key weekly level is $101.4; if lost, the SPX could spike again. Otherwise, expect pressure on...

RBOB Gasoline Futures Hover Around $3.20 After Volatile Swing
RBOB gasoline futures tagged $3.40 at the March peak... dropped to $2.90... now $3.20.. chopfest https://t.co/3gXzdFHSvH

WTI Oil Prices Return to March Range
WTI in the middle of the range back to the last week of March https://t.co/UJdTdFVoGT
Volatility Crush Fuels 3% S&P Rally, Hints Ahead
Last week's vol crush sent the S&P 500 surging 3%. Read up on the mechanics behind the rally — and what they could mean moving forward: https://t.co/Lv07xyrLge

Weekly Market Report Highlights AI Peak and Asset Trends
Weekly Market Report: Peak AI. Plus, a lot more. $SPY $TLT $GLD $DBC $UUP Link in reply below. 👇 https://t.co/UNL0jvfLfj

Huge $74.5M Leveraged Oil Short Near $115 Liquidation
Someone has opened a $74,543,000 oil short position with 4x leverage. Liquidation Price: $115.06👀 https://t.co/wQYzazJF4F

S
#SPX has to drop 7.3% from current levels to break the March lows of 6,316. #SPX has to drop 4.25% from current levels to make April a red month.
Traders Expect SPX Pullback After Two‑Week Rally
I’d think a downside retracement will Be a welcome sign for traders after the size of the two week rally. What’s everyone’s guess for 6:30 eastern tonight for the $spx futures. They will trade all night and who knows news...

Hormuz Blockade Threatens Oil Supply, Markets Await China or Trump
Strait of Hormuz blockade is live 🚢❌ 20% of world oil = gone 🛢️ Equities gap down 📉 Oil gap up 📈 $115 WTI on the table 🎯 One question matters: does China blink first or does Trump? 🇨🇳🇺🇸 Trade...
Oversold Tech Stocks Offer Fresh Buying Opportunities
I went through hundreds of charts this weekend and there's obviously lots of carnage in tech, growth, cloud, cyber, software, fintech, etc... many stocks down -40% or more in the past 6+ months... many multiples getting compressed by 60% or...

Hold Until BTC Closes Above $73,107 for Long
Macro: BTC stalls below $73,107 after rebound from ~$60k; momentum shows early fatigue. Key factors: RSI ~61, MACD still bullish, volume lacks expansion. Risk: failure → retrace toward $69k–$65k. Trade insight: wait for daily close >$73,107 to go long to...

Bitcoin Hits RSI(5) Oversold at $70,966
BItcoin #BTC $BTCUSD is RSI(5) oversold on the 6-hour chart for the first time since the mid $60k's... sitting $70,966... https://t.co/qjRIoQ0ulg

84% Chance S&P Hits New High, Yet 1966 Crash Warns
The odds of the S&P 500 making a new ATH in Q2 after retracing 75% of the downtrend are 84%, but beware the 1966 case which turned into a 23% crash into October. https://t.co/aV92MKXo9S

SPY and QQQ Need Specific Drops to Fill Gaps
For those keeping score at home: It would take declines to 659.61 in $SPY and 588.98 in $QQQ to fill Wednesday's gaps. (Reminder: There's no law that says they have to be filled...) https://t.co/XMoxZZ4gJv

Emerging Market Small Caps Surge as US Equities Lag
Emerging Market small caps are ripping, USA equities least strong m/m (but everything is higher) @wisdomtreefunds https://t.co/DpXLRW0nez

Institution Holds Massive Oil Shorts Near $115/$121
An institution is heavily shorting Oil. They have opened: - $74,388,000 Crude Oil short with liquidation at $114.98 - $24,678,000 Brent Oil short with liquidation at $121.2 https://t.co/vARO0PhagV

Premium Users Get This Week’s Top Trade Ideas
Premium Users - Top Trade Ideas for the Week of April 13, 2026: The Best, on the blog and here https://t.co/ftQfOy5d50

Spotlight Trades Deliver Big Wins Amid Q1 Turmoil
Back in the saddle... so much to catch up on and pre for earnings season Pretty wild looking back at Q1 turmoil, Spotlight trades still had a great hit rate for members with big wins in INTC, NFLX, MS, MRVL, AMZN...

NVDA Above 20‑Week MA, Needs $197.63 Breakout
$NVDA - Closed the week above the 20 week MA which indicates that it may have made an intermediate term low last week, but that will be confirmed only if it breaks the pattern of lower highs and lower lows,...

MSFT Misses 200‑Week MA, Threatened by 345‑350 Support
$MSFT - Failed regaining the 200 week MA this week. Therefore, it's still at risk of dropping to the 345-350 major support range. https://t.co/9CSBJ5Taa5
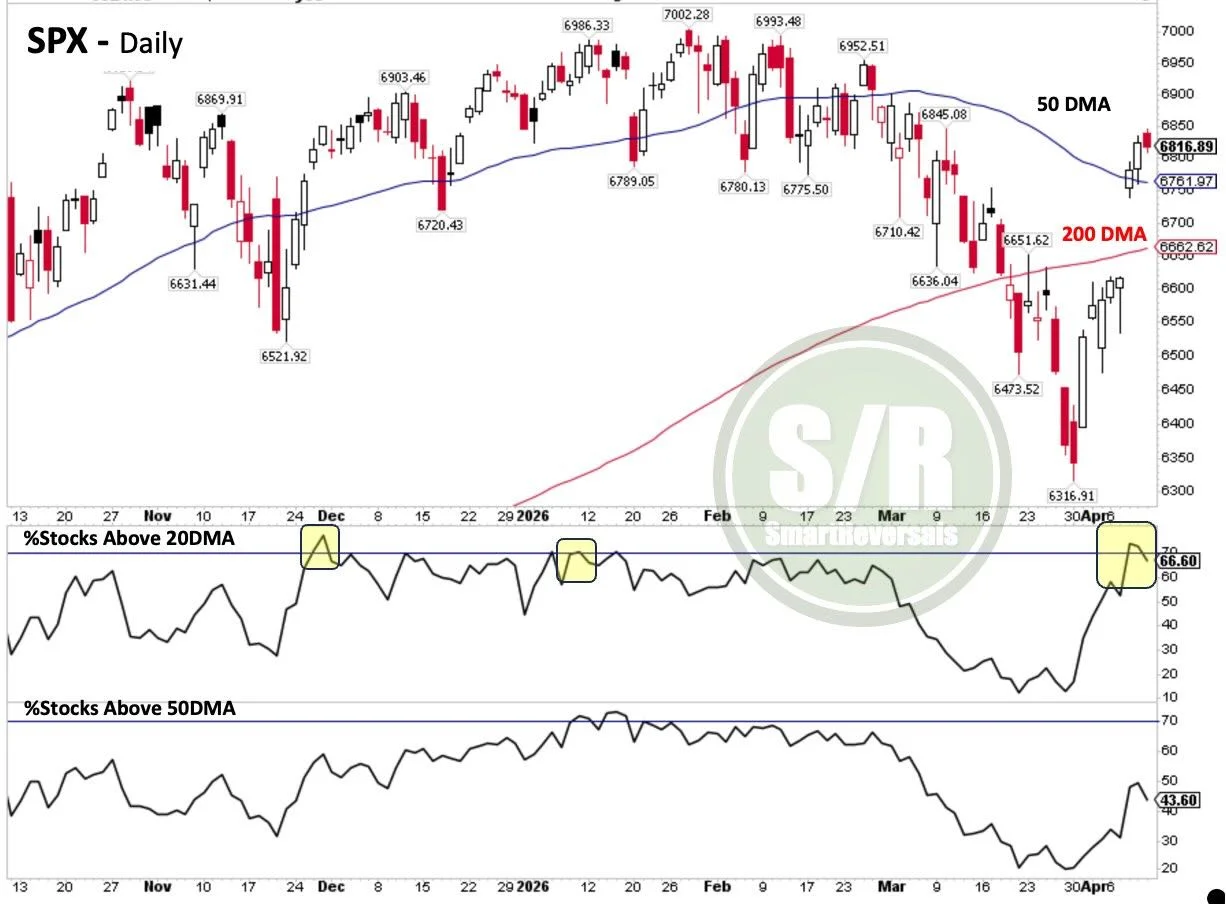
Stocks Above 20DMA Plunge, Consolidation Likely
SPX: The percentage of stocks above their 20DMA has reversed from 70%, usually a consolidation follows; this time potentially below the 50DMA. The market was driven by strength in Tech and Materials, overall participation was negative. #SPY