
Microsoft Stock Tests Key 200‑day Moving Average
🇺🇸 Microsoft shares are testing the 200-day moving average - a significant event after a prolonged decline, note TA analysts. https://t.co/gJbHFrOzAC
Mastering Supply & Demand: Zones, Refinements, Institutional Insights
S&D (SUPPLY AND DEMAND) 📊 S&D Zones📊 S&D Refinements 📊 S&D Fractal Refinements📊 Institutional S&D 📊

BTC CME Gap Likely to Fill, 95% Historical Rate
The #BTC CME Gap is still present. Historically, about 95% of such Gaps eventually get filled. https://t.co/qkvxNOs2am

Master Nifty Options with Rohit Srivastava’s RMI Framework
🚨 WEBINAR ALERT 🚨 Nifty To Options: Rohit Srivastava’s Complete RMI Trading Framework Stop Guessing Market Moves. In this power-packed session, Rohit Srivastava (Creator of RMI) will show you how to go from accurate Nifty Analysis → High-probability options trades using a clear,...
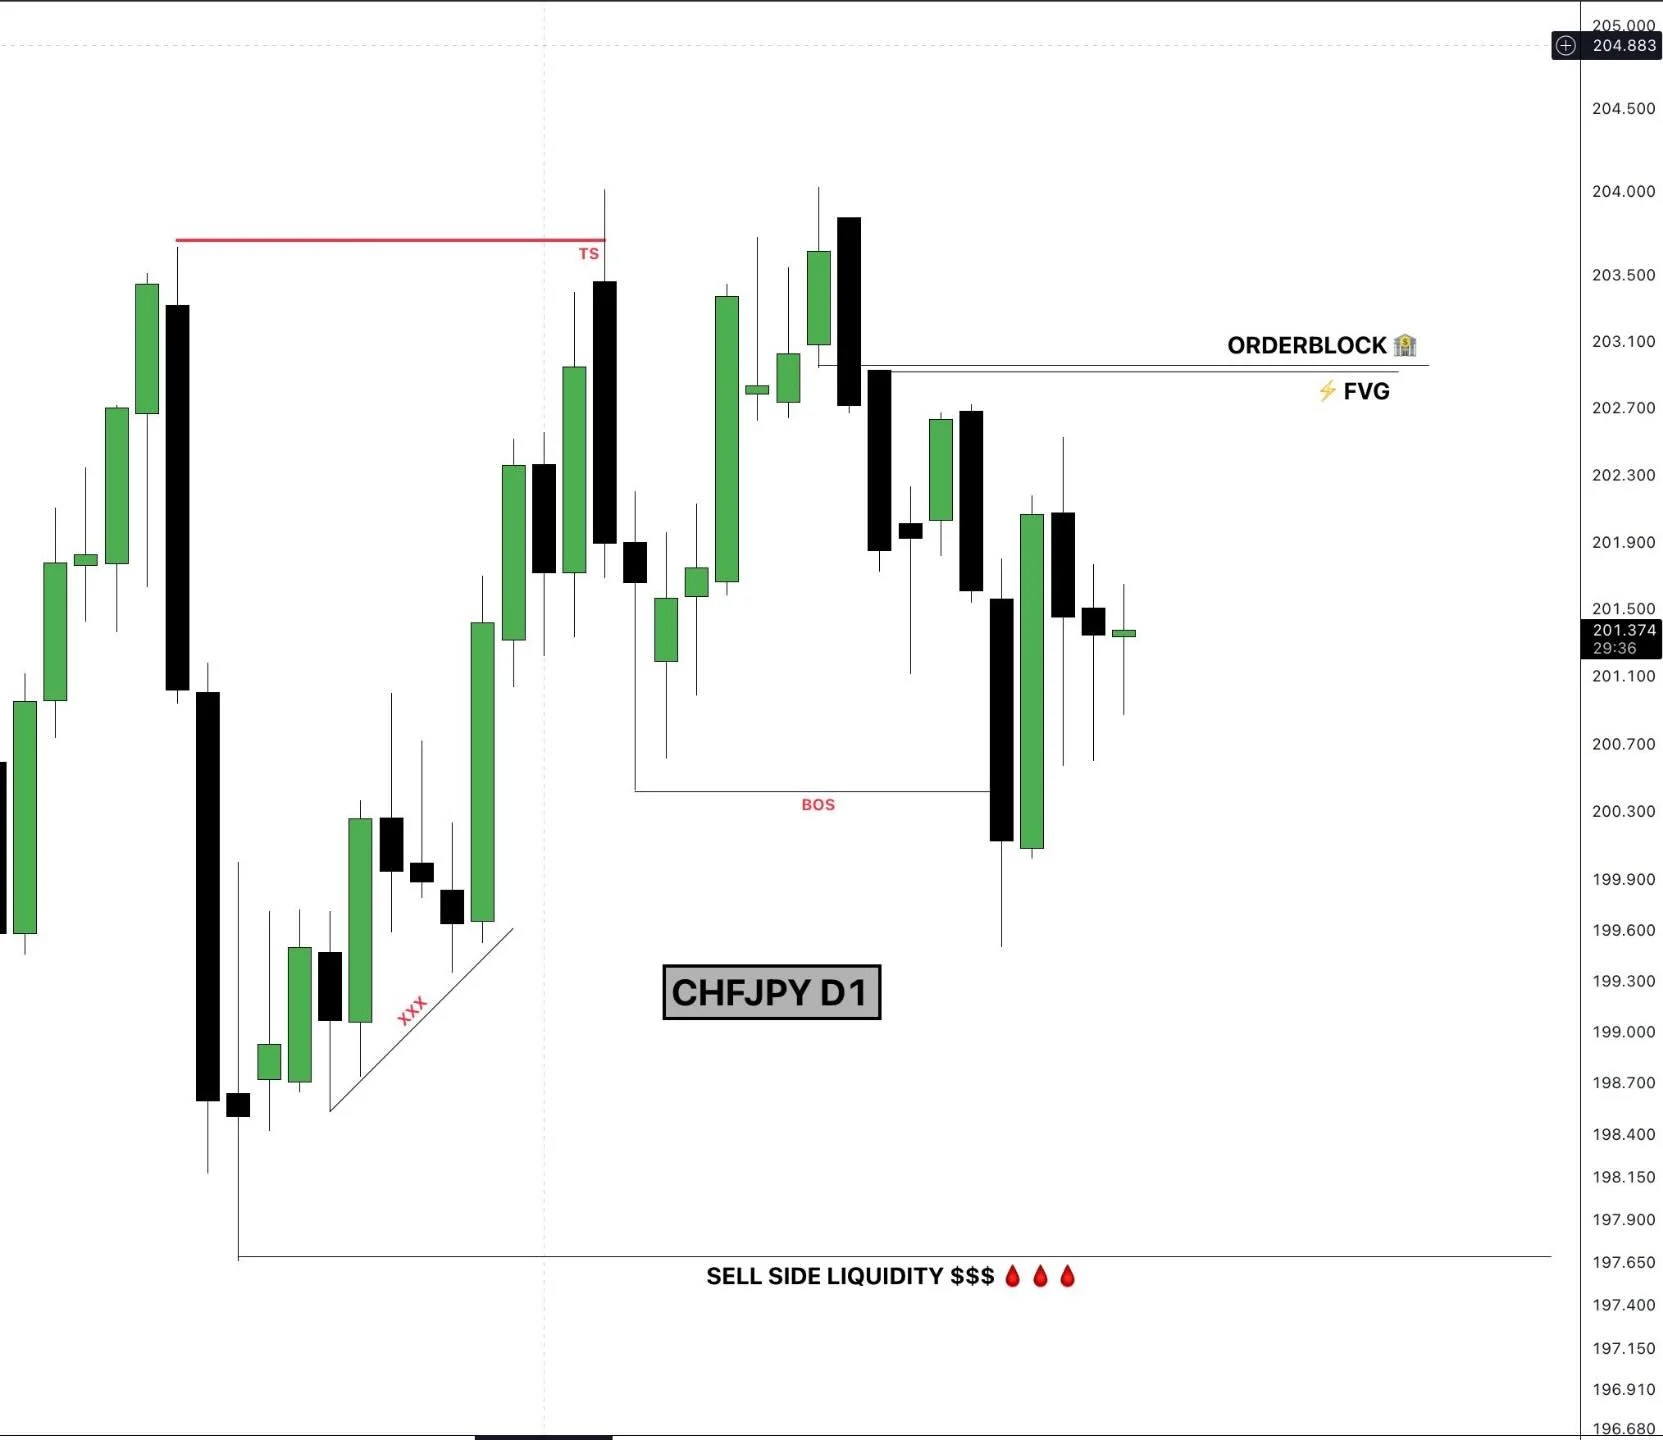
High-Probability CHFJPY Sell Limit Across Multiple Timeframes
CHFJPY SELL LIMIT 203.292 SL 204.154 TP 197.662 📊 CHFJPY Signal Update This CHFJPY signal was created by combining the Weekly, Daily, and H4 timeframes to achieve a high-probability setup. 🔍📈 🎯 Going forward, we will share signals in this structured format so the community...
Dark‑Pool and Seasonality Data Drive Consistent Gold Wins
I’m trading with a different set of data I can assure you I’m applying dark pool data + historical seasonality data + chart technicals Yall favorite traders are focused on fib levels, RSI, volume indicators, macd and vwap I’m not saying...

New Weekly S&P 500 ChartStorm Analysis Released
ICYMI: Weekly S&P500 ChartStorm blog post https://t.co/afMKJCaz1q Thanks + follow reco to chart sources @MarketCharts @topdowncharts @WallStJesus @MebFaber @TheChartReport

Limit Trades to Three Per Market, Trust Weekly Charts
Trading frequency - a commentary from a five decade veteran I follow about 40 global futures markets I enter each year figuring that I might three good signals in a given market over the course of 12 months -- maybe four. That's...

SPX Sell‑off Mirrors Post‑war Bottoms, Reversal Looms
The current $SPX sell-off similar to prior post war declines. Historically, the stock market has bottomed around now both in terms of time and % decline. One final flush to capitulation and reversal? Chart DB https://t.co/tR2zluZcbC
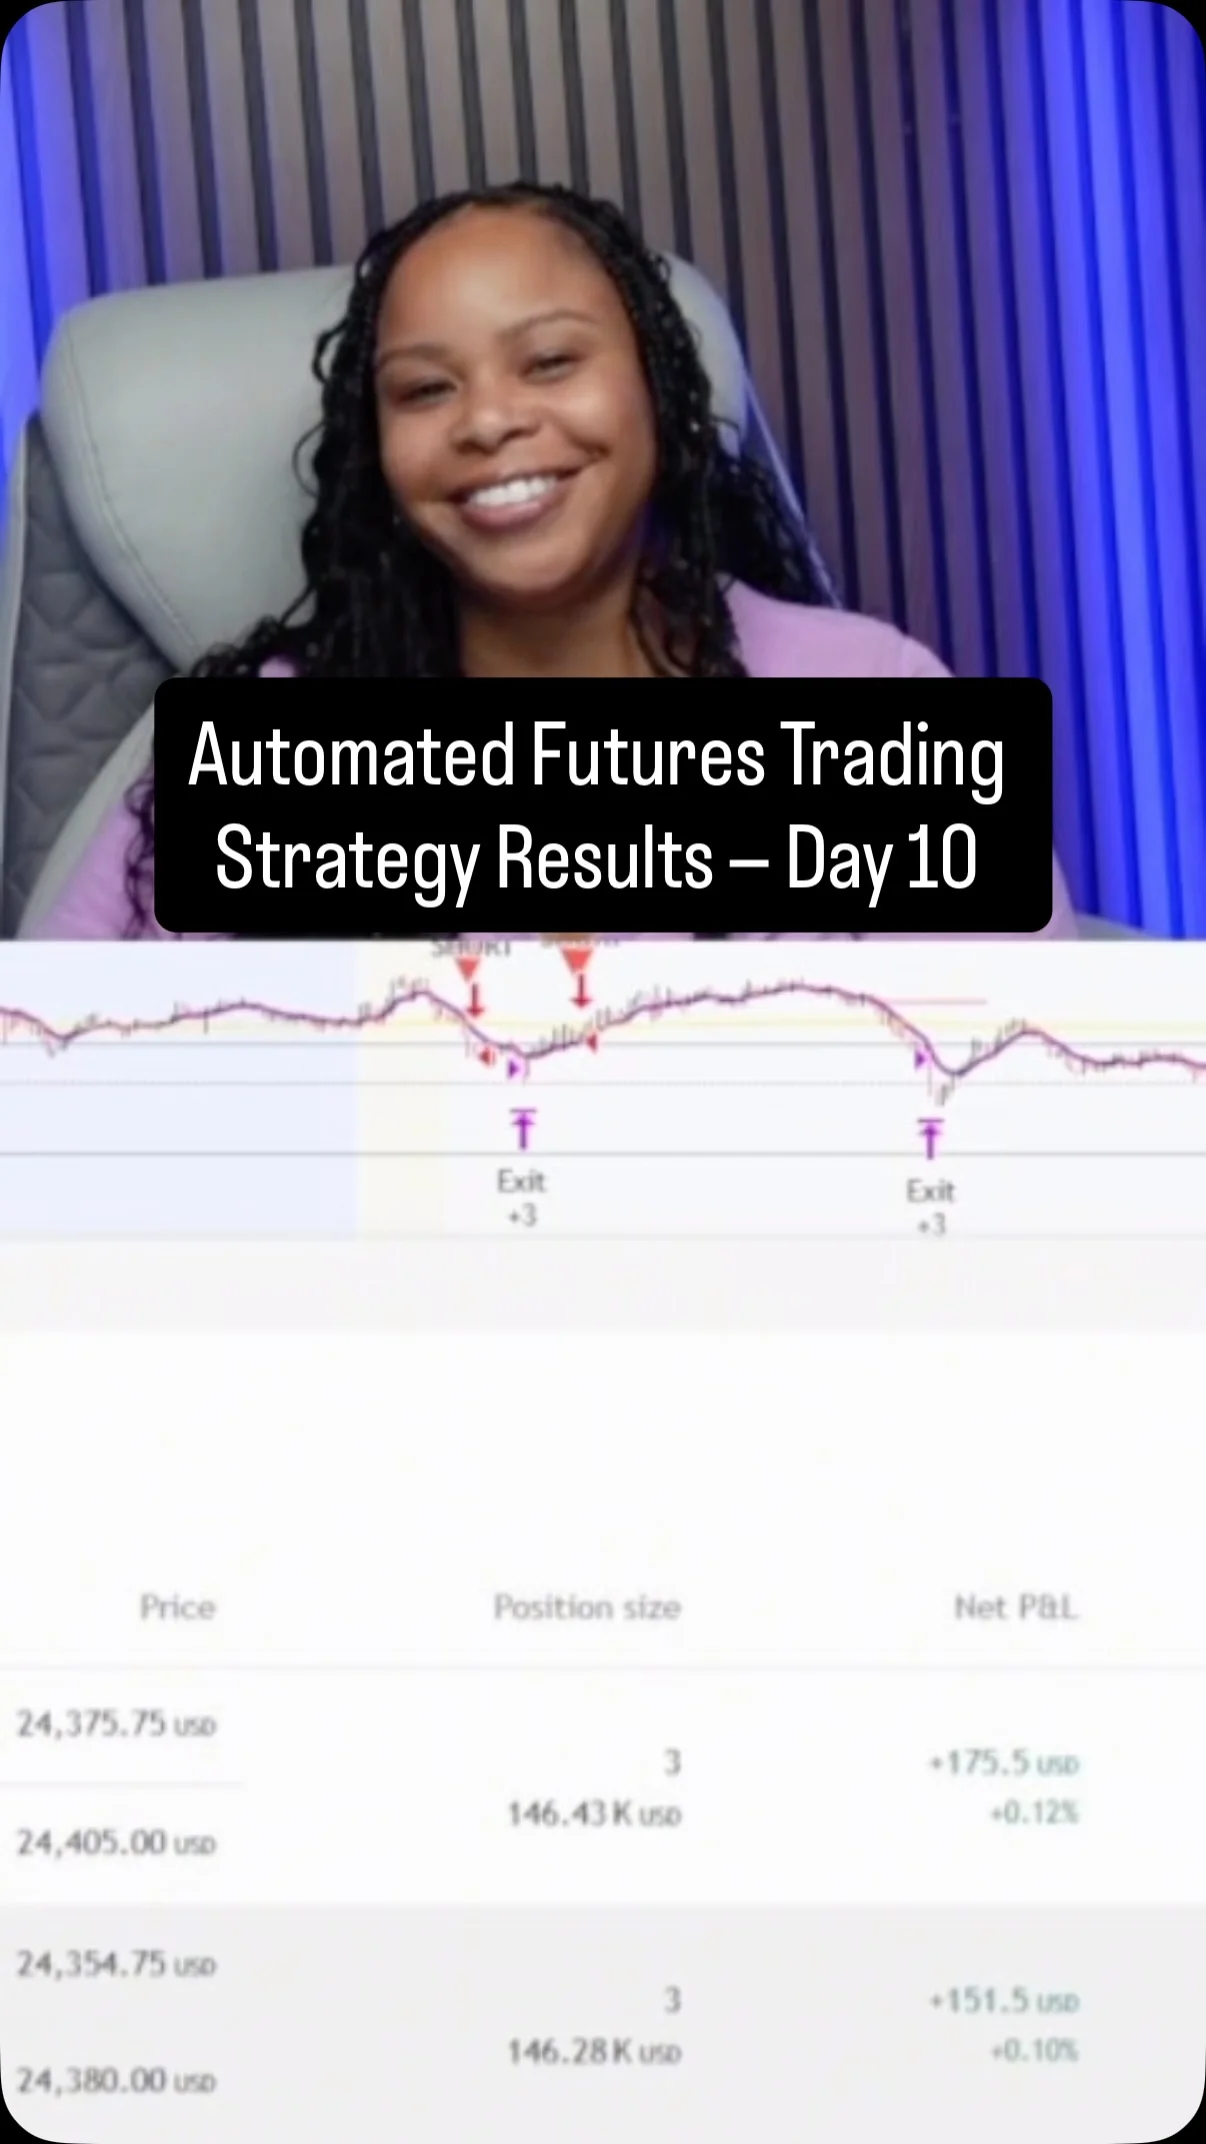
Automated Futures Strategy Delivers Consistent Wins in 10 Days
Testing an automated futures trading strategy on Micro Nasdaq futures (MNQ). Day 10. Two trades. Two wins. +325. This is a rule based trading system built for consistency, using fixed risk management and structured execution. No discretionary trading. No overtrading. Tracking performance on a prop firm style account...

Profit Comes From Price Action, Not Fundamental Analysis
Fundamental analysis -- this is what I think You don't get any profit from fundamental analysis. You get profit from buying and selling. So, why pretend with the appearance when you can go right to the reality of price and analyze...

Silver's Head Shot Hints at Deeper Weakness
The price bar in Silver today is something I call a "head shot." Head shots are often a sign of volume overcoming demand and suggestive of further weakness. I am looking for a tradable bottom in the support zone (yellow) $SI_V...

Breadth Flips, Gaps Traded; $LWLG Spikes 17%
📊 3/25 Post-Market: • Breadth flipped above 5d & 10d MA • Every gap up sold, every gap down bought • SPY/QQQ flat from open — no follow-through • Watchlist names gapped past triggers — $LWLG +17% standout • Playing small, preserving capital • More ideas...

DFL Spreads Near Spot, Strongest Indicator Despite Lower Spikes
Brent crude: - Flat price (white) - Prompt futures timespread (blue) - Dated-to-Frontline (DFL) spread (orange) All off their highs, but DFLs are both closest to the "real" spot market and they're trading nearest the high of the lot. In relative terms DFLs didn't get...

Market Still Bearish; Bottom Uncertain Without Strong Volume
The market's character is still one of a bear market or cyclical correction; strong open, fade into close and major average living below the 200-day line. Before a reliable bottom can be established, we need to see better price and...

Dynamic‑3 Ensemble Remains Resilient Amid Market Turmoil
The Dynamic-3 ensemble has held well during this market turmoil. Link in reply below. 👇 https://t.co/GswnvL4aDS
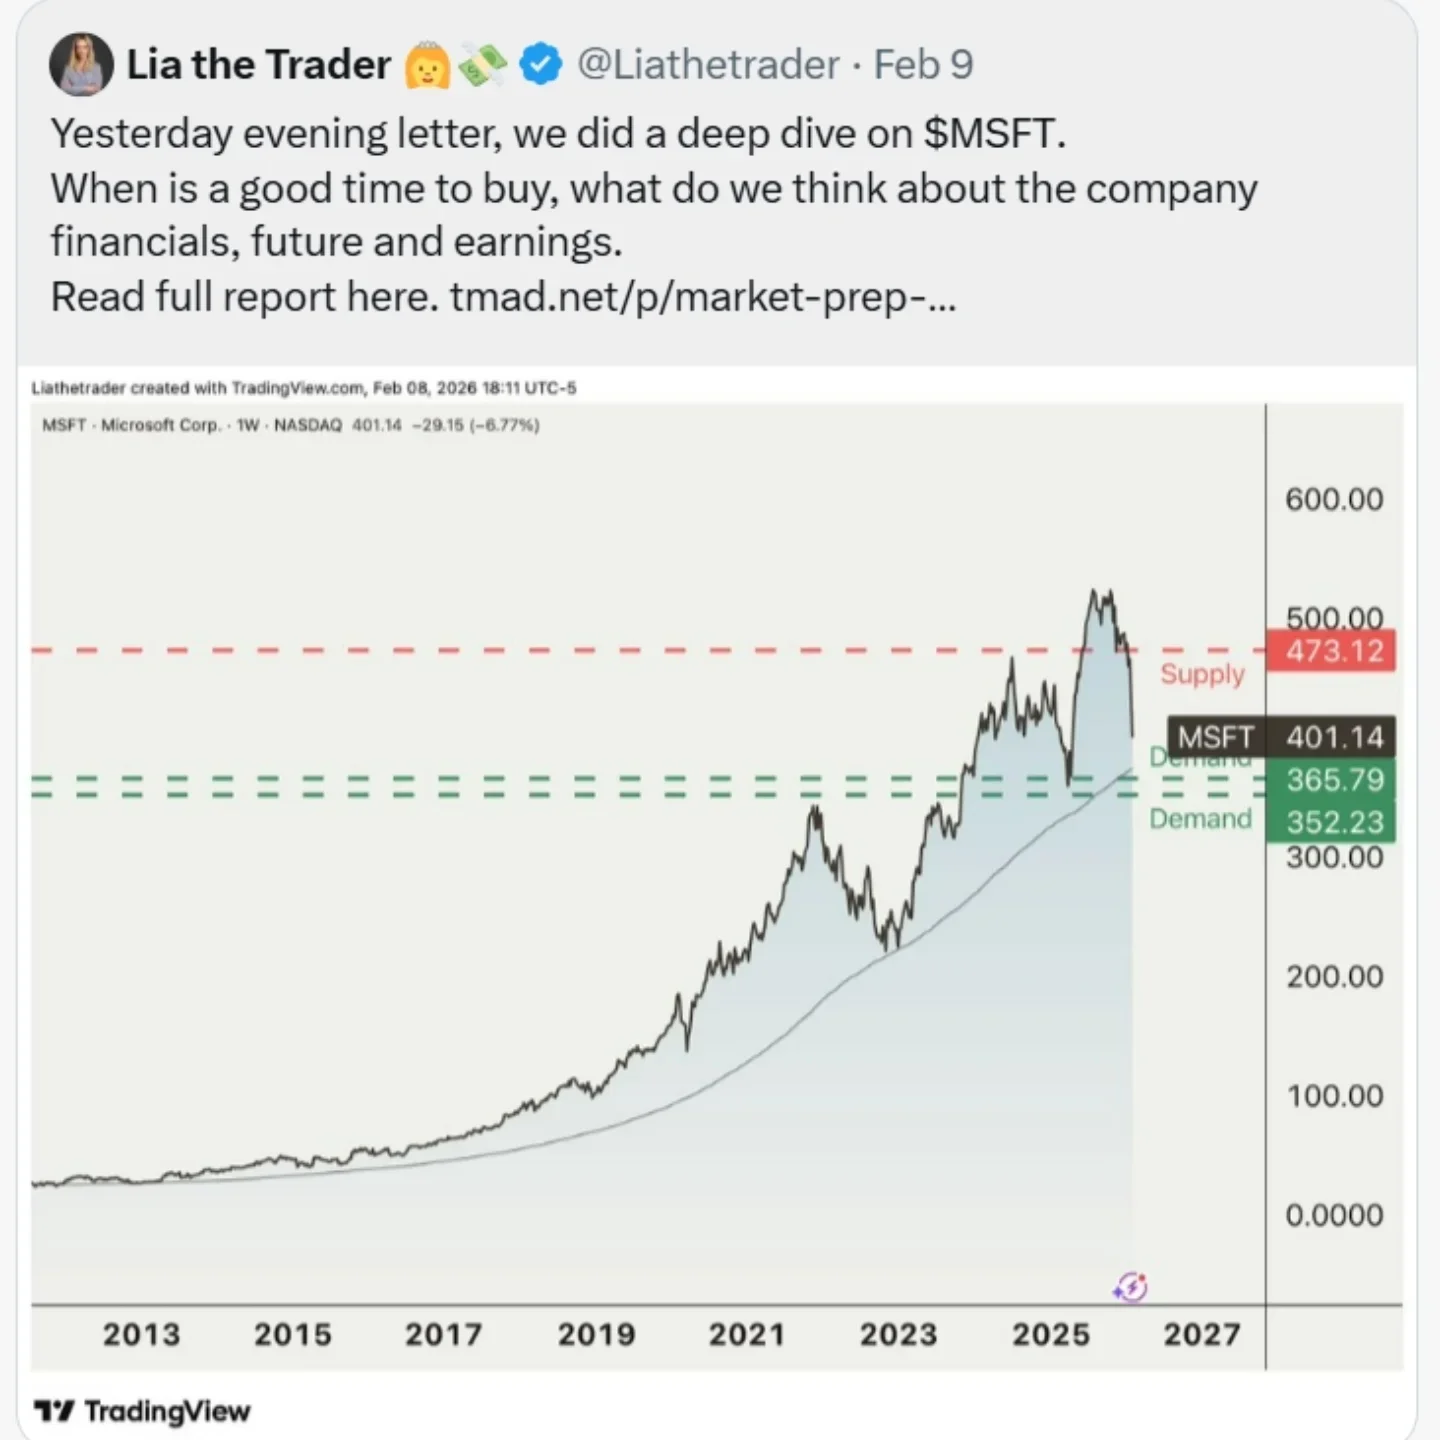
Hold Off Buying MSFT Until It Falls Below $360
I put it in writing on Feb 9. No buys on $MSFT until it bleeds into $380–$360. Why? Liquidity doesn’t disappear. It gets taken. Now we’re under the 200 WMA. Right on schedule. And suddenly—news drops. AI. Nuclear. NVDA. The usual lifeline when things start slipping. This is...

S&P 500 Stays Below 200‑Day Moving Average
4 days below the 200dma for the S&P 500 @stockcharts More thoughts from me: https://t.co/q4uxCqxeRV https://t.co/dXZykXt9ov

Staying Long on Akamai Beats Failing Software Sector
RPK @RPKent nice job staying long of Tech via $AKAM while Software continues to implode
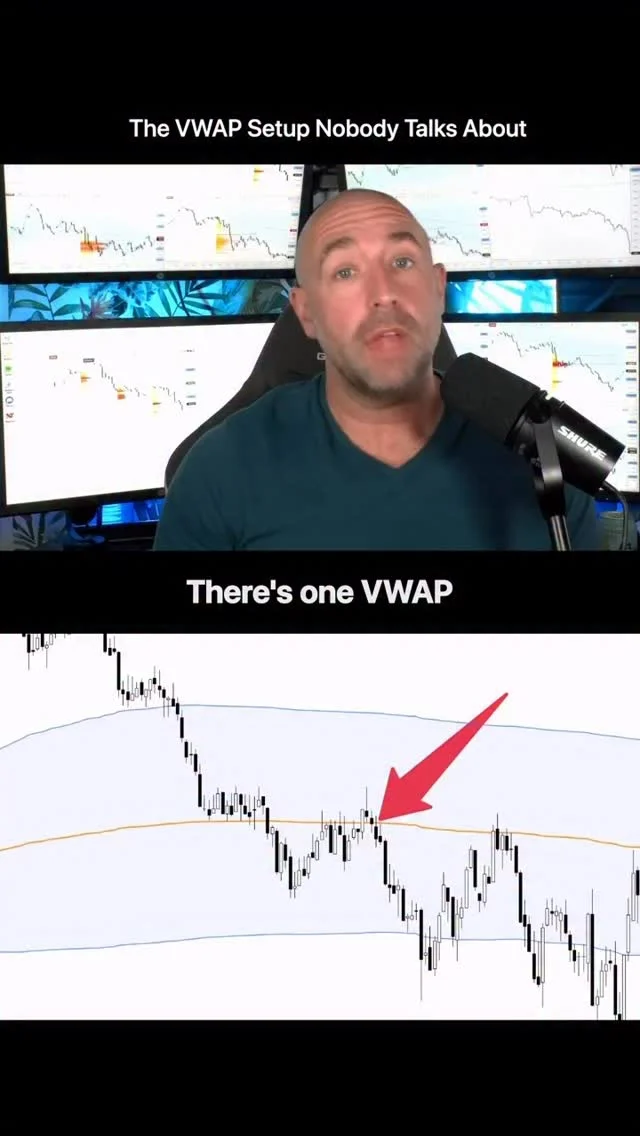
Smart Traders Enter on VWAP Pullbacks, Not Breakouts
Breakouts look exciting… until they fail 🚫 Smart traders wait for the VWAP pullback 📉 That’s where value lives. That’s where I enter. Drop “SETUP” 👇 #TraderLife #VWAP #PriceAction

Oracle Slides, Must Hold to Avoid February Low
Oracle is back to bleeding lower. Needs to hold in here soon to prevent that February low retest. $ORCL https://t.co/MeqTVksAx1

Tech ETFs Show Strong 3‑Month Gains vs Peers
here's a bunch of the key technology $XLK ETFs in @Optuma ratio grid style, allowing for an easy comparison of the % returns vs. the others... #SectorWatch left: 3-month % change right: 1-month % change... $PTF $PSCT $SMH $CHAT doing the 3-month relative...

Oil Below 86 Needed to Sustain Equity Rally
Light Crude Futures $CL_F $USO 2 hour chart on left 30 minute on right Oil had been holding support btwn 94-92 until the 🟠"taco tweet" removed some of the perceived risk in oil It dropped down to the anchor from the beginning of the...

Canadian Banks Rise, US Banks Fall versus TSX Benchmark
4 financials... two Canadian, two American... all vs. the stronger denominator $TSX $EWC market... $CM + $TD - absolute & relative uptrends $BAC + $JPM - absolute & relative downtrends https://t.co/GewGS1r3RL

US Stocks Lag Behind Canadian Equivalents, Raising Opportunity Cost
it's clear... U.S. stocks whether equal-weighted $RSP or market-cap $SPX weighted are trending down vs. Canadian stocks $EWC making an oppoortunity cost for U.S. investors... https://t.co/MKHgNCqmYQ

Commodities Lead Market: Absolute and Dual Relative Uptrends
commodities $DJP vs. U.S $SPX & Canadian $EWC stocks... absolute uptrend + relative uptrends (x2) https://t.co/otOoKew2k3

WIG30 Rises; Add Selective Cyclicals Amid FX Volatility
WIG30 +2.13% led by Basic Materials, Construction & Oil & Gas (Kruk, Budimex, KGHM). Oil slid; EUR/PLN firmer. Risk: FX & commodity volatility. Trade: add selective cyclicals on pullback. — Viktor Kopylov, PhD, CFA More insights: t.me/si14Kopylov

XLE RSI Near Record High Signals Possible Crash
$XLE - The 14 week RSI is currently at 84.76. The RSI's highest level ever was 84.86 on March 3, 2011. 4 weeks later XLE made a major top that led to a 33% crash over the next 6 months...

Chemicals Shine as Oil Markets Falter, Air Products Long
$APD Daily. While paper oil markets are under scrutiny, chemicals are some of the best charts in the market, another issue with Strait of Hormuz choked off. Air Products long setup https://t.co/1km1EcbjOH

Admit Mistakes, Adjust Trades: Avoid Stubbornness
I liked $IBIT for a long, but part of trading is being honest and real. It failed the premarket tops, lost trend and VWAP. Even on the live show I said this is a short setup and i have to...

Corcept $50 Puts Surge $13/Min Before Halt
Corcept (CORT) 700 May $50 puts selling to open $13 a minute ahead of the halt SEC: https://t.co/g4LgvLustp

Open‑positive Breadth Signals Price Above VWAP
Intraday breadth look. Change from OPEN positive vs negative. Price above daily VWAP vs Price below daily Vwap. https://t.co/f4PigHDw4F

10-Year Yield Near Critical Triangle Breakout Threatening Markets
While the 10-year yield broke out of a short term range, the weekly chart below still shows bonds holding within a long triangle (in place since 2022). If it breaks, it will be a problem not only for bonds but...
Calls Surge Ahead of Unemployment Claims Impact
High impact news tomorrow The day trade opportunity happened in the futures market during London session I’m personally not entering any new option positions today due to the fact that high impact news (unemployment claims) However, the data still gets...

GLD Needs to Hold 20‑EMA at $412 for New Trend
Ideally now if you are a short term trader you want a new trend on top of the 20ema (currently 412 needs to hold on any pullback) $GLD https://t.co/k6XiX3VY7G

Silver Breaks Range, Bullish Outlook for Metals
$SLV Daily. Working thesis for precious metals & miners continues to be a wide range into spring months. Here, silver knocking out range parameters. https://t.co/r9lNUdiS1n

Sell GLD Below 20‑SMA, Trail Stop at 400
$GLD if you are trading around the position (420 and 400) then you would sell some into the underside of 20sma, or at least trail stop against 400 (if 400 goes 380 likely comes fast) https://t.co/CIUIcfLSmd

Biotech XBI Surges to 5‑day Highs, Finds Range Low
Market bouncing across the board, but biotech $XBI is standing out here. Strong follow-through [so far] pushing it through 5-day highs. Might finally have found the range low here? (disclosure: long) https://t.co/10IuXq9wlv

Investors Shun Bond Dip Amid Massive Losses
$TLT bleeding $1.2B. $HYG losing $623M. Credit spreads widening. Nobody is buying the dip in bonds. What do they know? $LQD $BND https://t.co/88YFIH3YtD

Slow Gap Fill Signals Potential Breakaway Trend
$SPY would have to decline to 657.03 and $QQQ to 587.93 to fill this morning’s gaps. How quickly the gaps get filled -- if at all – gives us an idea of how strong the underlying trend is… but if...

SPX Tests Resistance, Bearish Trend Still Intact
The $SPX is back up to the top of five-week descending trend channel and the 200-day SMA as combined resistance. What's the prevailing trend for the benchmark index? Bullish or bearish? https://t.co/CyJUytkudU

SPY Breadth Collapse: Only 25% Above 50‑Day MA
Only 25% of $SPY components are above their 50-day MA. The index is hiding a breadth collapse. Don't trust the headline number. $QQQ $IWM https://t.co/gMu0klhbVb

QQQ's Modest Dip After 100 Sessions Signals Strength
Today will be the 100th session since the Nasdaq 100 QQQ peaked. Yet it isn't even 10% off its high. That has tended to be a good sign, esp relative to those times it was deeper into a correction at the 100-day...

20‑Day EMA Highlights Defensive Decline, Offensive Rise
i like watching the sector $SPX relatives using a short-term 20-day EMA... to see inflection points, we want to see the defensive stuff turn down, and offensive stuff turn up... #SectorWatch https://t.co/wK9aSrUKoN

Robinhood Buyback: Dip Play Amid Crypto‑Driven Fragility
Robinhood Stock Rises After $1.5 Billion Buyback as Shares Stay Under Pressure Question: if stock tripled in 2025 then dropped 39% in 2026, is $1.5B buyback buying the dip or catching a falling knife? Robinhood's crypto reliance = structural vulnerability when...

Markets Rally Amid Iran Conflict Uncertainty
🚨 Markets are surging - but Iran says truce, talks NOT viable in current conditions Missiles are still flying Oil is driving EVERYTHING ⚠️Is this a real move or a trap? Here's what I'm watching before I touch anything $SPY $GLD $USO $DXY $EURUSD...

DC ATR Model Justifies SPX Vertical Line
it's a weekly model, and it wouldn't take much to turn it back at this stage, BUT, i acknowledge my DC ATR model for the S&P 500 $SPX deserves a vertical line... https://t.co/Xavd5QMtFy

Will QQQ Hold Above Yesterday’s High? Watch Monday
Can the $qqq get and stay above yesterday’s high? Or fades. If it holds. Watch Mondays high https://t.co/lSsXXal0P7

FTSE100 Appears to Have Dismissed Hammer Pattern
So far it does look like the #FTSE100 has turned off that Hammer 2 days ago: https://t.co/9itZslTJ9y

S&P 500 Re‑tests Oct 10 Low Amid Pullback
left: S&P 500 $SPX pulled back and in the neighbourhood of the lows from the Oct 10th "biggest bar against" right: S&P/TSX $TSX https://t.co/kzsEuflLan