
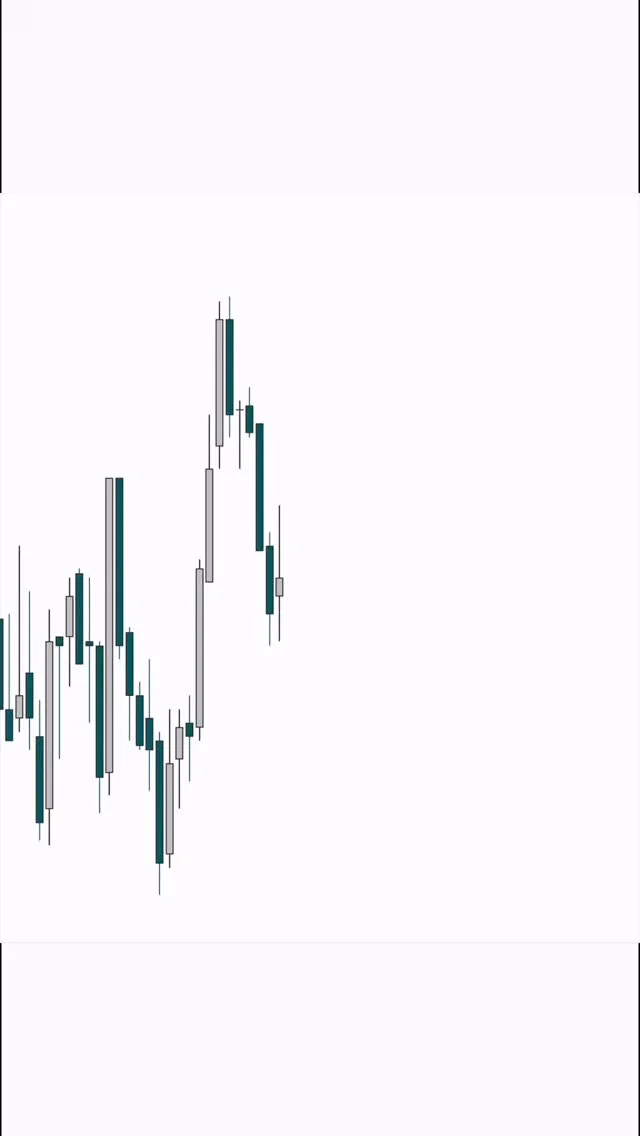
STX Poised for Major Breakout From Triangle Pattern
$STX close to a major league breakout to resolve a symmetrical triangle or "coil" pattern. Price has been in an equilibrium since end of Jan. A breakout to the upside could change the picture big time. https://t.co/KNFuckXlkp

Homebuilder Stocks Falter, Signaling Economic Weakness
$XHB Daily. Homebuilder (& home construction in $ITB ETF) stocks remain weak, rejected at 20-day m.a. today (orange line). Long-term looking like major tops, too. Poor sign for economy/consumer https://t.co/bZnRRpRU33

All Major Assets Below 20-Day Trend, Awaiting First Breakout
equal weighted S&P 500 $RSP, gold, long bonds $TLT and bitcoin #BTC $BTCUSD all below the 20-day... stocks and gold tried, which is the first to close above? https://t.co/p4tm7ae6O8

SPX Bounce Success Isn’t Tied to 200‑day Average
The $SPX doesn’t need to immediately reclaim the 200-day moving average for this to qualify as a successful bounce attempt. In fact, the reflexive move off the lows over the last few days is NOT the most important part—these sharp...

Dollar's Rise Tied to US Rates, Near 100 Resistance
With rate cuts being priced out of the market, the dollar index has strengthened from 95.6 to 100.5. I think the dollar’s recent strength has more to do with US rates than with geopolitics, and my guess is that the...
Patience Outside Liquidity Traps Gives Trading Edge
The market didn’t beat you. You just entered before the move was ready. Liquidity is always taken first. Then the real direction unfolds. Most traders react inside the trap. Smart money waits outside it. Patience is not optional in trading. It is the edge. Save this if you...

RKT Aims to Close Above 10‑EMA and 21‑MA
$RKT daily chart watching for a close over both 10ema and 21ma daily. Still own full here https://t.co/fyiPWdwoxl

QQQ Mirrors 2006 Pattern, Bottom Likely in May
$QQQ - I've scanned past price patterns to compare it with the price action since the late October top and the year that has the highest correlation is 2006. If current action continues to follow the 2006 script QQQ will...

Crude Overbought Signals Rising Downside Vulnerability
Prior to the President’s address, the NDR Hormuz Stress Index began showing early signs of easing. Crude markets are tight, overbought and sentiment is excessively optimistic. Overbought conditions have historically seen low or below average returns but not necessarily outright...
VFS Surges; 6K May‑5 Calls Bought Today
VFS quietly on an insane run last few weeks, 6K May 5 calls buying today

USD/CHF Surges to Yearly High, Near Breakout Levels
Swiss Franc Forecast: USD/CHF Rally Hits Yearly High- Breakout Levels in Sight https://t.co/eNkhFNaLMN Short Video Breakdown: https://t.co/hWbiKrYO6e $USDCHF Weekly Chart https://t.co/bxIE9pEJrt

Bullish Cup‑Handle Signals Intrepid Potash Breakout Above $45.50
$IPI Daily. Cockeyed bullish cup and handle setup for Intrepid Potash in context of uptrend, as fertilizer issues figure to persist via Strait of Hormuz. Long setup for next week above $45.50. https://t.co/vLPTlUXggm

10‑Year Yield
Another big development last week was that the 10-year Treasury yield rose sharply to 4.48%. The chart below shows that the yield has continued to coil in a large triangle, and could be on the verge of a break-out. Meanwhile,...

Bitcoin's Next Cycle Low May Set Yearly Low
$BTC - The next 11 week cycle low is due on the week of April 20-26. The only question is if the coming low will be higher or lower than the February low? Given that Bitcoin started to underperform stocks...

Buying Opposite‑direction Short Options = Long Volatility
Q: if you buy short-dated calls after sharp sell offs and buy short-dated puts after rips, are you effectively long or short vol? Asking for a friend :-)

SPX Rallies but Remains Under 20‑day Bearish Trend
We have some whiplash on time frames: the $SPX closed out its worst month in 12, we had the best single-day rally in 10 months Tuesday and the week is currently on pace to be the strongest in 17. All...
TACO Market Delays Pain, Recovery Expected by July
Feels like the market shifting of the goalposts on TACO is "Even if April will be bad, it'll be fine by July."
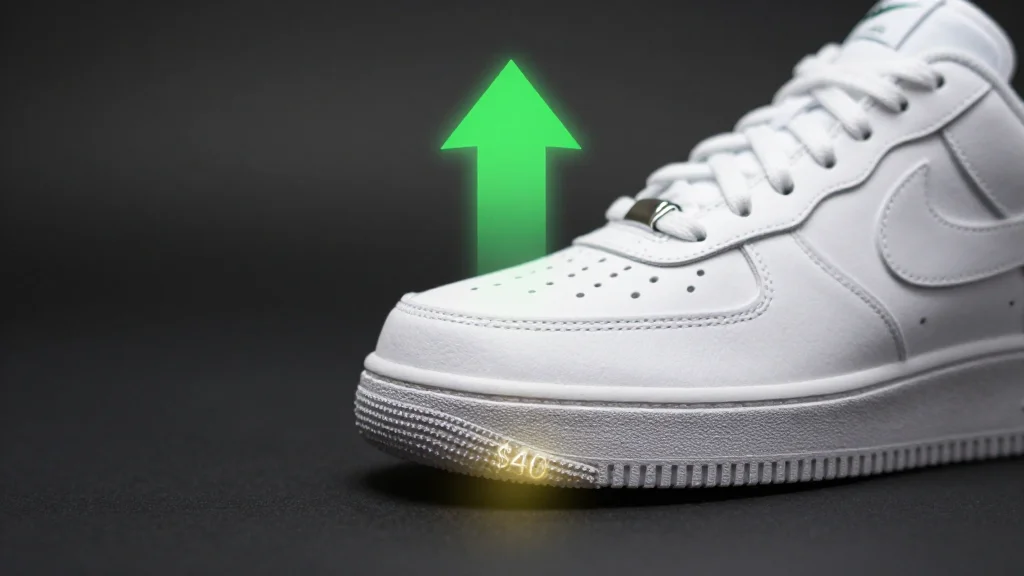
Big Money Finds $40 Comfortable for Nike Stock
$40 appears to be the level big money is comfy buying the dog $NKE (minus the premium raised via the put sales)

Oil Price Drop Pulls BATL Lower; Follow the Trend
When Oil $USO goes down, $BATL and its cohorts really trend down. The trend is your friend. #tradingstrategy #TradingCommunity https://t.co/dviMcfgDWp

SPY Holds at 645, Most #630Club Picks Turn Green
$spy $645 held and most names we went over in the #630club went green. Nice tactical morning. Cooler heads prevail

Take Profits, Surf, Then Re‑enter Before 3 Pm Rally
Probably should sell what I bought on the open for a fat gain, go surf for a few hours and come back to buy back in before the 3pm peace rally…

Trade with a Plan, Not a Marriage—Use Stops
If you are a short-term trader, have a plan, but don't marry it. Markets are dynamic — let new info change your view (price). When you're in a hole, stop digging. The second emotion creeps in, put in physical stops,...
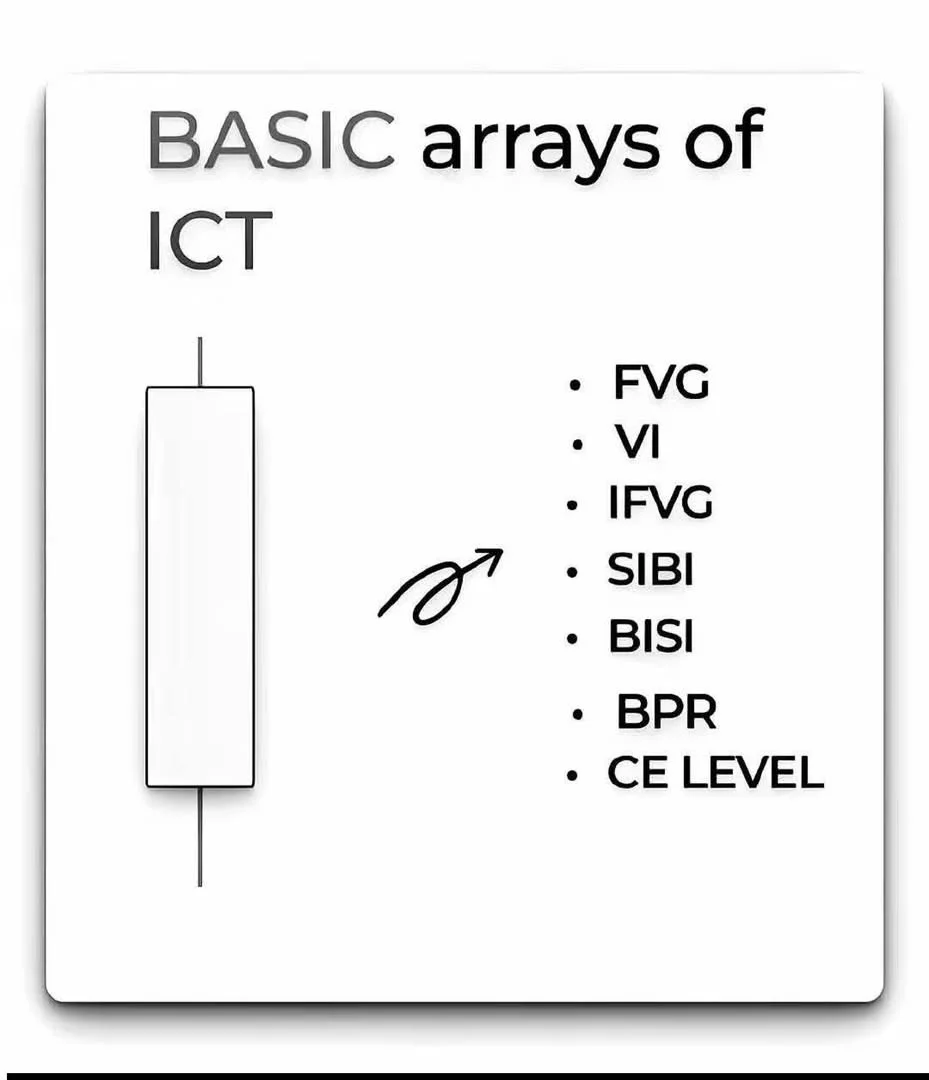
Key ICT Imbalance and Price Range Indicators Explained
BASIC arrays of ICT 📊 FVG+ 📊 VI- volume imbance 📊 IFVG-inversion fvg📊 SIBI- Selling imbalance📊 BISI- Buyside Imbalance📊 BPR - Balance Price Range📊 CE- Consequent Encroachment 📊

Tech ETFs Show Broad Bearish Trend Across All Timeframes
technology $XLK stocks vs. S&P 500 $SPX on 4-time frames (all are bearish)... #SectorWatch top right: 8/20EMA top left: 20EMA/50SMA bottom left: 50/200SMA bottom right: 13/34-week EMA https://t.co/1szqnbsHfz

5‑Day MA Determines SPY 30‑Min Direction
30-min $SPY POSSIBLE road map with the 5-day ma being the key. Downtrend, gap up above the 5-day; gap down that holds the 5-day; then the key is whether the 5-day holds and acts as support. https://t.co/G6fBqhbGMy

TRACE Reloaded Reveals Hidden Pressure Behind S&P 500 Moves
There’s a code behind today’s market, and you’re ready to see it. The TRACE Reloaded event on April 9th uncovers the hidden pressure driving support, resistance, and volatility in the S&P 500, with more precision than ever before: https://t.co/hA4hvasgi0

SPY Bounces Near 5-Day MA, Market Uncertain
So we got the first half-hour bounce, the $SPY BOUNCED near the 5-day ma. Now what? https://t.co/Ya4nZJd5CG

Key Support Holds: Buy Dips or Expect Lower
📺 IF THESE STOCKS FAIL, NEW LOWS ARE NEXT In a weak market, focus shifts to relative strength. Names like $FSLY, $LITE, $SNDK, and $WDC led the last move, but now the real test is the pullback. If these stocks hold...

Retail Traders Dump Speculative Assets After October Peaks
IT’S SO OVER -Retail traders have been piling into $SQQQ (3x short Nasdaq 100) and $SGOV (cash) over the past two days -Call volumes traded peaked in October -Pretty much every speculative asset of note peaked in October https://t.co/ruhoAuTrha https://t.co/OAqKObkeTF

Market Bounces, Now Awaiting Next Setup
Market gave a two day bounce to work off oversold. Now we sit and wait for the next setup or go play and take a four day weekend.

Buy NDX if SpaceX IPO Gets Canceled
Here's a simple signal that will work great. Buy NDX when SpaceX cancels its IPO. https://t.co/RUszD8xRxZ
Gap Down? Short Traders Can Lock Profits
We walk into a gap down day. Gap downs offer an opportunity if short to take some profits out of the market and adjust stops.

Tesla Misses Q1 Delivery Targets, Tests 370 Support
$TSLA trying to bounce off $365 after numbers Expecting the 370-71 area to be telling fi it retests. https://t.co/WPU5fwQ0Hg

20‑day MA Below 200‑day Signals Confirmed Downtrend
$SPY - It doesn't need to be overly complicated but a 20 day MA crossing below the 200 day ma is just a very simple downtrend confirmation. FYI - Downtrends are not bullish developments. https://t.co/NuNLLKNEHD

Value and Growth ETFs Recoil to Prior Breakouts
left: value stocks $IVE weekly right: growth stocks $VUG weekly both pulled back to prior breakout spots... https://t.co/QKoBNTlNJo
Live: Multiple Sell Signals Target UTZ and HELE
We're LIVE with plenty of SELL Signals from shitty Utz Chips $UTZ to Helen of Destroy $HELE

Mean Reversion Signals Deliver 44% Bonus Return
Mean reversion (MR) update for subs. There are new signals. Since inception: -#ES_F bonus MR +44.7% (May 21, 2025) -Bonus MR+Momentum: +1.8% (October 9, 2025 -Main MR strategy: +38% (June 27, 2023) Links in profile (Daily mean reversion signals) 🔽 $GLD $TLT $QQQ $SPY https://t.co/Go0RBpLqrK

Current S&P 500 Fibonacci Retracement Levels Revealed
Here are your Fibonacci retracements from this year's high and low in the S&P500 https://t.co/TTq56SFUSP

Know Who’s Trading: Break Down Market Participants
I think this is a useful teaching moment, so I’ll try to expand on it a bit. Over the last few weeks, I’ve heard a lot of statements like “most participants are short,” “everyone is hedged,” and “the pain trade is...

Equity Volatility Undervalued as Futures Slide 1.5%
The equity vol is still asleep relative to the oil move. The 0DTE SPX straddle is just $55 (85 bps). Futures are down 1.5% overnight. Something ain't right. https://t.co/kmBuM66ebE

Buy Energy, Use Pump Puts Amid Market Divergence
In today's Early Look: "Long Energy & Pump Puts" While the Tourist crowd was busy chasing $SPY and $QQQ to lower-highs yesterday, the fractal was telling a different story. That's why I opted to buy Oil/Energy and introduce what I'm calling...

Weekly INsyncFocus Checklist Tracks Short‑Term EMA Trends
sharing our weekly #INsyncFocus checklist as we seek to keep that #marketpulse through the ups and the downs... (note: these mostly refer to short term trend 8/20EMA conditions) https://t.co/TbVg6mrWfh

Draw Support/Resistance Consistently, Not by Guesswork
Support and resistance without guesswork. Use consistent repeatable levels. If I erased every support and resistance level from your chart… could you redraw them the same? I’ve asked this question to hundreds of traders. 90% say no. Not because they’re bad traders. But because the way...

Analyzing Today’s Market Swings and Future Outlook
My thoughts on today’s drop in stocks, gold, rally in oil and US dollar What comes next https://t.co/vJEqtVN6Ej

Spot Resilient Stocks Early Using 50‑Day Trends
during a market correction, being aware of the stocks that are faring the best (didn't/don't fall as much) and/or are perking up first is an important exercise... i.e., which are > 50-day, and so forth... also suggest zooming out a...

Germany Opens ~2% Lower After Borderline Short‑side Layup
GERMANY: borderline layup on the Short Side on green yesterday, opens down almost -2% https://t.co/3F9bLy8EUC

Gold Volatility Persists—Plenty of Time to Exit
Gold's Volatility didn't leave the F-Bucket either - there was plenty of time to get out and/or reduce your position https://t.co/0tctCT4A1x

IWM Pump Puts: Clear Bet on Russell Volatility
Buying Russell $IWM Pump Puts was an obvious play with Russell Volatility (RVX) in the F-Bucket https://t.co/IQnqgOdKmH

Watch $SPY Gap Fill Near 650 Support
First support, very short term, gap fill $SPY near 650 (which will also be S2) Even if you don't trade it, watch it as a tell https://t.co/fjOjrzHvfR

Three Decision Paths for Cave Fill Strategy
2 ways of looking at "cave fill" area. (decision points). 1) initial support, 2) partial test into, or 3) full cave fill.... stay tuned...same bat channel.... https://t.co/bafwPNKVz2