
Oil Holds Firm, Eyes Higher After Sideways Base
$USO Hourly. While equities stage another mixed, grinding, hopeful bounce, oil is just not giving up the ghost on hopes of peace. Still firm. Sideways base now pushing higher https://t.co/k8YTwKadQY

Clean Energy Stocks Outshine Oil: Technical Take
Think Oil Is the Only Energy Play? Think Again $XLE $USO My @stockcharts technical take on clean energy stocks... $ICLN $FAN $TAN https://t.co/fNGYwq5vMx https://t.co/AnqW7SYd3c
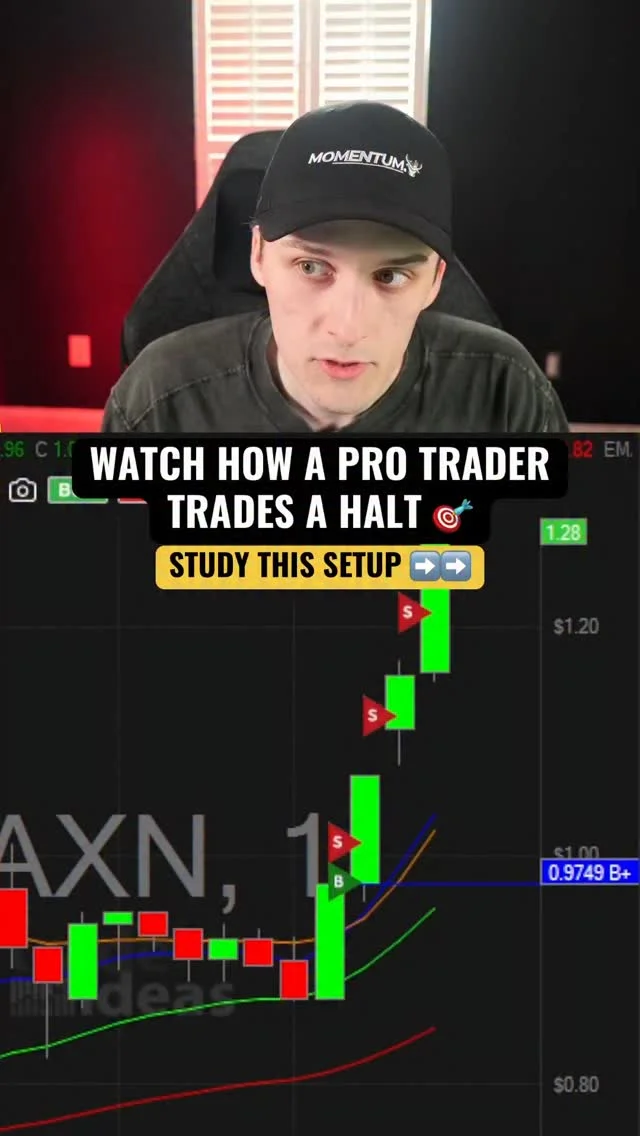
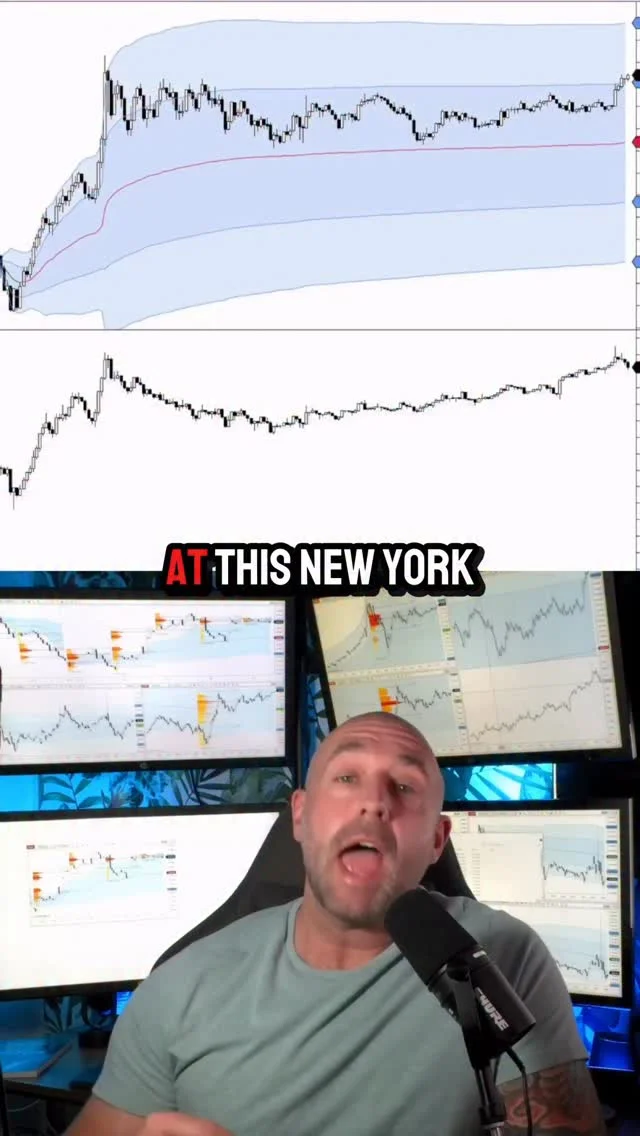
Watch a Pro Trader Master Trading Hal
Watch how a PRO TRADER trades a HALT. This is a setup you NEED to study over and over. #howtotrade #daytrading #momentum #tradingeducation #stockmarket

Tesla Drops to New Lows; I’ve Stopped Promoting It
Some ask me why I don’t talk much about $TSLA anymore. It moved to the bottom of the “go to list” months ago. Maybe those who love to short stocks in Down trends are having success here. Now,...

Dow Breaks Channel Resistance, Lacks Momentum Amid Thin Liquidity
The Dow has moved through the resistance of the past 6-week descending trend channel, but it hasn't really gained traction on the break. Thinned liquidity has undermined any productivity from the break itself. Currently stuck between a very narrow 200 and...

CZR Range Tightens, Poised for Near‑term Upswing
The range is tightening in $CZR and looks like it could be getting ready to continue higher in the near term. No position for me yet, worst case stop would go below last weeks low ⬆️ chart from @marketsurge https://t.co/9Ts5Gt7uts

TRACE Flags Ceiling as S&P Rally Stalls at 6,650
Market rips, TRACE flags the ceiling. On March 23, the S&P’s sharp rally in the morning stalled out at heavy resistance near SPX 6,650. TRACE + HIRO showed dealer selling taking hold, and the market faded lower. Join us April 9th...

Today's Top Gainers vs Laggards: KTOS, STX Lead
Session notable winners: $KTOS $STX $MSTR $APP $STM $MPWR $AFRM $VG Losers: $PAYP $DDOG $IVZ $RBLX $NTNX $ALB $STRL $SMCI

Utilities Lead Signals Risk‑Off; Lag Signals Risk‑On
$JOJO uses utilities sector performance relative to the broad market as its rotation signal. When utilities lead, risk-off. When they lag, risk-on. Simple. Systematic. Battle-tested. https://t.co/encZcxvmOt

Live Data Deep Dive with Chart Master Carter Worth
We're LIVE looking past the headlines and looking at the data with the Chart Master himself @CarterBWorth 📊 WATCH: https://t.co/A8YHNJp9zT https://t.co/yqRC7qzRZK

Small Position, High Upside Potential on $FLY
$FLY Only put 1% of my portfolio in here this morning but it looks like it has some room to run. Pretty volatile chart. Still needs a strong close sometime this week as well. But nice upside potential. https://t.co/VnGNlRhSDm

QQQ and SPY Near 20‑Day SMA, Hinting Bottom
both the $QQQ and $SPY flirting with the 20 day SMA's. early. A close over would be add to the case for a bottom last week.

Bullish Nifty vs Bearish Trump Sentiment: Who Prevails?
Nifty Charts are Bullish But Trump's Social is bearish - who wins? chart... https://t.co/p4x8P8EigB via @YouTube

QQQ Tests 20‑Day MA Amid Iran Deal Hopes
$QQQ Daily. Early test for Nasdaq of 20-day moving average on hopes for some kind of Iran deal. Also remains below 200-day m.a.. Oil staying firm, too. https://t.co/HSiCYzXfhZ

Risk Management Beats Hype: Learn From AMC Collapse
I can't believe $AMC was $390 a few years ago and now below $1 Shows you the importance of having an invalidation level and managing risk at all times. Daily we had a nice momentum set up for a pop but glitchy...
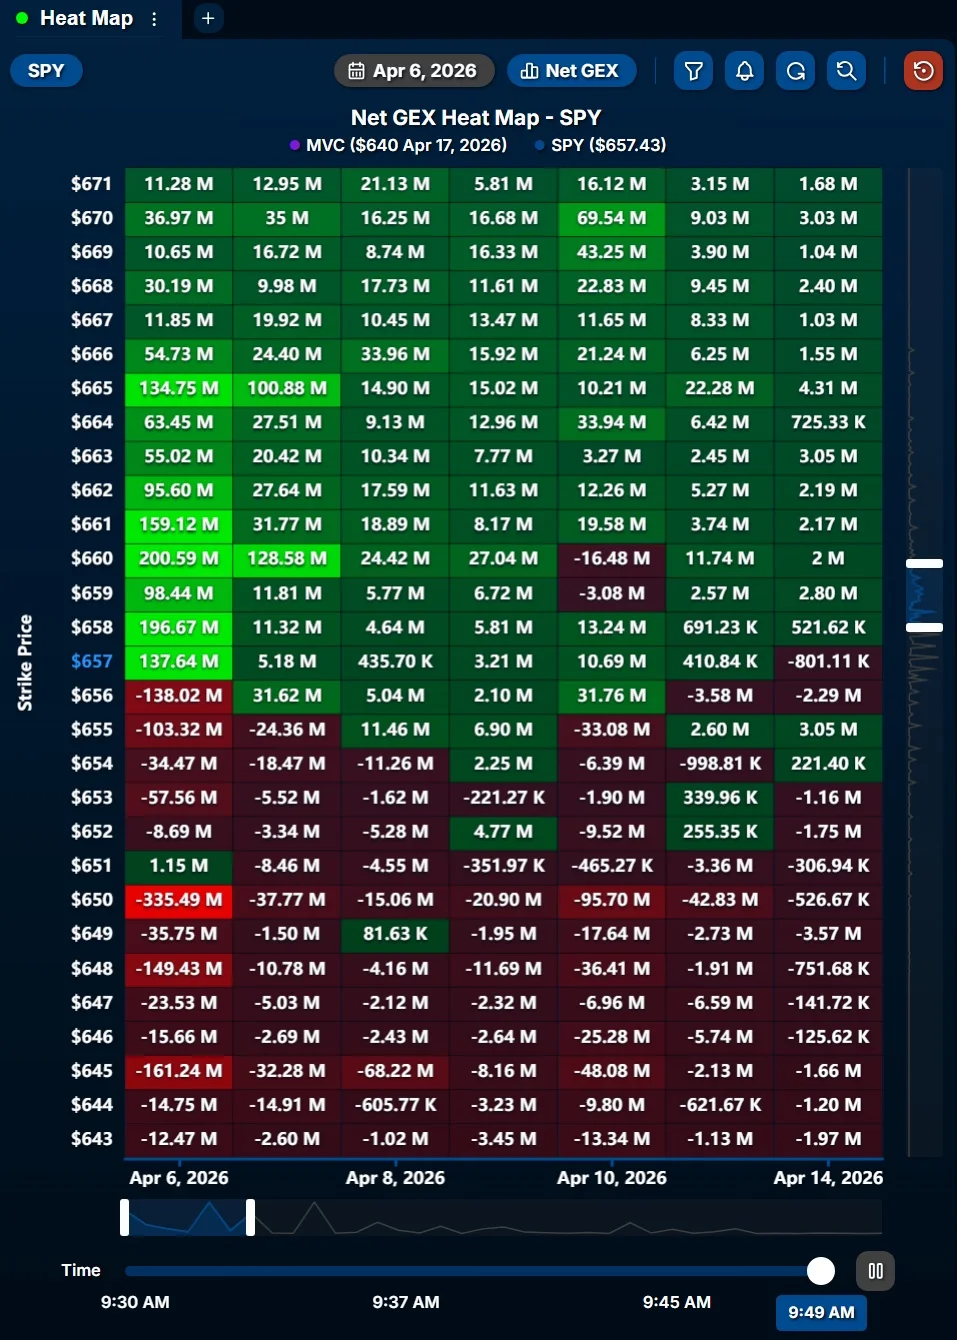
SPY Gamma Exposure Shows Upside Bias Near $660
$SPY Gamma Exposure update: There's quite a bit of positive exposure overhead, especially around $660. I have $655-$660 as the current range, biased towards upside today. We'll see how things change, especially if a new catalyst comes in.
Q3’s Top Performer Isn’t Tech, Chart Shows
CHART OF THE DAY: Quad 3 Has a Winner - And It's Not Tech https://t.co/J5odr45xlt via @hedgeye

MACD Bullish Crossover Signals Safe Entry for SPX
you know i like to lean in the direction of the #MACDhist and like our "Is It Safe for New Buying?" checklist, you can see here, the daily #MACD bullish crossover (left) and the weekly tick upwards on #MACDhist... $SPX...

Market Fell without Expanding New Highs on SPX
quite simply, we just didn't see an expansion of highs as the market fell... $SPX https://t.co/G95i8hvEF5

Breadth Signals Bounce, Structure Confirms Bear Rally
Breadth is screaming a bounce, but structure says bear-market rally. Zor's Daily View — April 6, 2026 ☑️ Breadth: ALL green. Short + medium term. ☑️ Swing Posture: RISK ON (STRONG) ⚠️ Market Regime: BEARISH (NASDAQ + SPY) 🟢 IWM: Only index with BULLISH regime Transition...

Early Green Leaders Outperform Weak Indices
📺 RELATIVE STRENGTH IS LEADING THE TAPE With the broader market struggling around key moving averages, select groups are clearly outperforming. Optical names like $AAOI and $LITE, space stocks such as $LUNR, $PL, and $ASTS, and memory plays like $SNDK and...

SNDK Shows Relative Strength—Consider Trim and Trail
$SNDK gave plenty reasons last week to tell u it’s still showing relative strength to own if u take names. Trim and trail https://t.co/z6pc5WgKR9

21‑Day Hold with SPX Below 200‑Day Signals Top
When a name holds the 21 day while $SPX is below the 200day that’s when u know it should be the top or it go to list. Nice follow thru to trim some if u took it long Thursday https://t.co/hgmzVaiBIa

Monthly MACD/PPO Red Bars Signal Upcoming Trouble
Chart referred to by @StocktonKatie on a recent @excessreturnpod. Monthly $SPX with percent price oscillator (PPO). Katie used MACD. I prefer PPO over long time periods, but same message. Nothing bad happens until monthly MACD/PPO is red. First red bars...
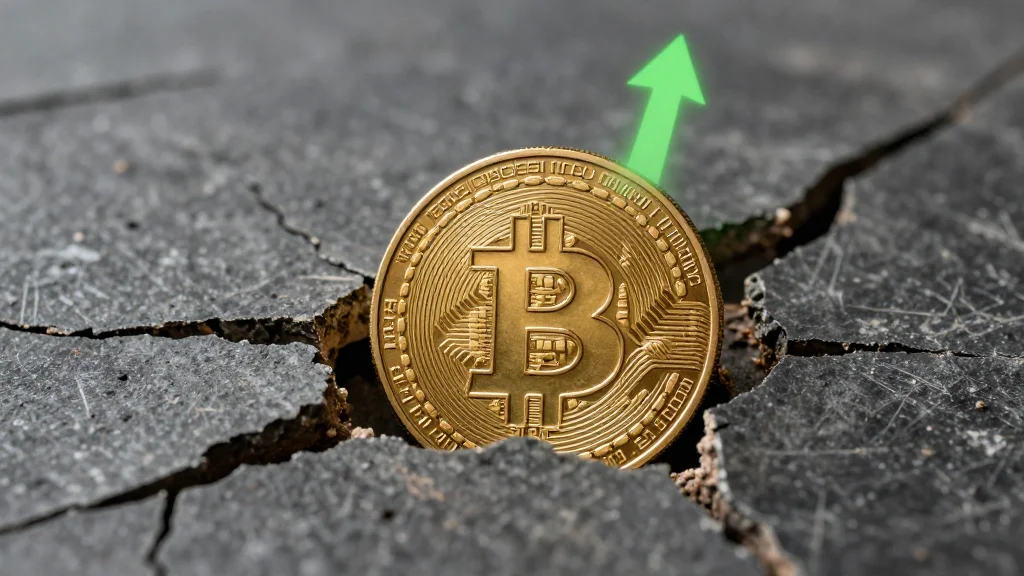
Ceasefire‑driven Bitcoin Rally Triggers Massive Short Squeeze
Bitcoin jumped 4% to $69,733 on a 45-day ceasefire proposal between the US and Iran. Nearly $200M in shorts were liquidated in 24 hours — a 3:1 short-to-long ratio. Traders came back from Easter positioned for more downside and got...

Prioritize Data, Plan for Every Scenario
The Bottom? - What to look for / focus on the data. - Have a process and plan for all conditions... 🔗Post in profile Good luck to all this week. https://t.co/Ie0gTW3rlG

ETH Strength Signals Major Altcoin Rally, AI Leads
If this momentum on $ETH continues to show strength, then I would assume we're going to see strength on all #Altcoins. Constant higher lows, and that's a strong indication of a reversal of the markets to take place. Strongest assets? The AI protocols. However,...

S&P Short‑Range Oscillator Nears Neutral After Oversold Stretch
The S&P Short Range Oscillator is approaching neutral after being oversold for several days -0.52% vs. -1.53%. $SPY @jimcramer @tomkeene @lisaabramowicz1 @ferrotv @business @SquawkCNBC @BeckyQuick @carlquintanilla @pisani

The Pain of Buying a Failed Breakout
This is what I show new traders when they ask how it feels to buy a breakout on a chart that fails and reverses lower: https://t.co/CGzqFtRqjf

Larry Williams' 11,300% Year: Key Strategies Revealed
Legendary trader Larry Williams made an astounding 11,300% return in one year. Here are the insights he shared for his key strategies and lessons: https://t.co/eiLHiaFans

Early Hour Drives Most Daily Range—Trade Aggressively
“A greater percentage of the day’s range occurs in the first hour then was the case in the past, and thus it has become increasingly important to trade aggressively if there are early signs of a strong trend for the...

SPX Futures Rise Amid Mixed Global Markets; Trim Positions
Mixed markets around the World as the news flow remains fluid. $spx futures +25 after a volatile evening. Keep moving ur feet as Friday gave a little confidence when weakness was absorbed even with strong oil. The daily has a...
Bear Call Spread Targets Nifty Below 22650
Entered bear call spread on Nifty 7 Apr expiry. Sold 22650 CE @ 212.05 Bought 22750 CE @ 167.35 Net credit 44.70, RR ~1:1. View is for price to stay below 22650. Not expecting any meaningful upside from here. #Nifty50
Follow X, the Ultimate Counter‑indicator, Opposite Consensus Wins
X is the best counter-indicator on Earth - Much better than Jim Cramer Always do the opposite of the consensus on X

Futures Hold Steady; Market Near Volatile Bottom
$NDX $SPX futures holding steady despite the ramp up in rhetoric over the weekend is a good sign. The stock market is severely washed out, we may get a retest or a marginal new low but on watch for a...

Long Bias on Asia ORB: Price Above VWAP
🌏 Asia ORB just set for MNQ ─────── Price is above VWAP — bias is long Buy rips through 24,229 Buy dips at 24,164 as long as price stays above VWAP ─────── Range: 65 pts Watch us trade it live 9am NY: https://t.co/66dSROf2rQ https://t.co/sdYmWTFb2W

Trump’s Iran Ultimatum Spikes Oil, Fuels Market Volatility
Trump's 48-hour Iran ultimatum just sent oil futures through the roof. This geopolitical tension could spell trouble for broader markets. Going live in 2 hours to trade this volatility with our DOTS indicator signals. https://t.co/66dSROeuCi https://t.co/E2Zf77HxKR
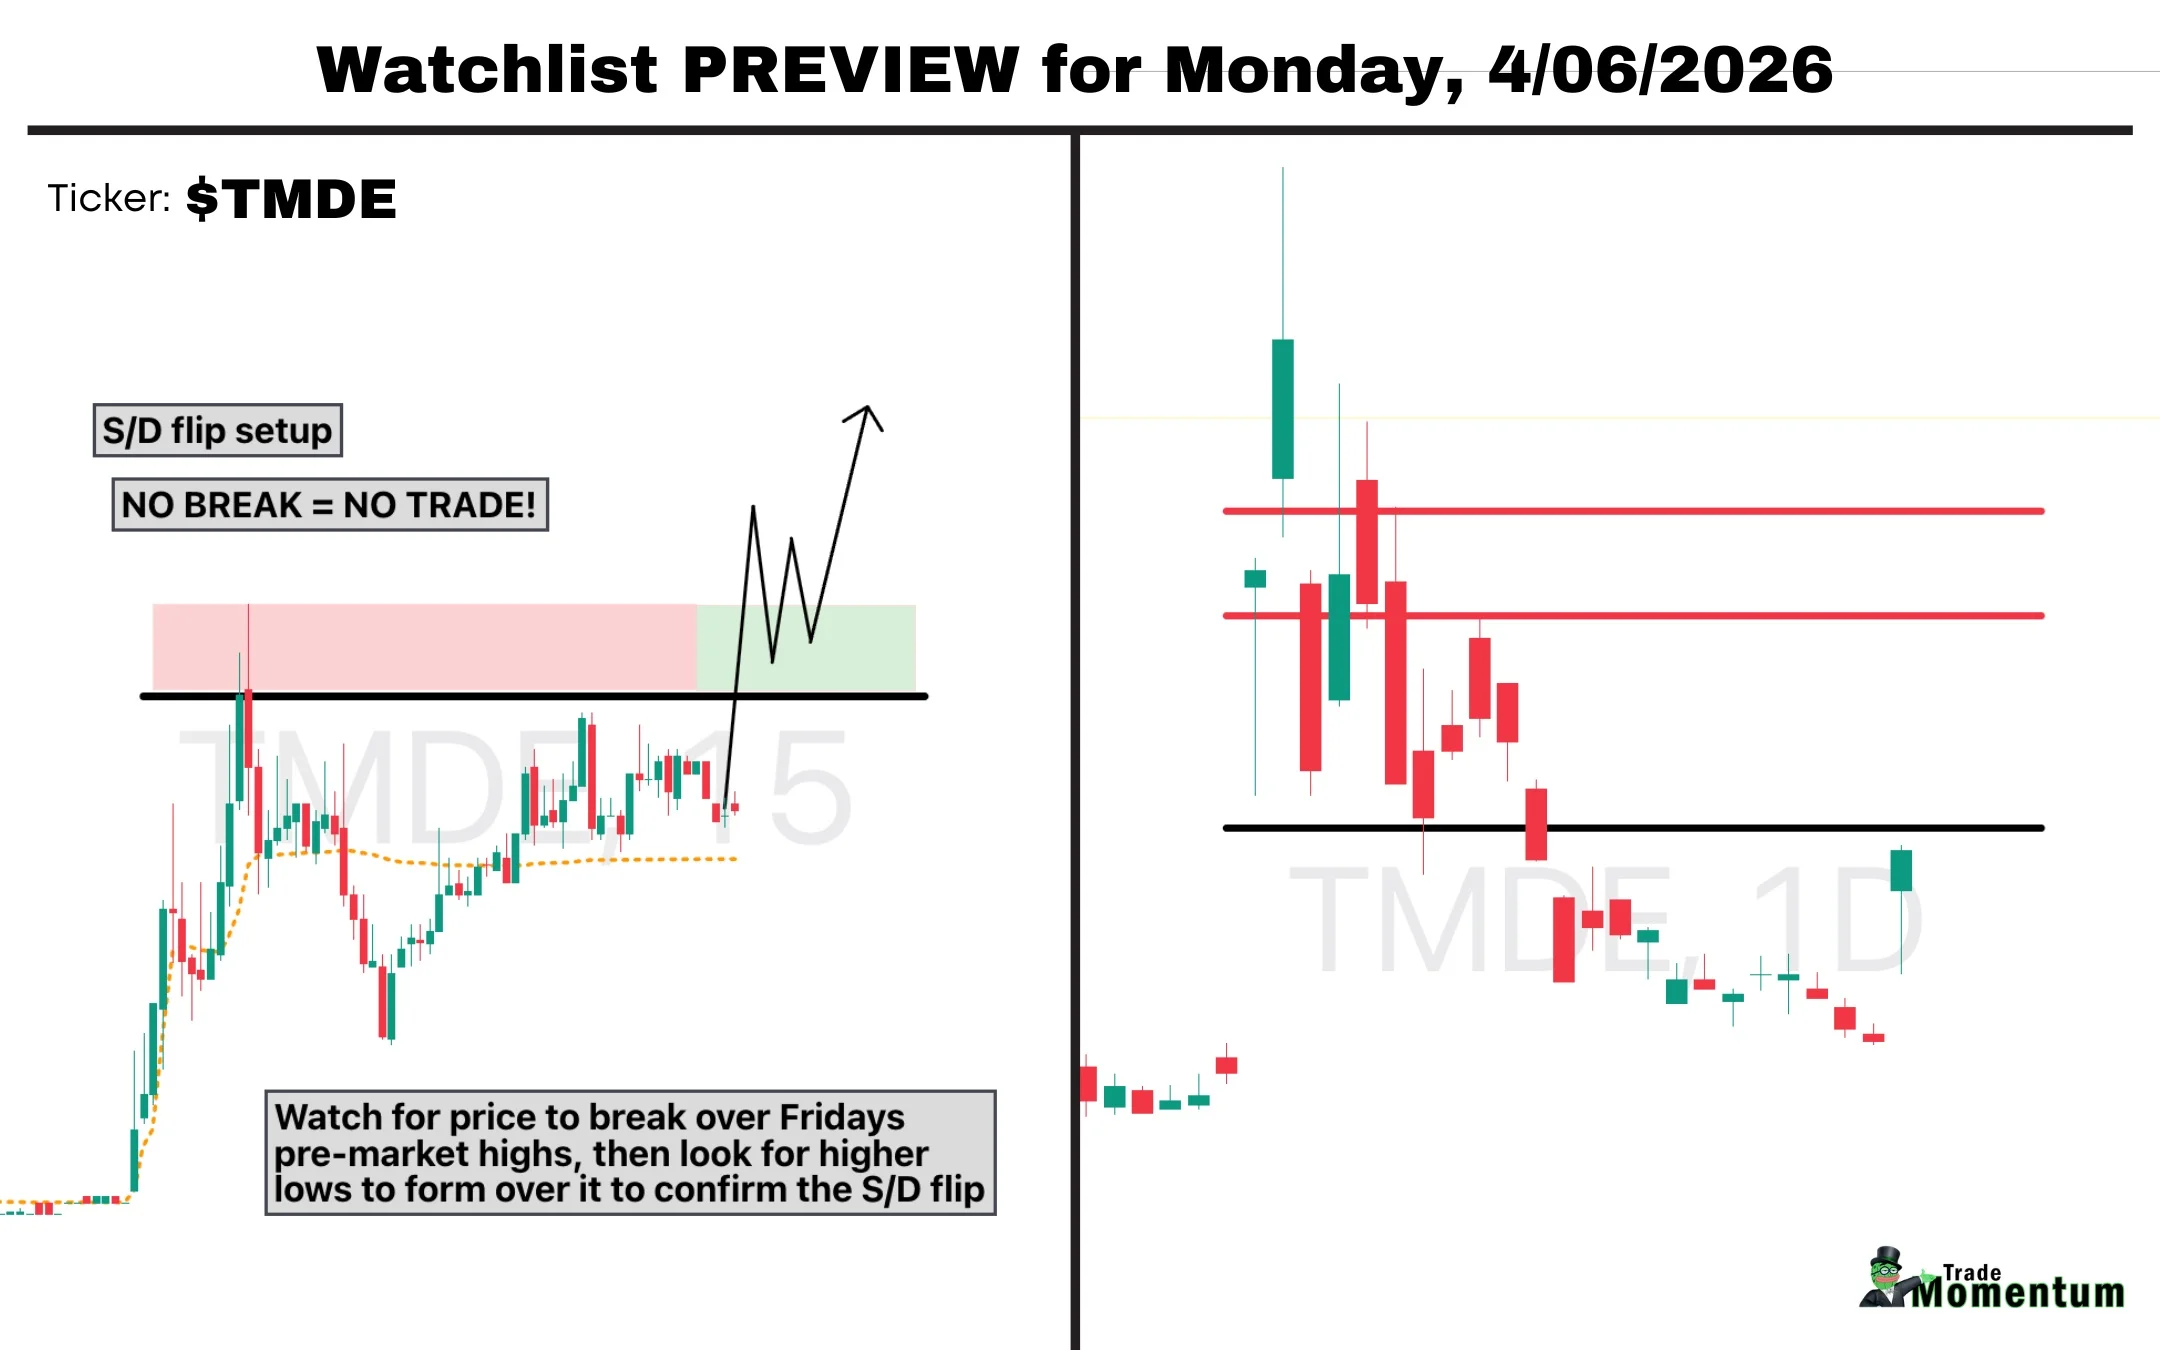
TMDE Spikes 10x Rvol, Watch Supply Range
Over 10x rvol on this resurgence on $TMDE last Friday, so I'll be watching this for continuation thru it's daily supply ranges into this week. Super simple S/D flip setup as shown below, so as always, no break means NO TRADE. Range...

Mixed Sentiments Signal Emerging Market Rebound
Learnings and conclusions from this week’s charts: 1. Investor Sentiment is down, Economic Sentiment is up. 2. Markets appear to be following the Trump Weave. 3. Oil Shock Analogs highlight the worst case. 4. Tech sentiment is deeply oversold. 5. Global equities are up from...

MNQ Gap Fill Could Trigger V‑Shape Recovery or Bearish Drop
Futures market is open and we have a small gap down on MNQ (Nasdaq) I have two different scenarios that I’m waiting for and expect to reveal itself by London session Either we push up and fill the gap, then retest the...

Plan Ready, Execution Missing: My Bounce Breakdown
I had the exact playbook for this week's bounce. Wrote it out Tuesday morning. Then I didn't follow it. Full breakdown in this week's post 👇 https://t.co/bnh00L8Xr6 https://t.co/KNHksZ0ieR

AI Reveals Optimal Sub‑System Pairings and Allocation
I've been playing around with AI to look closer into some old strategies of mine by feeding it a 10-year trade list. I initially asked it to assess the 10 sub-systems within this short-term strategy and look for issues that...

Crude Oil Gaps Higher, Outpaces Falling Futures
/CLK6 gaps open to 112.96, trades up to 114.83 (Friday close of 111.89)...now +1.7%ish /ESM6 -0.6% /NQM6 -0.7% /ZNM6 -0.03% DXY +0.02%

Bitcoin's Liquidity Peaks as Market Stalls in Range
Bitcoin has built up liquidity on both sides. We’re stuck in a sideways range, when will this consolidation finally end? https://t.co/0RmGVv5Mgg

Regime Dictates Success; Any Indicator Will Work
It always amazes me how people fall for this nonsense. From 2007 onward the SP was a pure BTFD regime. Of course buying the down day worked. In all strategies the ONLY variable that matters is regime. Get that right...

SPY Faces Three Paths: Bounce, New Lows, or V‑Bottom
Should be a very active/fluid week. First weekly chart is mine. We did see the first reflex oversold bounce. Seems like two/three scenarios going around. 1) One more move to $spy $674 area in the next week or...
Rising Delta Amid Falling Price Signals Bounce Intent
Price dropping into NY VWAP… but delta rising? That’s the divergence you want to see. Buyers stepping in beneath the surface = higher probability bounce off value. This is how you read intent, not just price. 📉📈 #VWAP #OrderFlow #FuturesTrading

QQQ May Dip to 540 Before Confirming Bottom
$QQQ - The weekly low was 555 which is close to the yearly pivot but I doubt it has bottomed. If it keeps following the 2006 analogy which I posted about, the target would be 540, a retest of the...

Tesla's Seven‑week Slide Persists; 329 Support Target
$TSLA - Closed down for 7 weeks in a row but the downtrend isn't over yet. The target remains the 100 week MA that is currently at 329. Further downside will be invalidated only in case of a weekly close...
Trends Persist: Keep Buying the Deeper Dips
Trends do not die easily, at least that's how you feel as you buy deeper dips.