
Use Real-Time Alerts to Nail Your Trade Close
Getting dialed in for the close (follow all my signals and coaching notes via Real-Time Alerts) https://t.co/36PhRJDaxQ
Sell Low‑delta Options: High Win Rate, Disciplined Profit
When I sell a .25 delta option I have ~ 75% chance of keeping all the premium. Do that consistently across good stocks, manage the losers, and the math compounds in your favor over time. Options buyers need luck. Options sellers need...
NVDA Breaks Past $185 Resistance, Gains Momentum
$NVDA nice mover lately and finally over the 185ish that had been keeping it down.

Need Friday Close Above 200‑Day MA for Optimism
Thursday recently tied the longest losing streak ever at 9 in a row. Well, Friday is down five in a row. We get asked all the time what would turn you more optimistic? A Friday close above the 200-day MA...

SATS Shows Intraday Strength, Gains $12 Amid Nasdaq Dip
$SATS is a great example of intraday relative strength. When the Nasdaq came in between 11:30AM-1PM EST, the stock DIDN'T budge. It stayed up $4 and 95% in range. Once a little selling pressure was relieved, it ran $8 more....

S&P 500 Sees Many Stocks Hitting 52‑week Highs
nice expansion of S&P 500 $SPX % of stocks at 52-week highs this week... https://t.co/Ez3kURaTR8

Silver Miners Poised to Outpace Upcoming Price Rally
Silver Miners $SILJ vs Price of Silver $SLV. Are Silver stocks coiling ahead of their next advance? https://t.co/euKkgG5sKP

Mag7 Near Declining 50-Day, Bulls Eye Squeeze
$MAGS Daily. Many sloppy charts patterns out there, with bounces up to declining major moving averages. Here, Mag7 up to declining 50-day, still below 200-day. Bulls counting on nonstop squeeze to new highs https://t.co/Xb5D2QO9gg

Crowd Mis‑hedged Tails, Expect Bull‑trap Stabilization
Crowd was under-hedged for the right-tail and over- hedged for the left-tail. My “stabilization into bull trap” call: https://t.co/7eiBkt8qyD

CRWV Shows Volume Spike, Targeting $100 Hold
$CRWV Note the volume last 2 days. Price tapping on 200ma. A move and hold over next level on my radar if price wants it. Basing wouldn't hurt just have to give stops a little room with...

VIX Breach Predicts Sharp Equity Decline
Attention Homegamers... @KeithMcCullough analysis or the $VIX risk range (yesterday and today) was worth the price of @hedgeye admission. Look what happened to equities at about 10:30 AM when the VIX, at first broke support at 19.05- 19.10 (it went...

SPX Nears 6,920 Target After Inverse H&S Trigger
$SPX - We have been discussing the potential for a small bullish formation to take shape over the last two weeks. The initial attempt in the first two days of April failed to push the SPX through late-March resistance, but...

PLTR Downtrend Minimal; Support Near $91
$PLTR - This is a log chart that shows how small the downtrend since November has been in comparison with the 3 year bull market that preceded it. There's no way the low for the year was made today. Minimal...

Intel and Chip Sector Bounce on VWAP Support
Out yesterday too early on $INTC bounce, today it was a more traditional VWAP bounce trade. Chips are strong today #trading https://t.co/fj0PAqsWWH

QCOM Reclaims 10/21 MA, Paydays Likely Sold
$QCOM back over 10/21ma's and gap from Wednesday holding well. Own full and paydays still. Friday so will likely sell paydays today. https://t.co/Xocr4M1Cup
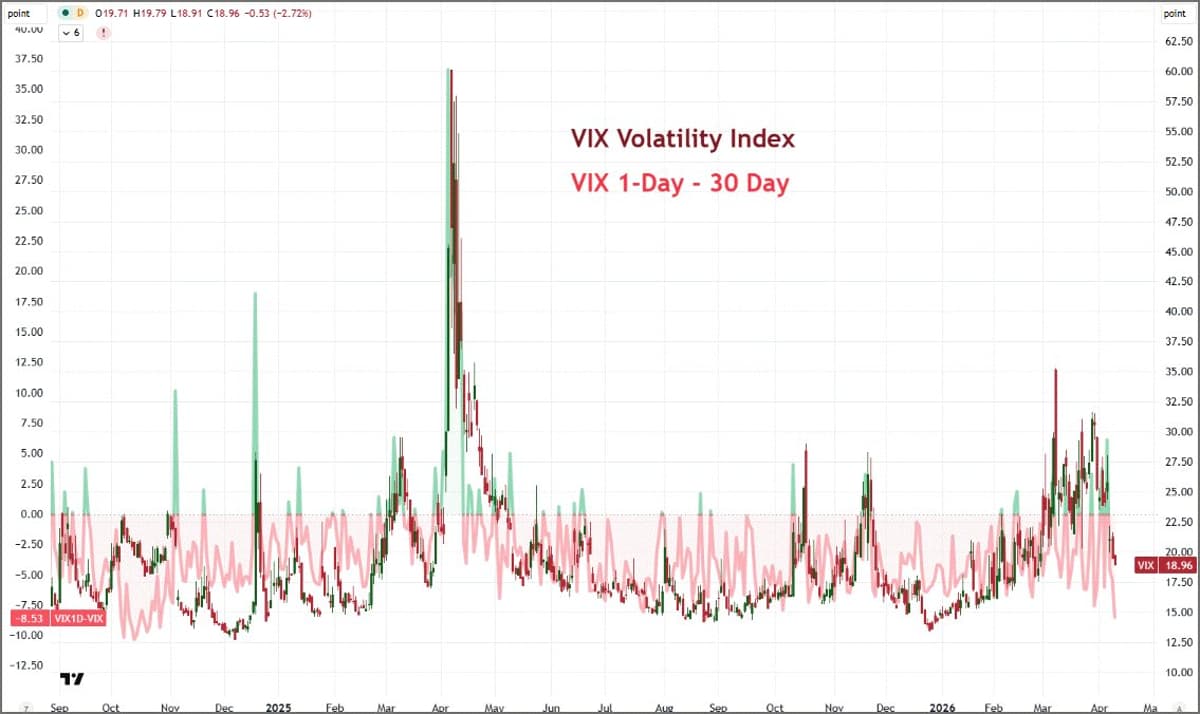
Volatility Collapse Persists Amid Fragile Ceasefire
What is up with this... We are heading into the weekend with a ceasefire that both sides are actively punching holes through, and implied volatility has the market looking like it is walking into headlights. VIX still dropping, 1-day - 30-day spread...

Lithium Corp Rebounds Off Support, Signaling Sector Lift
Lithium Corp $LTUM +11%. Big picture: retraced to support and starting to reverse. Elevator going up? Lithium, Graphite, REEs, Neodymium, Fluorspar ... https://t.co/5lg7wi0KvS

ORCL Rebounds From Yesterday’s Low—Low Risk, Limited Upside
$ORCL trading the reversal off the low of yesterday. Low risk but been a name only in a down trend and small bounces. Have your own plan. https://t.co/Yv5g8y9IxI

Holding Full AVGO Position, Awaiting Base Entry
$AVGO watching the gap overhead. Basing needed soon to gain energy. Still own full and working on let it rides with a bit more cushion. https://t.co/njnCmiGYmQ

Burry Abandoning His Big Short Would Change Everything
Imagine if @michaeljburry gave up on his big short thesis on the first short squeeze. https://t.co/PmWJhvZ8Ss
Watch AVGO December ER Gap for Next Price Move
$AVGO watching the December ER Gap for next levels if price wants more. Basing on the daily would be beneficial soon.

Nasdaq Extends Rally Post‑V Bottom, Inverse CL Correlation Persists
NAZ on extended run up for now after V bottom. Indexes still invers correlation to CL on the intraday charts. https://t.co/YxtwQfvRaC
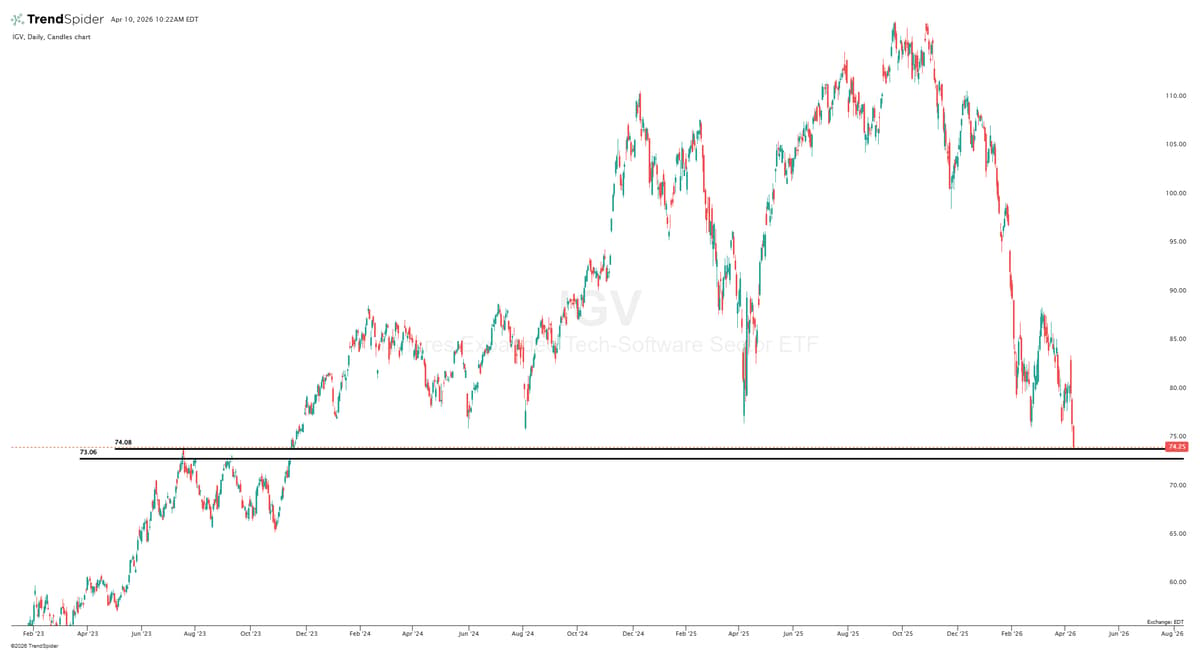
IGV Slides to Critical $73‑74 Support Zone
$IGV (software) down another -3% today after being down -4% yesterday... now down -37% in the past 6 months with many smaller software names down 40-60% in the same timeframe. Looking at $IGV on the daily chart... it's already sliced through...

Uranium Stock Shows Strong Cup‑Handle Breakout, Awaiting Peace‑Talk Fallout
$UUUU Daily. Strong open for uranium/rare earths play with massive "handle" on cup & handle pattern which may as well be the Big Dipper. Could get traction next week if peace talks fall apart. https://t.co/SWvjRhH1Of
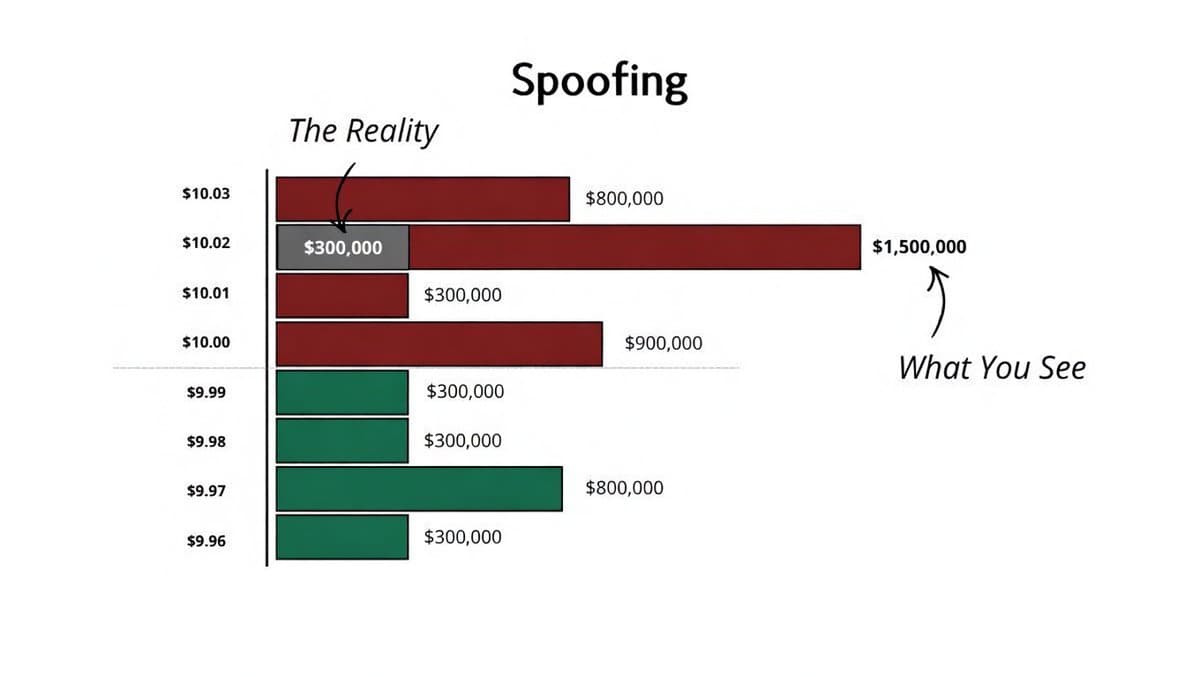
Spoofing Fakes Supply to Manipulate Support and Resistance
Spoofing Traders use this to create fake supply or demand. At resistance → scares buyers. At support → attracts buyers. ↓ https://t.co/OLpLwjt6AE

KBE Displays Classic, Common Chart Setup Today
$KBE - Went through a lot of charts this morning... This is a very common setup... https://t.co/CuzFyU3Ijk

Bean Oil Leads, Watching 3‑Bar Breakout
BEANS: Area of interest (currently on 3 bar breakout mode). (bean oil RS leader) https://t.co/XpOkJOA0dK

Bond P/E Triangle Signals Potential 4.5% Yield Spike
If we invert the 10-year bond yield we get a “P/E” ratio for bonds. The chart below shows that since the 2022 rate reset, the bond P/E has been stuck in a tight triangle. That triangle could be a base,...

Use RSI as Context, Not a Standalone Signal
RSI isn’t the problem… your usage is. 📉 Most traders get stopped out because they treat RSI like a signal — not context. Fix this one mistake and everything changes. 👇 Comment “RSI” and I’ll send you the free indicator + full setup...

TLT Faces Mid‑Range Resistance, Signal to Sell
Swing chart of TLT shows resistance in middle of prior range, currently on a sell. https://t.co/mtjHPXt3sa

S&P 500 Eyes Best Two‑Week Rally Since Oct 2022
The S&P 500 could post its best 2-week rally since the bull market's beginning (Oct 2022) +7.2% so far. https://t.co/ojdbObVpIp

Software Hits Feb Lows, RSI Shows Positive Divergence
Nice one from @FrankCappelleri in his note this AM. Software is back to the late February lows, but positive divergence with RSI. https://t.co/G96kkZXR5P

TSLA Poised to Break 349, Target 350‑354 Today
$TSLA doesnt feel like a long til it can break something out. 349 is set up as that break today with room to 354 if the 350 level isnt too much trouble on a friday. #TradingStrategies https://t.co/LdIOJQ5Vup

Natural Gas Buy Day Begins, Seasonal Window Opens April 13
NAT GAS: Buy Day today. It starts a long seasonal window April 13 courtesy MRCI research. https://t.co/Ei34TuCMVk

AMLM Poised for Rebound as Technicals Cool
Disseminated on Behalf of American Lithium Minerals Inc $AMLM $AMLM has been actively announcing acquisitions to build a diversified portfolio (Lithium, REE, Gold, Silver, Copper) in mining-friendly areas. It's also mentioned interest in real-world asset (RWA) tokenization for its projects (gold,...

Consider Trimming $SNDK Positions, Not Initiating New Longs
So many nice set ups in $sndk the past two weeks. I’d think today is a better trim/sale. NOT start a fresh long https://t.co/oHwOKAnc4c

Bullish Outlook: Positioning vs Seven-Day S&P Rally
When I ask others for the bull case from here in stocks, by far the most common answer is positioning and CTA buying. I have trouble squaring that idea with the fact that the S&P 500 is up 7 days in...
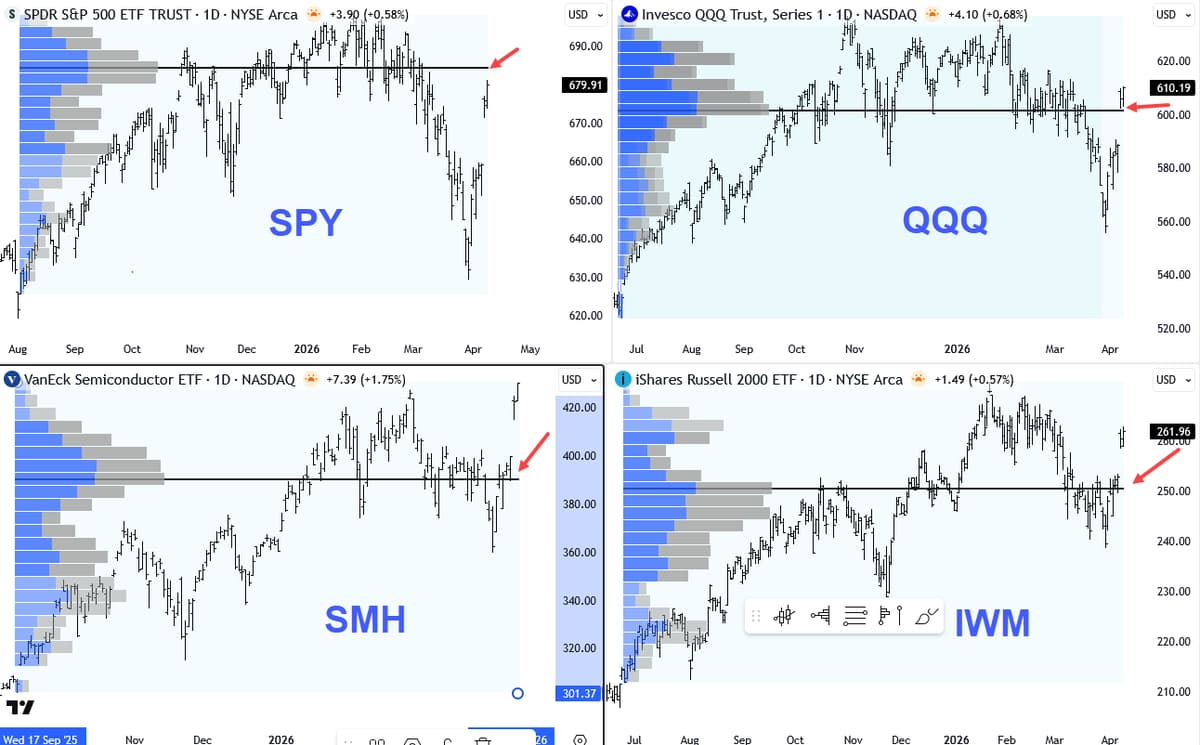
POC Levels Are Interest Zones, Not Unbreakable Barriers
Regarding the "point of control" largest volume node in $SPY that I retweeted, keep in mind it is simply a level of interest, not an impermeable barrier. Look at the similar level for $QQQ $SMH $IWM, markets blasted thru them https://t.co/9wft3GF3zO

QQQ Poised to Test 612 After
$QQQ spiked above 612 on the CPI print where we failed early march before the sell off. --i expect we will fail there today but if not look out above.. https://t.co/NQjjOdJBMM

SPY Rally Continues; High Oscillator Warns New Buyers
$SPY had a big rally from $629 to ~$681, and Wednesday’s gap-up held and extended to another high yesterday. The oscillator is now +60, making it tough for new buys, but it doesn’t mean you need to be short. https://t.co/WfpS5UmKlU

CPI Looms, AI Stocks Shine Amid Friday Dip
Its a Happy Friday as Oil futures for now are down. But we get CPI this morning and a hot print could give the markets a frown. $TSM numbers point to more strength for the AI trade, while Software names...

Investors Misread VIX: Fear Indicator vs Trade Asset
i think there are a lot of people now conflating VIX as a fear indicator vs VIX/volatility as an asset class and the idea that "don't people get whats going on?" im sure they do its just not today's problem...

XLP's Persistent Underperformance Offers Strategic Edge
consumer staples $XLP have been WEAK vs. S&P 500 $SPX for years... they're solid & well-defined laggards... use that to your advantage...🚀 https://t.co/CYqDzpargw

VIX Breaks Trendline, Market Fear Cooling, Bullish Outlook
Interesting setup on the VIX today, it just broke that rising trendline we've been watching since January. Market fear is clearly cooling off, pointing to a solid trend reversal for US equities. Let's see if the bulls can actually hold...

Free Guide: Master 6 Precise Fibonacci Trading Patterns
Here’s a link below to a FREE Fibonacci Trading Strategy Guide (ebook): 📈📊📉 Learn the 6 Fibonacci Pattern Types that Create the Most Precise Price Levels, Targets, and Reversal Zones for traders. Click here: ⬇️ ⬇️ https://t.co/62UAf4L9jv Discover the 5 types that aren't...
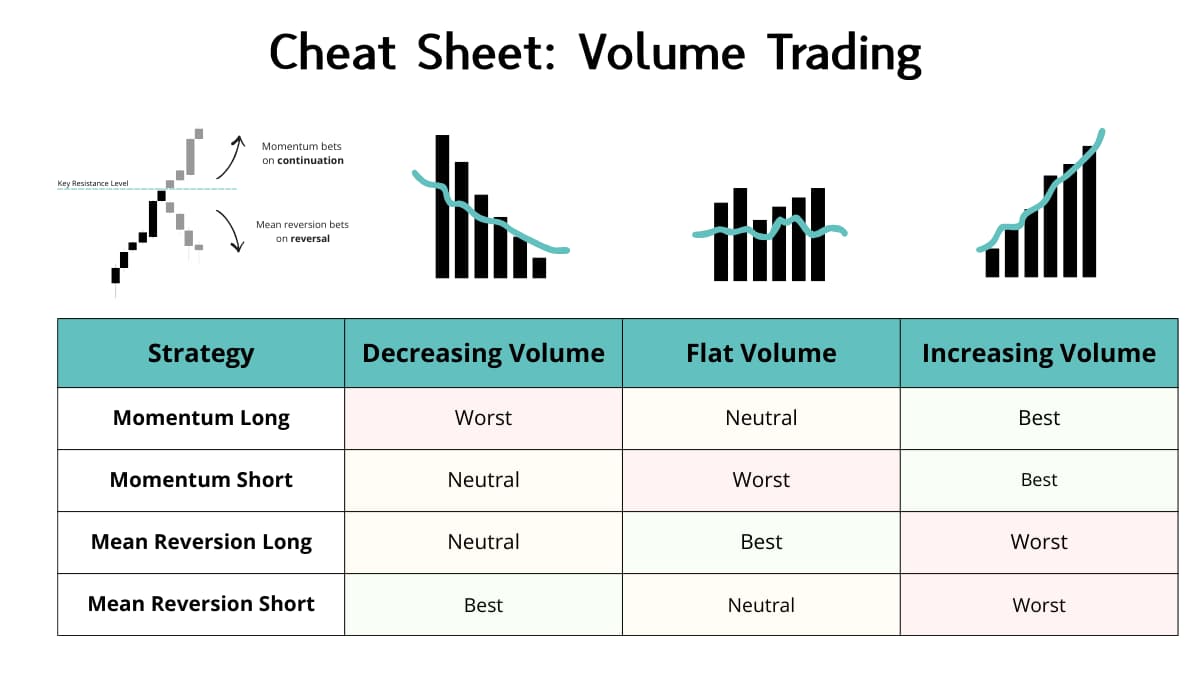
Proven Volume Patterns for Winning Trades
Volume Trading Cheat Sheet I've analysed 1000s of trades and found these ideal patterns for trading with volume. ↓ https://t.co/N0gg0vaP8x
Higher Oil Prices Set to Spike CPI, Live Trade
Today we'll see the first impact of higher oil prices on CPI. The news could rock the markets like no other piece of fundamental data. We are going to trade it LIVE and see if we can get FUNDED in one trade. Join...

Consolidation Clears Weak Hands, Fuels Future Upside
"If a stock is under accumulation, a price consolidation represents a period when strong investors absorb weak traders. Once the "weak hands" have been eliminated, the lack of supply allows the stock to move higher because even a small amount...
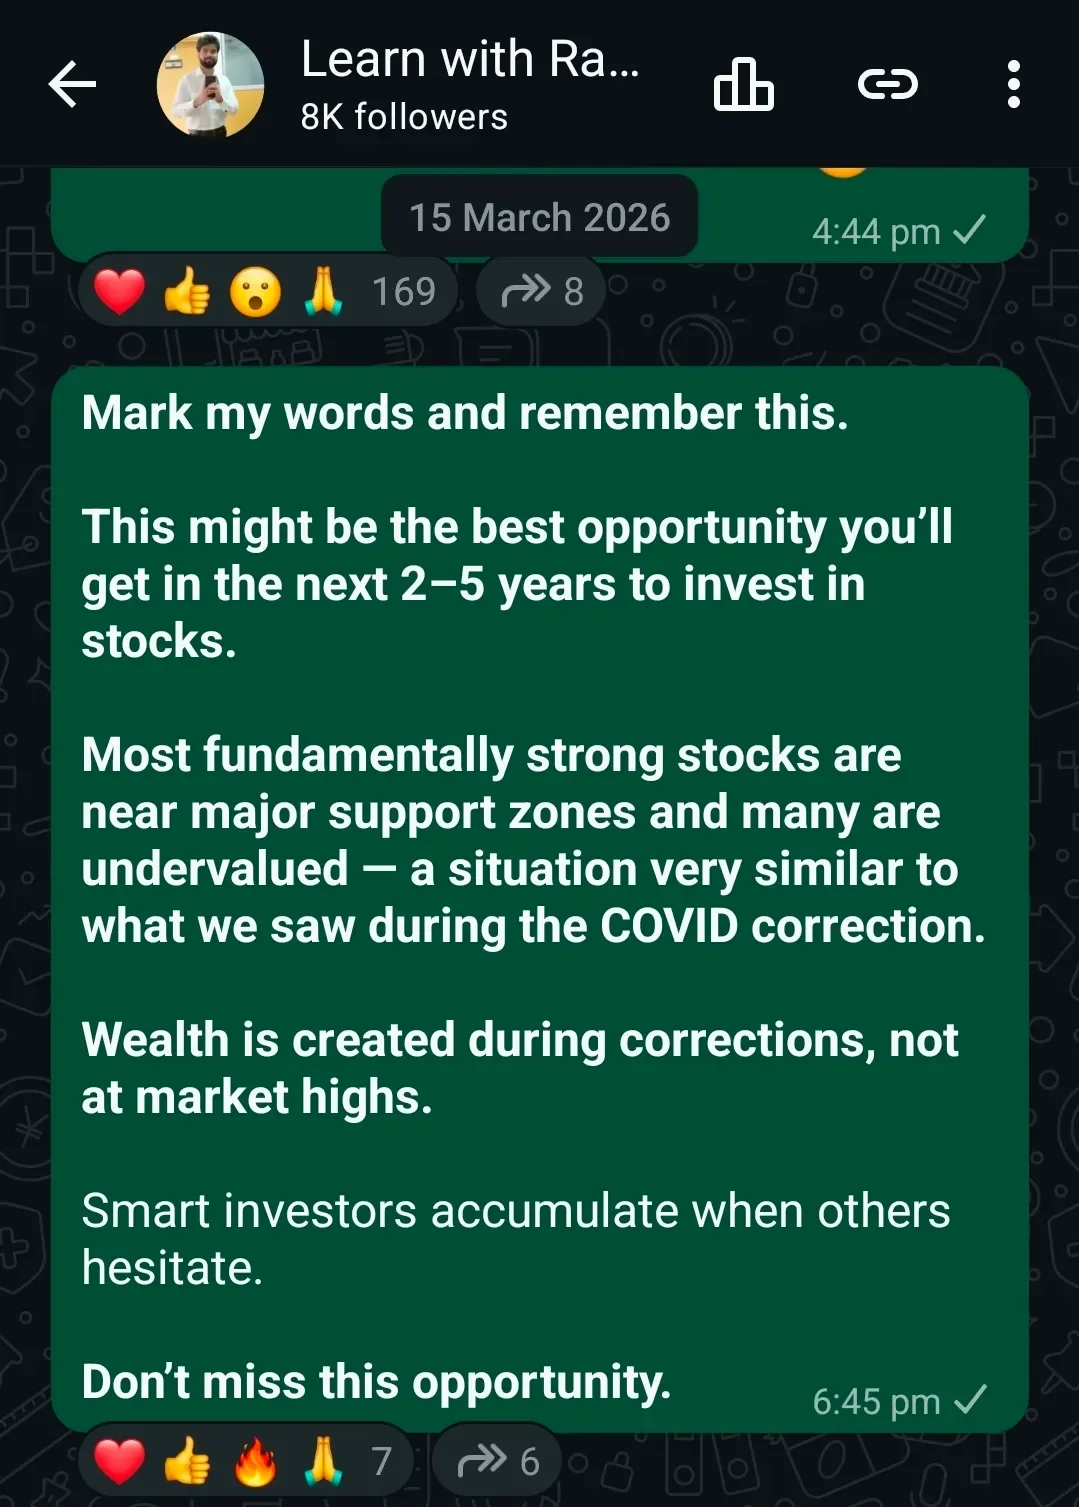
Small‑Cap Recovery Begins – Early Upswing Signals Smart Money
Most small-cap stocks have already bounced back from their key support zones — a strong sign that selling pressure is fading and accumulation has begun. This phase often marks the early stage of a new uptrend. The best time to invest is...

YSS IPO Surges with Record Volume and Earnings Gap
$YSS I found this name in the @Deepvue leaders screen. New IPOs in a leading theme are always key to watch. Plus it had a recent earnings gap, highest ever volume https://t.co/EQczxyFDMr