
Insiders Rake $762M in Minutes After Robinhood Hype
Robinhood traders watching DC insiders make 762M in three 5 minute candles after Vlad told them he was 'democratizing finance' with 24/7 trading, private venture access, and in game live betting. https://t.co/lYksJXY7VW
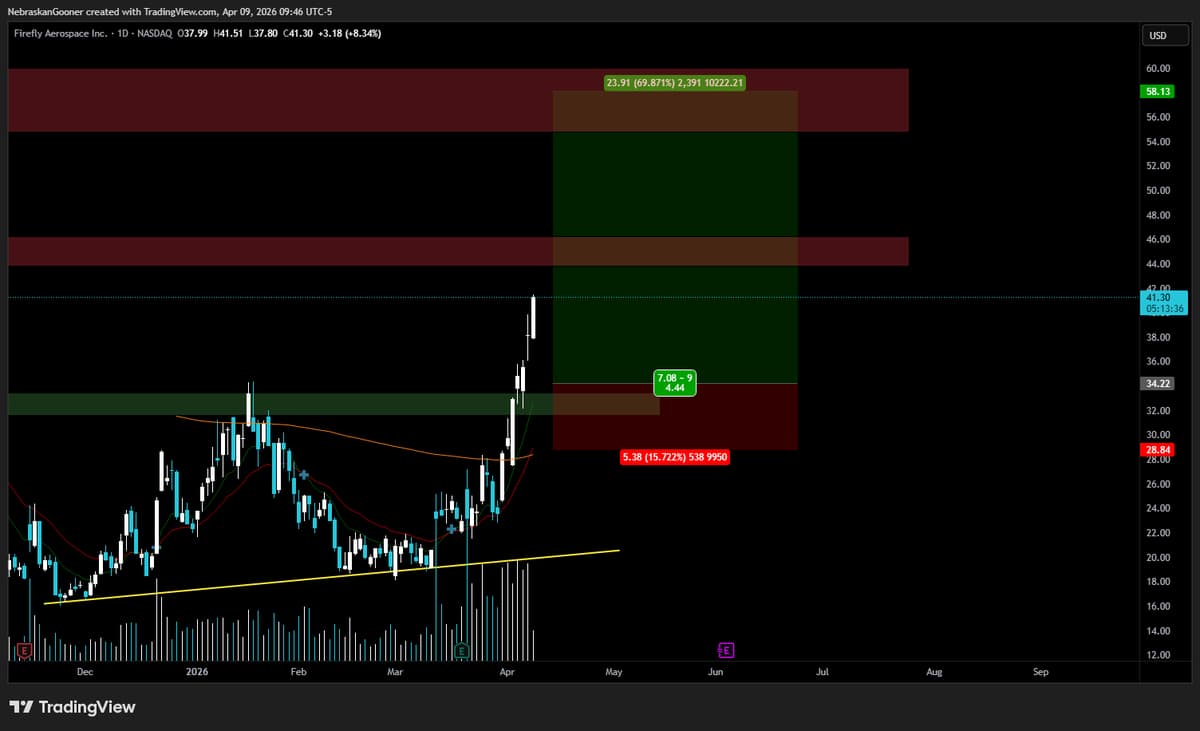
FLY Approaches Resistance, Stop‑Loss Moved
$FLY This thing is cooking. Almost to first resistance zone. Going to put stop loss at break even now and see where this goes. https://t.co/Oc4pqLGNoR

CELH Outpaces MNST on Volume, Trades at Half Valuation
Still some risks to the $CELH growth story but volumes up +23.6% YoY with the stock trading at 3.2x NTM revs (and $PEP owns 11%) ...meanwhile $MNST volumes only up +3.5% YoY (not including BANG with volumes down -18.3% YoY)... yet...
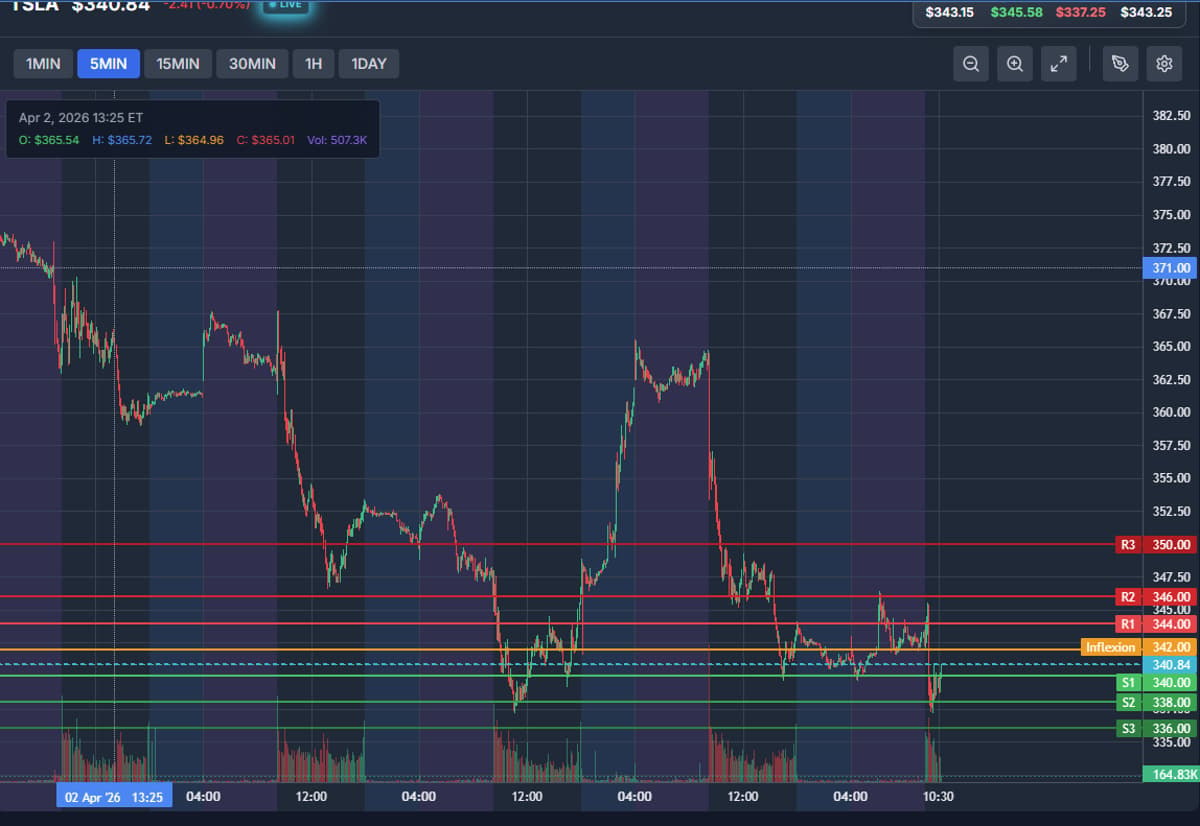
Tesla Rebounds Above $340, Eyes $350 to End Dip
$TSLA back above 340 after testing this week's low and being bought at S2. this is typically how it bottoms. a couple of closes above 350 would negate recent downward momentum. https://t.co/jZW69oVwfM

Market Breadth Surges to 84% After Bullish Divergence
that's a surge of #marketbreadth and buying as the % of stocks in the S&P 1500 > 10-day EMA moved up to ~84.1% after getting oversold with a #bulldivergence... https://t.co/zXjmVwy6hK

Model Collapse Mirrors 2025 Volatility Lows
we've had a full "collapse" in my $SPX $VIX model as the 1/10 oscillator (bottom) has come all the way back down as volatilty as settled... same as fall '25 and spring '25... https://t.co/Bg0SJqtlrd

Nifty Holds 23,662 Support, Eyes 24,300 Target
Nifty Prediction For Tomorrow 10 April 2026 By Rohit Srivastava | Indiacharts The immediate and crucial support level to watch is 23,662; holding this level keeps the bullish momentum intact. If the index successfully defends this support, it is...

Amazon Eyes Day‑2 Breakout if 223 Holds
A day after rejecting the breakout $AMZN has a chance to do it day 2. The market is king but if it holds 223 in the opening range this can go. https://t.co/GLyS9ALQui

Yesterday's S&P 500 Price Action Recap for Subscribers
New daily post for subs about the price action yesterday. Link in reply below. $SPX 👇 https://t.co/ONkOgOuZXQ

Mean Reversion Strategies Outperform SPY YTD
Mean reversion (MR) update. Since inception: -#ES_F bonus MR +44.7% (May 21, 2025) YTD +15.7% -Bonus MR+momentum: +1.6% (October 9, 2025. YTD +1.5% -Main MR strategy: +38% (June 27, 2023) YTD +5.2% - $SPY YTD -0.6% Links in profile (Daily mean reversion signals) 🔽...

BTC Breaks Out, Holds Above Channel Amid Underlying Gaps
$BTC has broken out and held above the channel. But we should also keep in mind that there are Gaps below. https://t.co/lz3sN3ZqpS

Oil Rises, META AI Sparks Market Volatility
The Yo-Yo market continues as oil prices back higher ahead of PCE data today. $META tries to hold onto its gains after its unveil of its Muse Spark AI model shoes its come to play. $CRWV higher as it...

EEM Jumps 11% in Q2, Finds Support at $58
$EEM rose 11% to jumpstart Q2.. pulling back this morning. But I see nice support now at $58 https://t.co/FcpeEr3KWo
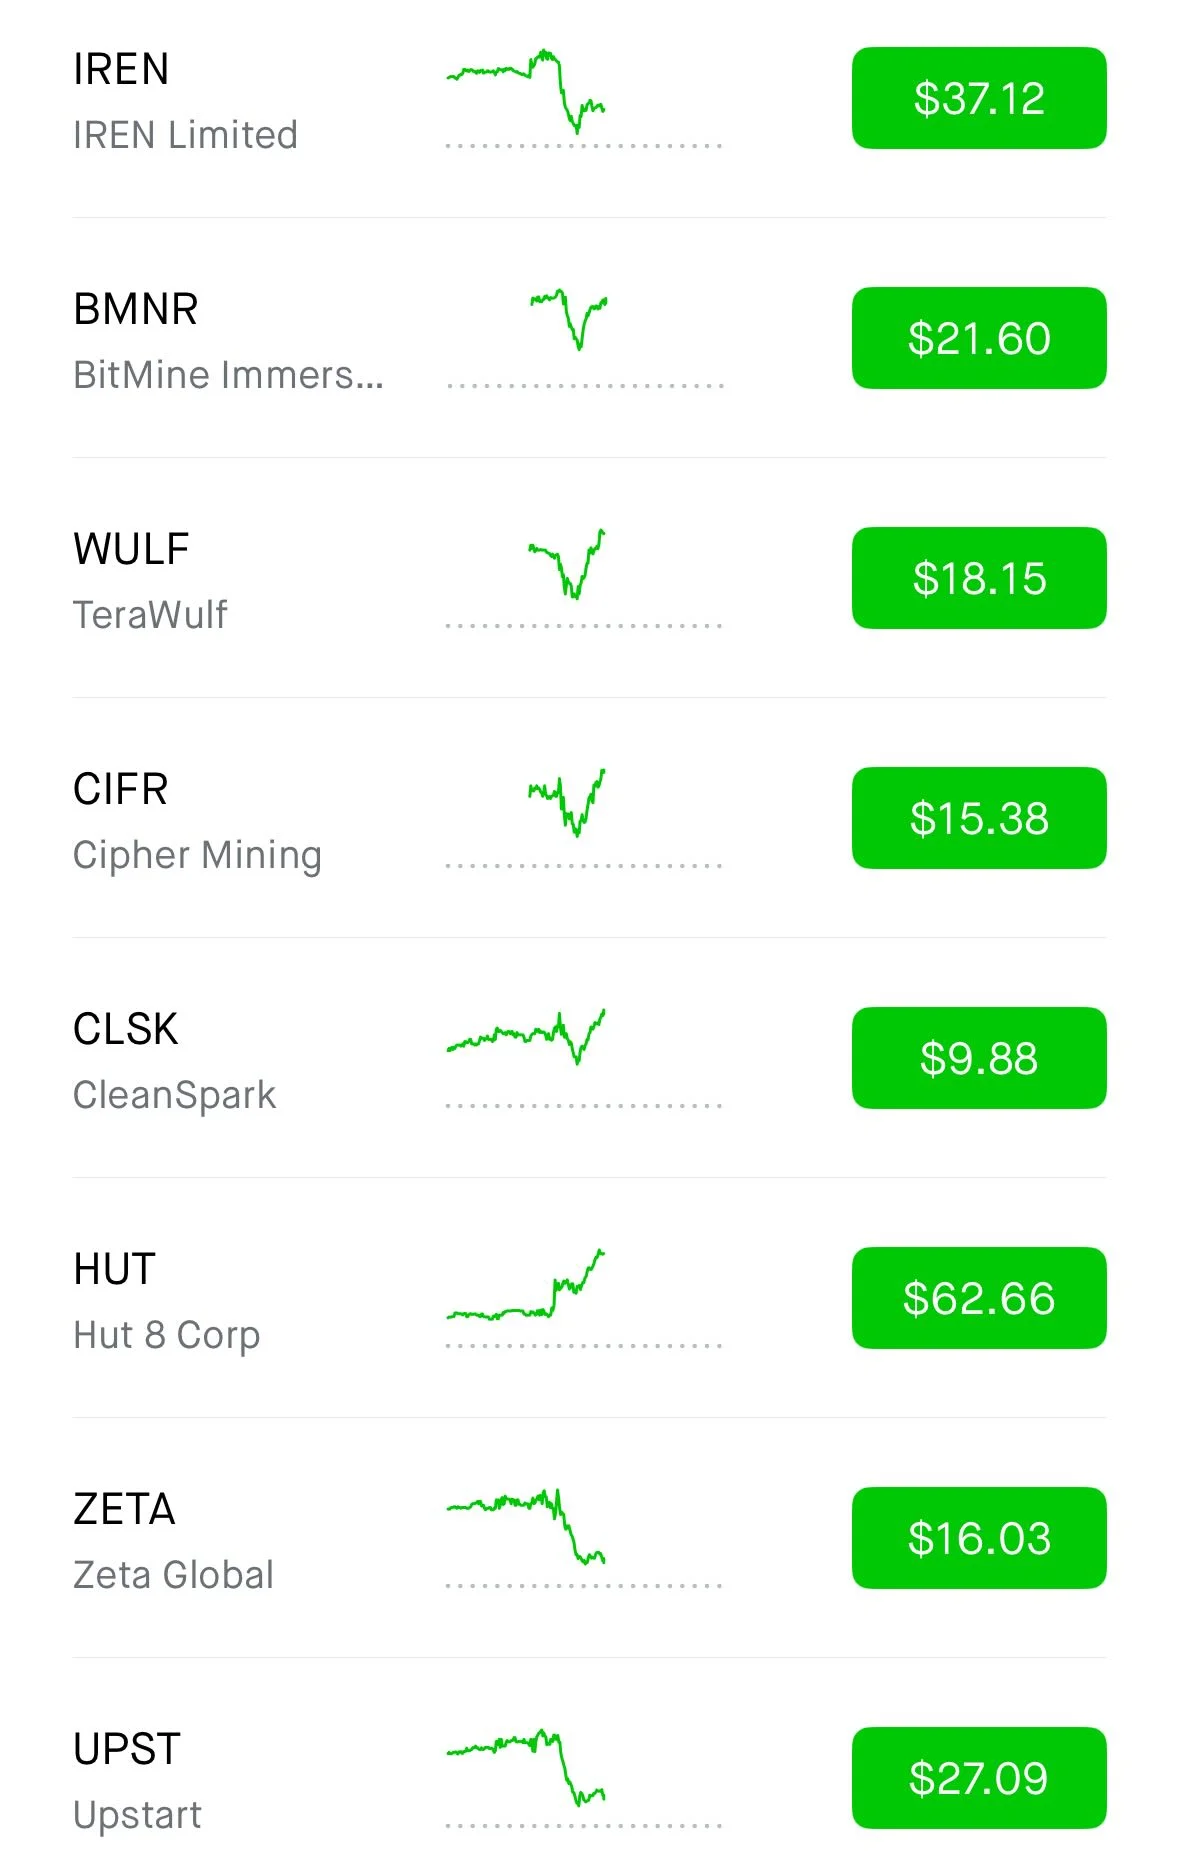
Seek Stocks That Remain Green During Market Dips
Pay attention to the stocks that stay green and show strength when the market dips. Any relatively strong stocks you see right now? ⬇️

Plan Biotech Catalysts Ahead to Capture Stock Moves
Investors should know WHAT will move a stock and WHEN, especially in biotech with the outsized moves. Build your catalyst calendar ahead of time. You won't have time to thoughtfully analyze the data when it hits #learnbiotechinvesting #biotech #investing #BiotechPrometheus https://t.co/2RGMVrR2lG

Chinese Stocks Can't Sustain One-Day Rally, Stay Bearish
CHINA: stocks failed to hold more than a 1-day "cease fire" squeeze and remain Bearish TREND @Hedgeye https://t.co/86yW0QnDJk

Will SPY Stay Above $671.50 Pivot?
Simplify it today. Can the $spy hold above the gap pivot of $671.50? Does it get below and stay below to see how much it fills. Does it get below it and then reclaim it? ...

Turn Market Volatility Into Nifty Options Wins
🚨 WEBINAR ALERT 🚨 From Volatility to Victory: Nifty Forecasting with Options Trading Market volatility can be a trader’s biggest fear—or their greatest advantage. Over the last 30 years, Rohit Srivastava has mastered the art of reading market cycles to anticipate the...
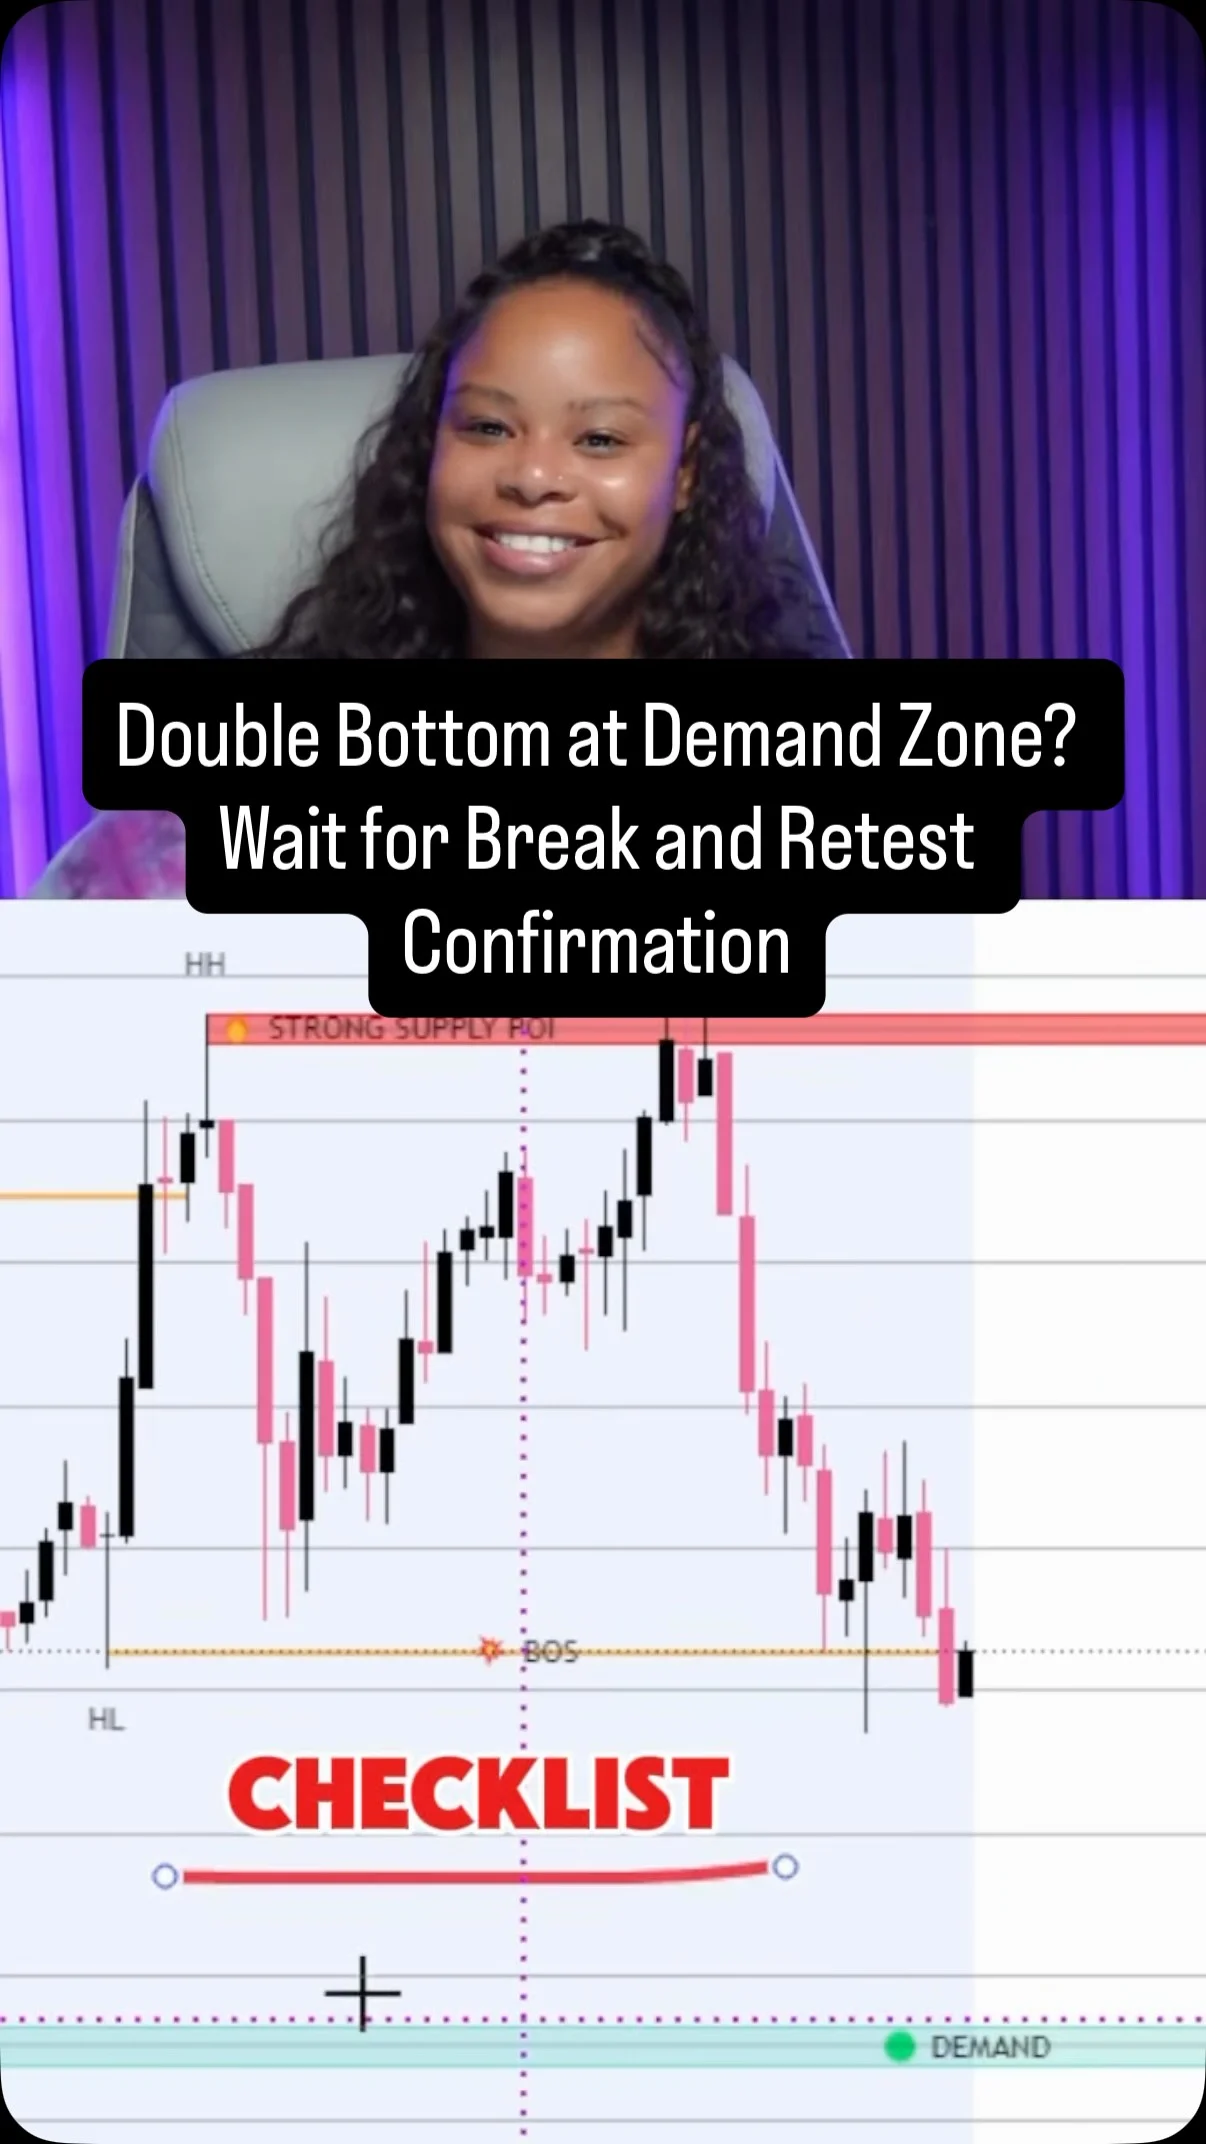
Combine Demand, Structure, and Confirmation for High‑Probability Trades
Most traders see a double bottom at a demand zone and enter instantly. That’s why they get stopped out. Demand alone isn’t enough. Wait for price to break structure and come back for the retest. That’s your confirmation that buyers are in control. Demand +...

Calfrac CFO Hire Spurs 47% Rally, Buy Pullback
Macro: oilfield services momentum 📈 Key: Calfrac names Scarlett Crockatt as CFO; strong capital-markets pedigree; shares +47% near 52‑wk high. Risk: one‑time transition charges. Trading insight: consider buy on pullback. — Viktor Kopylov, PhD, CFA. More insights: t.me/si14Kopylov

Strong Q4 Numbers Set Up PSE Breakout
Breakout in the Philippine Stock Exchange PSE PM? Honestly the Q4 numbers were strong, so I would not be surprised https://t.co/77fgs8oMBy

Swing Trading Delivers Investor Returns Without Years of Waiting
Swing trading is the closest thing you can do to getting investor like returns without the wait of 3-5 years which is why TBL prioritizes it Most people have careers and jobs Most people don’t have hours to sit in front...

Asian Markets Set to Open Higher on Fragile Iran‑US Ceasefire
JUST IN: Asian markets are poised to rise at the open due to the fragile Iran-US ceasefire deal.

Traders Bet $950M Oil Drop Ahead of Trump Ceasefire
JUST IN: Traders placed $950,000,000 in bets on oil prices falling just hours before President Trump announced ceasefire with Iran

Bullish Short-Term Outlook Amid Record Valuations
The short-term market outlook is quite bullish following the reset in short-term sentiment/technicals. But we still have unfinished business... Allocations & Valuations are at generational/cycle highs ---will this ever matter? 🤔 https://t.co/jTnzbMJt6Z

Markets Rally on Weak Fundamentals; Oil, Dollar, Yields Likely Hold
"CEASEFIRE" and $SPX 6800 – Now What? Markets ripping yet risk remains high with fundamentals weak behind the move. My bet: Oil, Dollar, Yields & VIX won't fall as much as bulls hope. Also, some trading tips on hedging swing short exposure. https://t.co/by1pQIVgSP
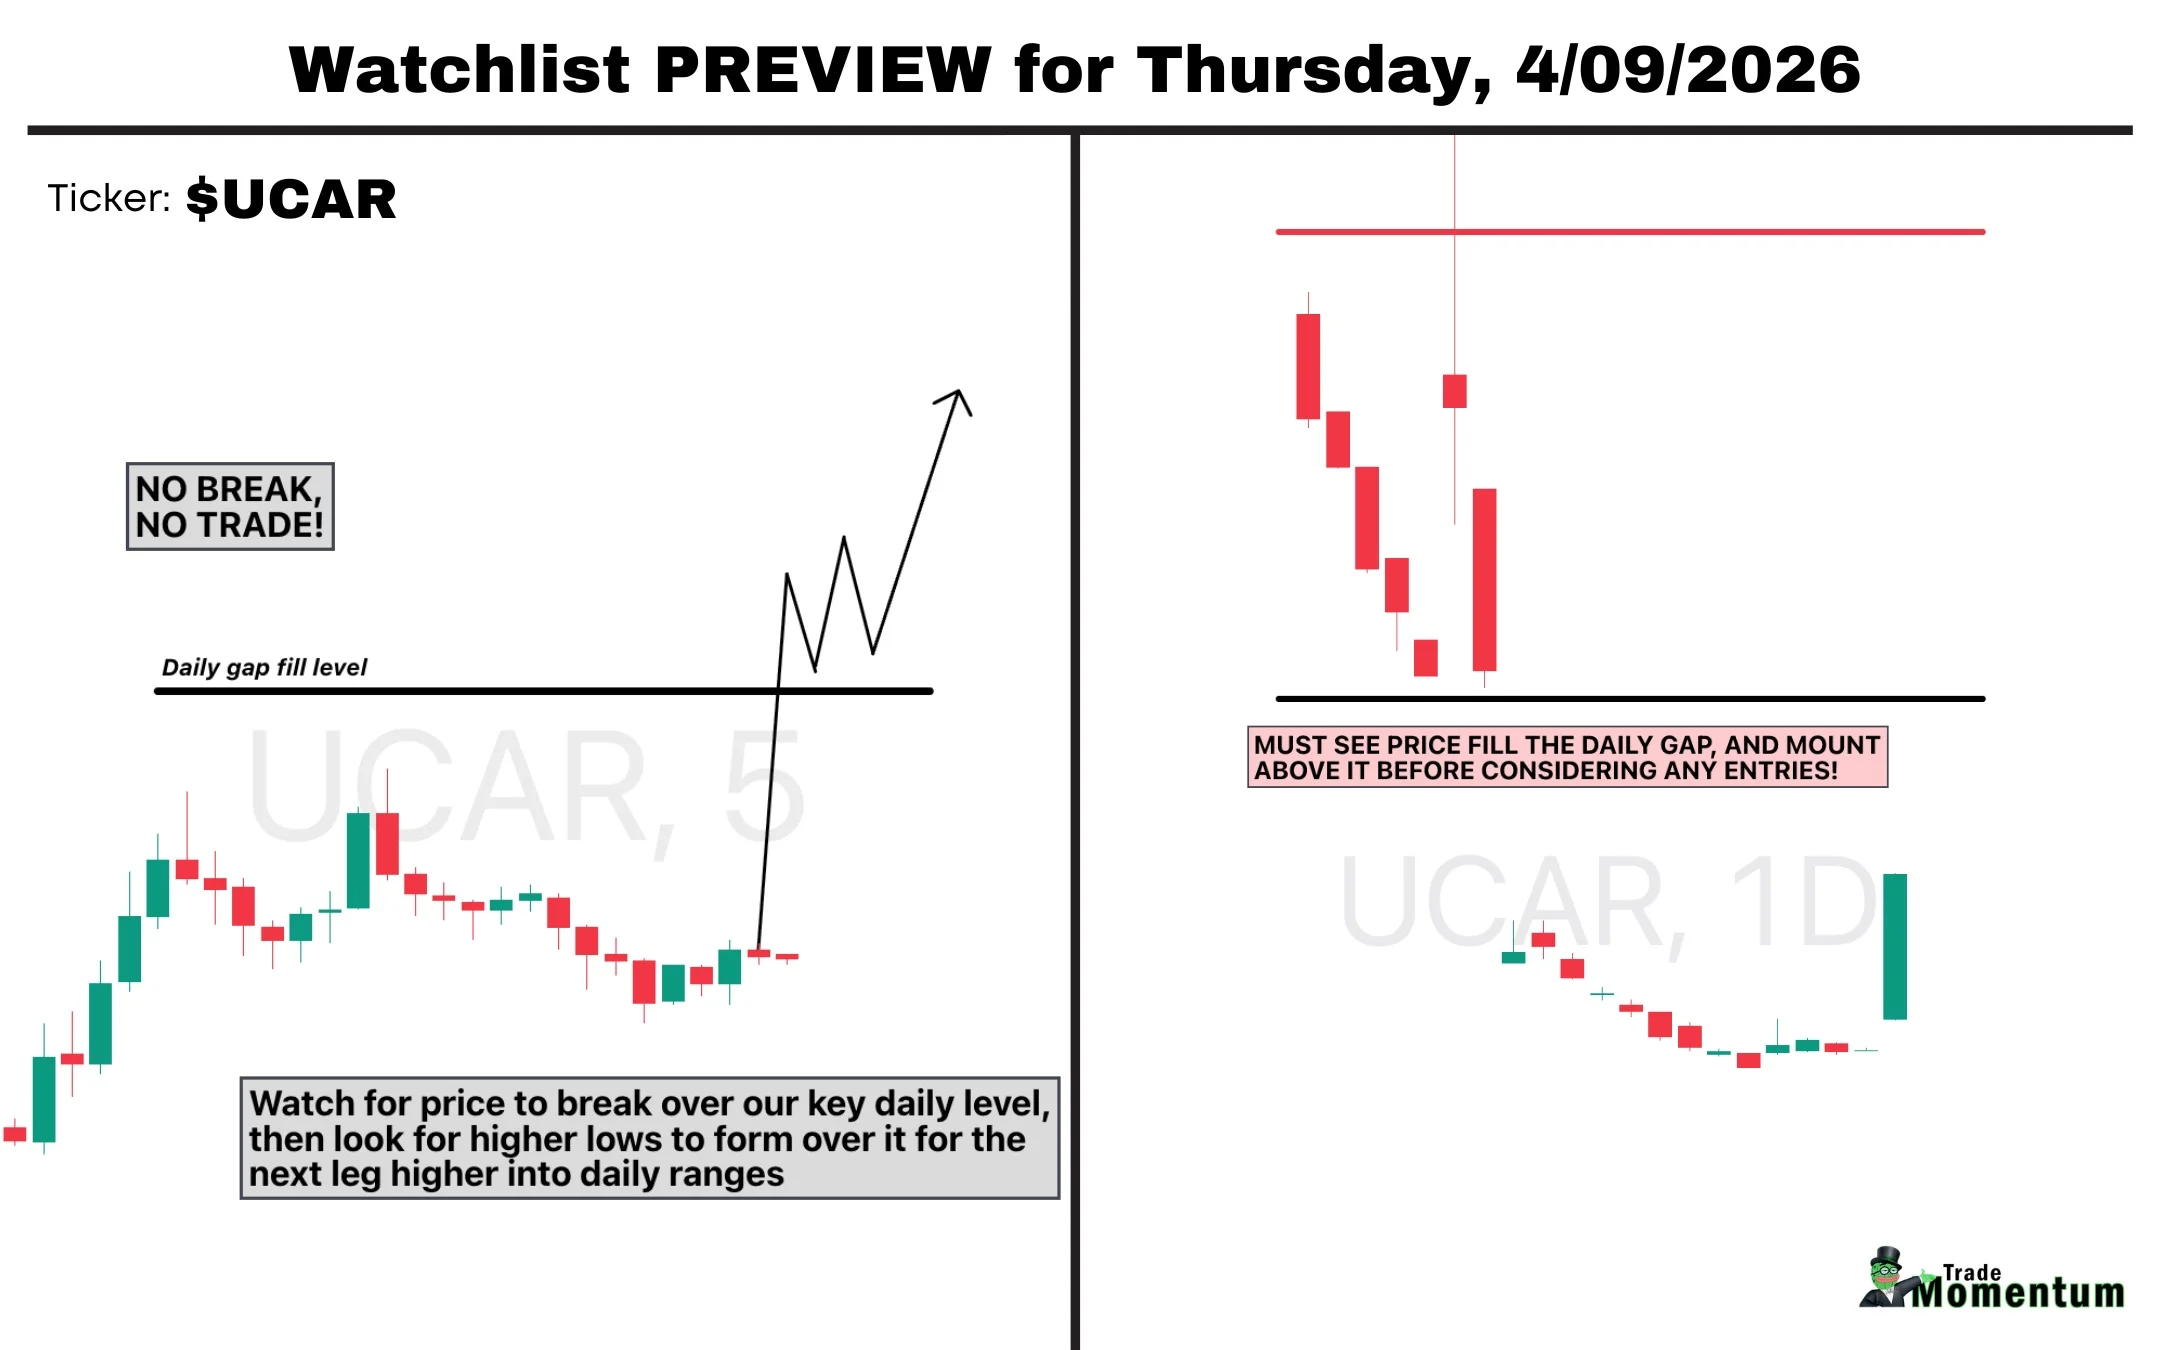
UCAR Spikes 33x Volume; Watch for Gap‑fill Breakout
Over 33x relative volume on $UCAR today, and I'll be hawking it on a potential day 2 move/gap & go setup tomorrow IF it can setup OVER the daily gap fill level as shown below. If this doesn't break and base...

VIX May Have Shifted Trend—Implications Unclear
Has the $VIX broken its rate of trend? Does it matter? I mull it over.. @stockcharts https://t.co/pLhBGqVXTt https://t.co/IidONIUenY

Bitcoin Poised to Break Out Above $71,500 Support
💥BITCOIN IS TRYING TO BREAKOUT If it holds here as support, it could finally confirm an S/R flip of $71,500 This could signal a breakout after two months of consolidation The expansion could be FAST 📈 https://t.co/IX4nxVCRYJ

Rules Over Emotions: My Proven Trendline Strategy
Trading needs rules. Rules override emotions. That's why I developed my own strategy for drawing and trading trendlines. According to the comments on this video, it's one of my best ones. Make sure to watch👇 https://t.co/d6JgGf0WeC

Crude Oil Returns to 2022 War-Level, Hits 2023 High
Crude Oil back into the 2022 Russia/Ukraine War breakdown pivot and 2023 high. This is a key level. $CL_F $USO $OIL https://t.co/ehl0hXXoRO
AIM Up Candle Faces Bearish EMA, Neutral RSI
#AIM All Share big Up Candle. Resistance 782, 800, 820. Support 741, 726, 700. RSI 48 near Neutral. 13/21 day EMAs Bearish. Top Bollinger Band 760. Midpoint Line 727. Bottom Band 693.

Nasdaq Faces Comp Gap, Near 50‑Day MA Resistance
#Nasdaq Comp Gap up and small Down Candle. Closed on 50 day MA Line. Resistance 23320, ATH 24020. Support 22000, 21371. RSI 54 near Neutral. 13/21 day EMAs Bearish but Lines converging. On verge 8/21 Bull Cross. Top Bollinger Band...
Leveraged ETFs Trigger $18B Inelastic Buying
Classic all day stall. In aggregate 18BN got bought completely inelastically simply because leveraged ETF's rebalanced. Enough buy demand to sustain the gap.

S&P's 6% Six-Day Rally Raises One-Year Return Odds to 81%
This is now a powerful "triple six" rally. The S&P rallied 6% in 6 days from a 6-month low. It failed in 2001 and was painful in 2008. But otherwise, excellent one-year returns. It bumped up the probability of a positive one-year return...

Software Slumps While Emerging Markets Rally Strongly
Software a little sore today.. $PLTR off big. $TSLA lags among mega caps. $SMH +5.6%.. $EWY +9.7%... $EEM +5.3% https://t.co/Ax62G8RLpM

Overnight Volatility Fades, S&P Climbs 2.
An exciting overnight, but a snoozer daytime session... narrow S&P 500 range... +2.4% into the close @stockcharts https://t.co/LNYfv0dbGY

Software Stocks Squeezed as Tesla
$TSLA $PLTR $APP used this gap for liquidity HARD - and software is getting smoked again w/ pressure.

Rare SPY DMA Breach Foreshadows 13‑16%
BTIG, with a “bearish stat”: “.. Since 2003, SPY has opened above both its 50 and 200 DMA while closing below both the day prior just three other times .. “.. Those three periods saw immediate declines of -13%, -16%, and -13%...

Software Leads, Growth Falters, Confirming Market Peak
Growth had turned down sharply vs. Value last October while Software had gotten a headstart on the recent turbulence throughout March. This breakdown in R3k breadth was one of many things that gave a pretty clear signal into late...

WTI and Dollar Set for Sharp Drop, Rebound Looms
There were quite a number of factors that suggested WTI and the US Dollar were on the verge of a big plunge which coupled with recent market breadth improvement & cyclical low possibilities in early April, pointed to a rebound...
Prefer Long XLP Over Volatile Bounces, Says Carter Worth
"I'd rather be long this than the other things that have had impetuous bounces and that are likely to have to give back some or all of the bounce." 🎙️ @CarterBWorth gives his $XLP take on MRKT Call with @GuyAdami https://t.co/rV5CrDFynU

SPY Shifts From Support to Resistance, Expect More Choppy Action
$SPY Nice support to resistance move. Now just battling with the next boss. Might be more chop to come this week. We had a good 20 hours LOL https://t.co/Hgm9vIFYkQ
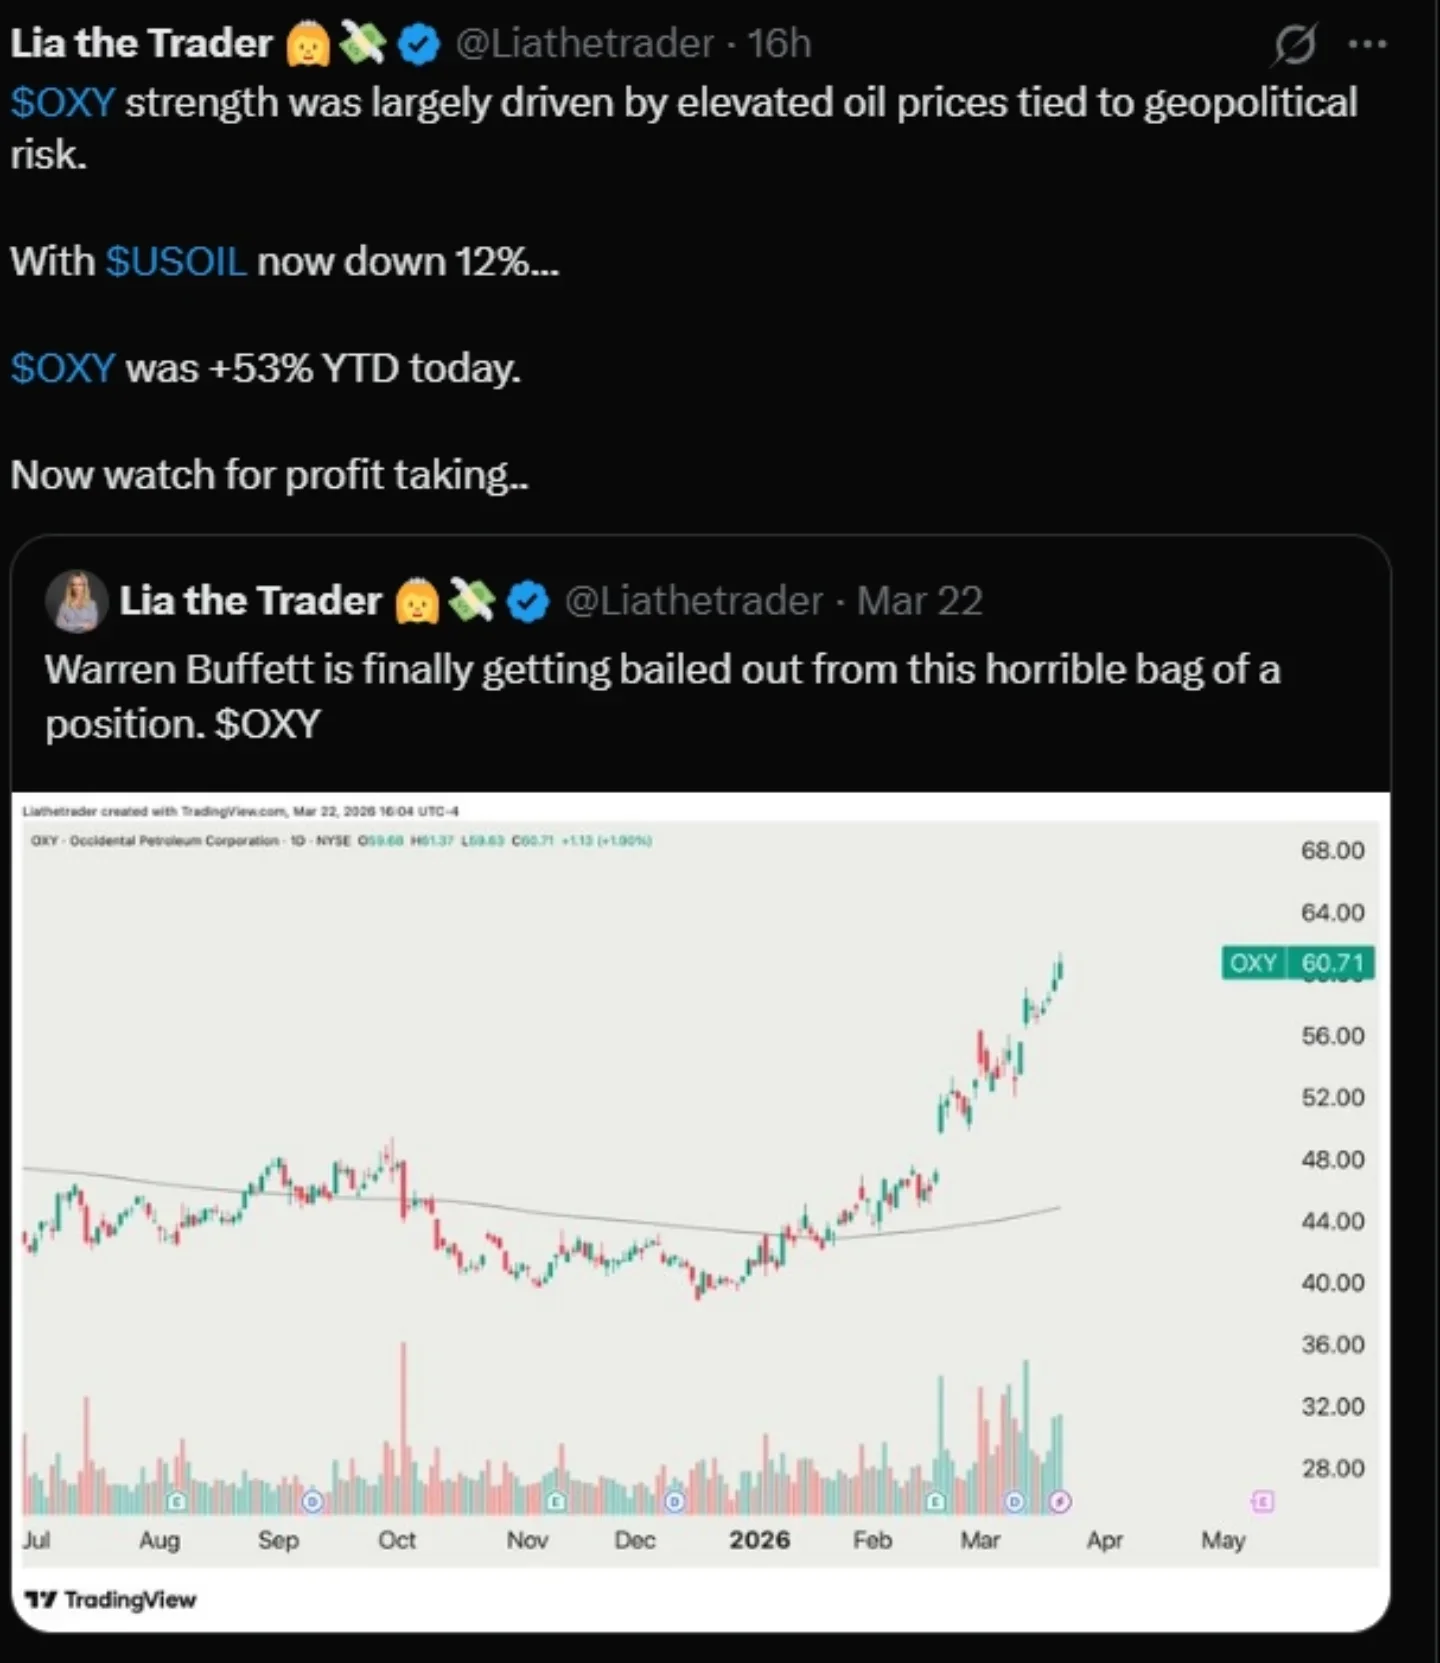
Fast Oil Rallies Can Unwind Quickly, Watch Profit Taking
$OXY didn’t rally by accident… it rode the wave 🌊 Elevated oil prices + geopolitical tension = fuel for a massive move. But now? $USOIL just dropped -12% $OXY still sitting +53% YTD That disconnect doesn’t last forever. Smart money knows: What goes up fast… can unwind...

Letting Gap‑Up
Trading no green to red and have some names that had nice gap ups so put many into let it ride with a variety of stops.
Buy Intraday at Higher Price to Confirm Trade Levels
Better process thought: sometimes (when an immediate-term TRADE Level needs to confirm) its better to buy it intraday at a higher price. I'll explain that on The Macro Show tomorrow if you want to ask a question about it, Peter

Semiconductor Equipment Stocks Rebound After Brief SOX Dip
FormFactor $FORM joins a number of Semis & Semi-Cap Eqpt stocks which have begun to strengthen again meaningfully after $SOX recent breakdown attempt proved short-lived. @marketsurge @IBDinvestors charts found here: https://t.co/vmgJqlzgJC https://t.co/2E6uI606EH

Rare Streak: S&P 500 3%+ Weekly Gains
Just in case... How many times has the S&P 500 gained 3% or more in consecutive trading weeks? Fascinating number of April's here, especially if 04/10/2026 gets added to the list. $spx 10/28/2022 5/29/2020 4/17/2020 ...

Rising VIX Triggers New SPY and QQQ Short Positions
@thestreetpro Wed, Apr 8 at 1:22 PM Initiating Index shorts: * $SPY $676.06 * $QQQ $607.33 I am keying my short entry points on the action of the VIX - which is now at 21.25 more than +$1 from the day's low of 19.99 (and...
My Theories Prove Right: Calls Gap up, Hold Key Levels
While they arguing my theories…every call on my board gapped up & now holding key levels🤷🏾♂️